22 Stage 4: Anticipation
Wherever mankind has been able to measure things, which means to transform or reduce them to numbers, it has indeed made great progress both in understanding and in controlling them.
—Charles Van Doren
In this chapter, I describe the practices that characterize the anticipation stage of risk management evolution. Individuals from the project team receive training in a measurement process and risk metrics. Measures are used to quantify risk and anticipate predictable risks. Through the application of a measurement process to risk comes an appreciation of the value of risk metrics and the insight that you cannot manage what you cannot measure.1 People know that risk can be quantified. Metrics are reported to provide insight into the risk management process. The value of risk metrics lies in the ability of aggregated data to confirm or deny estimates. Estimates are refined over time using the Living Lifecycle Model [Gorsuch97]. Risks are shared and acted on cooperatively by both project management and the customer. Status indicators are used to trigger corrective action. This is what we observe in the anticipation stage project. The project name was omitted. The account of the people, measures, risks, and analysis of the project was not.
1 In his book, Controlling Software Projects, Tom DeMarco said, “You can’t control what you don’t measure.” [DeMarco82]
This chapter answers the following questions:
![]() What practices characterize the anticipation stage?
What practices characterize the anticipation stage?
![]() What is the primary project activity to achieve the anticipation stage?
What is the primary project activity to achieve the anticipation stage?
![]() What can we observe at the anticipation stage?
What can we observe at the anticipation stage?
22.1 Anticipation Project Overview
The project is a central database for tracking assets distributed across the country. The technical challenges for the system include a very large database with fast response time, a national network with multiple protocols, improvement of accuracy and speed for complex asset identification algorithms, and custom development (hardware and software) for asset scanning. The customer’s primary concerns were technical functionality and initial operating capability in 30 months after receipt of order.
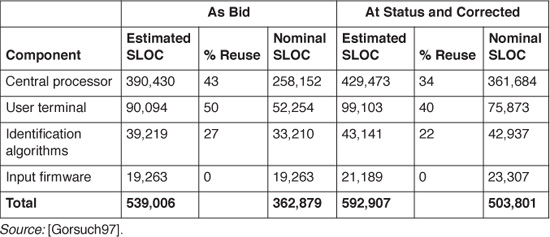
The software development organization recently had been assessed at SEI Level 3 [Paulk93]. The project was won by the organization as a technically compliant, schedule-compliant, lowest-cost bidder. The organization’s proposal included a constructive cost model (COCOMO) development model, which completely characterized the expected software development task [Boehm81]. The development was divided into four components: central processor, user terminal, identification algorithms, and input firmware. The total size of the effort was estimated at over 360K nominal source lines of code (SLOC). The model was optimistic on the talent and teamwork available for the project. The capability and experience parameters of several components in the model were rated highly, as was the team cohesion, which included customer involvement. The architecture was considered well on its way to being complete given that a feasibility prototype demonstration was performed as a part of the bidding process. The central processor (CP) development effort would take advantage of a fourth-generation language (4GL) COBOL development tool. All of these factors were included in the as-bid development model. The software portion of the development was expected to require 33.7 months, $27 million, and 45 developers to complete.
22.2 Proactive Risk Management
Even with good intentions and well-formulated plans, any software development effort includes an element of risk. Management knew that a proactive approach to risk would be required to win and execute the contract, and they understood that how well they managed their risks would make the difference between project success and failure. In this section I discuss how risk was reduced in the proposal phase to win the contract and how the project team was organized to manage risk.
22.2.1 Propose Requirements for Risk Management
Prior to contract award, a proved, low-risk design demonstrated system performance by a functional prototype built with commercially available technology. The project team proposed a team-building conference upon contract award and customer participation in the project risk management organization. They also offered electronic on-line access to the project team and all project activities. Early in the proposal phase, schedule, technical, and cost risks were analyzed, and a risk reduction plan was baselined. The risk reduction plan described the plan to reduce risk to an acceptable level. To reduce schedule risk, the project development was extended over 30 months. To reduce technical risk, key technologies not available in commercial products were demonstrated. To reduce cost risk, realistic bases of estimate were used from a cost history database, which increased confidence in the accuracy of the cost forecast.
22.2.2 Develop the Risk Management Approach
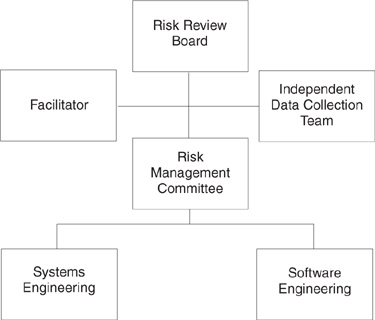
After contract award, risk management became an integral part of the system management approach. The risk management methodology was developed and documented in a risk management plan. The chief systems engineer prepared the plan by tailoring the soft copy plan maintained in the software engineering process group (SEPG) repository. The roles and responsibility for risk management were tailored by defining a hierarchical structure shown in Figure 22.1. Overall responsibility for ensuring that the risk management plan was peer reviewed, managed, and controlled was assigned to the project manager. The roles and responsibility defined for each organizational element are described below:
![]() Risk review board. Composed of key project leaders, the board directed the risk management process. The members also assigned responsibility and resources to high-priority risks and reported status to senior management regularly.
Risk review board. Composed of key project leaders, the board directed the risk management process. The members also assigned responsibility and resources to high-priority risks and reported status to senior management regularly.
![]() Risk management committee. A risk management committee is a group of people with responsibility for directing risk management activities. The committee, composed of representatives from the project team and customer, analyzed identified risks, made recommendations, and prepared action plans. They also assigned responsibility and resources to implement the risk action plan and reported status to the risk review board monthly.
Risk management committee. A risk management committee is a group of people with responsibility for directing risk management activities. The committee, composed of representatives from the project team and customer, analyzed identified risks, made recommendations, and prepared action plans. They also assigned responsibility and resources to implement the risk action plan and reported status to the risk review board monthly.
Figure 22.1 Risk management organization. The risk management structure comprises five organizational elements and a facilitator.
![]() Independent data collection team. Composed of members of the organization SEPG, representatives from the project team, and the customer, the team collected data on risks in an open and nonthreatening environment. They also prepared the baseline risk database and reported their findings to the project team at major milestones.
Independent data collection team. Composed of members of the organization SEPG, representatives from the project team, and the customer, the team collected data on risks in an open and nonthreatening environment. They also prepared the baseline risk database and reported their findings to the project team at major milestones.
![]() Chief systems engineer. The chief systems engineer was responsible for ensuring that systems aspects of the risk management plan were addressed.
Chief systems engineer. The chief systems engineer was responsible for ensuring that systems aspects of the risk management plan were addressed.
![]() Chief software engineer. The chief software engineer was responsible for ensuring that the software aspects of the risk management plan were addressed managing the software risks. This person was the link between the risk management committee and the technical staff.
Chief software engineer. The chief software engineer was responsible for ensuring that the software aspects of the risk management plan were addressed managing the software risks. This person was the link between the risk management committee and the technical staff.
The risk management approach included identification of programmatic and technical risk by everyone on the project. Early in the project, customer and subcontractor organizations were included in a project risk assessment. The independent risk assessment provided the team with a baseline of identified risks for the project to manage.
22.3 Organization Measurement Practices
The organization’s measurement procedures were defined in three guidebooks. The software development handbook related the organization’s policies and standards with an overview of required practices and introduced the need for the detailed software management and software engineering guidebooks. The software management guide covered project planning and management, configuration management, development environment, and quality assurance guidebooks. It dealt with software project management and was the primary source of measurement guidance. The software engineering volume included requirements analysis, design methods, coding standards, integration and test, peer review, and software reuse guidebooks. Other functional areas (e.g., project management and systems engineering) also developed and adopted procedure guidebooks, which were integrated with the software procedures.
22.3.1 Collect Core Measures
The organization’s measures and metrics were defined in the software management guide. The organization core measures for software management were size, hours, and defects. The project collected all three measures on a regular basis.
Size of the software was estimated according to the SEI line of code counting definitions [Park92]. The organization had procedures for estimating size of new development, reuse code, and nondevelopment item or commercial off-the-shelf (COTS) software. An automated code counter program, defined and maintained by the SEPG, was required for all projects. Initial size estimates were developed by a group of experts using a delphi consensus process and reviewed at all major milestones. Indicators of expected effort versus actual effort with respect to a development phase and software component were used to trigger intermediatesize estimate updates. The SEPG accumulated organization-wide size metrics, including development language, estimate and actual variation, reasons for variation, and changes in expected COTS and reuse usage.
Hours expended on a project were collected through time cards and the corporate cost history database. Separate work detail numbers were allocated for each development phase, software product component, and functional activity. Hours expended per task were compared monthly to hours estimated for the task. The SEPG collected hours expended on a project phase basis.2 Rework measures were also collected using a work order number established as part of the cost history database.
2 The SEI has developed a framework for counting staff hours [Goethert92].
Defects are found primarily in requirements, design, and code. Defect data were collected through a configuration management tool.3 A useful indicator of product quality and expected rework is the number of defects relative to the norm for each project phase. Higher-than-norm defects are often an effect of inaccurate estimation and a catalyst for project oversight. Defect measures were categorized by project phase, defect type, defect severity, and correction priority.
3 The SEI has developed a framework for counting defects [Florac92].
22.3.2 Indicate Return on Investment
The three core measures of size, hours, and defects were used by the project team to improve performance and refine estimates. The measures were accumulated by the SEPG at the end of each development phase to develop cross-project trend data for evaluating improved processes and return on investment. Trend data are necessary for estimating future development efforts. The core measures were the only ones aggregated for the organization, although additional measures may be collected by project teams to facilitate project control.
Some averages from early metrics analysis for the organization showed a need for an established, repeatable process. One such metric was the size estimation accuracy per phase. Proposal submission size estimates averaged 56 percent of the final product size. Through awareness and a defined process, this metric improved as the organization matured. Another revealing metric was the productivity by language type, which varied by a factor of four among the organization’s common languages of Ada, FORTRAN, C, C++, Pascal, and PL/1. An indicator of process improvement return on investment was the average software productivity, which improved by 29 percent over the five years of the organization’s software process improvement initiative.
22.4 Risk Management Committee
The risk management committee received all potential risks submitted on a properly completed identification section of a risk management form. All identified risks were logged in the project risk database and maintained in the risk database for measurement and evaluation. The risk management committee assessed the risk as high, moderate, or low. Risk action plans were developed for moderate-and high-risk areas, and low-risk areas were monitored and managed through weekly project control meeting action items. The risk management committee was scheduled to meet weekly through system design, twice monthly during preliminary design, and monthly during development, integration, and test. Fewer than ten people served on the committee. Unfortunately, these people were not colocated.
22.4.1 Use Innovative Methods
One of the problems with addressing risk is how to communicate the issue with all the assumptions and associated uncertainty. You might believe that face-toface verbal communication is not possible when two parties are not located in the same room. The risk management committee thought that it was possible and met using a videoconferencing system. The risk agenda, risk minutes, and risk ranking list were all sent by fax prior to the meeting. Using technology, the risk management committee could discuss new risk, coordinate risk issues, and report on progress in an efficient manner.
22.4.2 Quantify the Risk Index
New processes should be piloted before being mandated on projects. The same is true of process metrics. The project was selected by the system engineering process team to pilot process metrics. The purpose of the metrics pilot program was to evaluate the validity and usefulness of metrics in measuring the effectiveness of the system engineering process. Benefits of the pilot program included training in the measurement process and the ability to influence the organization’s set of mandatory process metrics. The project was required to collect data on seven metrics over a three-month period:
1. Requirements stability.
2. Requirements clarity.
3. Action item response.
4. Risk count.
5. Risk management index.
6. Phase end report.
7. Cost history.
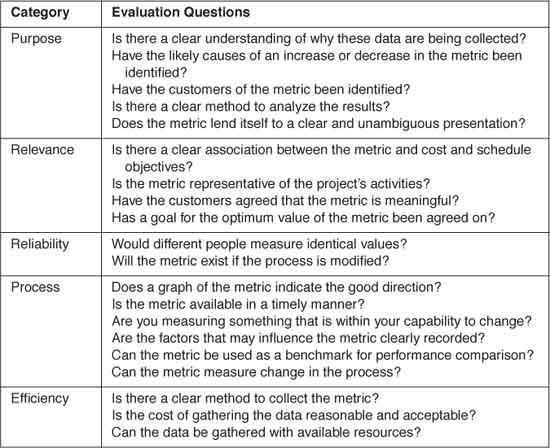
The project was required to provide feedback on the effort and usefulness of the metrics. A metrics evaluation form was written for each metric. The evaluation categories and questions from the metrics evaluation form are shown in Table 22.1. Feedback from the chief systems engineer was that the risk management index was the most significant of the piloted metrics in terms of customer satisfaction.
The risk management index quantifies the risk exposure for all active risks as a percentage of the total program cost. The chief systems engineer had presented quantifiable risk data to the customer at project reviews.
22.5 Living Lifecycle Model
The project had proceeded nominally per plan with typical perturbations up to the middle of the code and unit test phase. At that point, an analysis of current status indicators predicted problems meeting the original project estimates. The analysis consisted of updating the original development model parameters based on the current project status. A Living Lifecycle Model is one where the cost model is updated using actual measures to predict project completion. An analysis of the variance between estimates and actuals served as a trigger for corrective action.
This section describes how low-risk items, when summed together, can cause critical project risk that requires management attention.4
4 Special permission to reproduce an example of the Living Lifecycle Model is granted by Level 6 Software.
22.5.1 Analyze Status Indicators
Major project risk was discovered by comparing the as-bid development model to the current project status. As shown in Table 22.2 most indicators were less than 20 percent off expectations. However, the number of indicators exceeding threshold flagged a serious problem.
Table 22.2 Tracking Status Of Indicators (Source: [Gorsuch97])
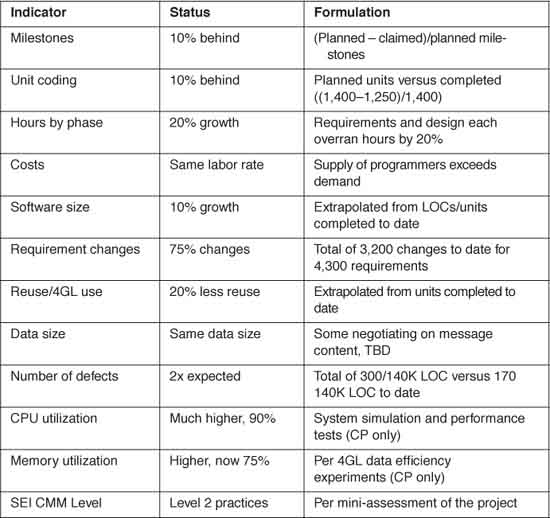
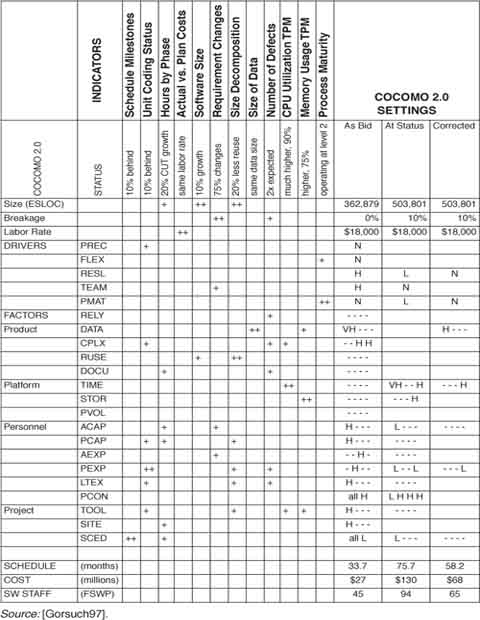
Table 22.3 Living Lifecycle Model Prediction
Scaling Drivers: |
|
PREC | precedentedness |
FLEX | development flexibility |
RESL | architecture/risk resolution |
TEAM | team cohesion |
PMAT | process maturity |
Product Factors: |
|
RELY | required software reliability |
DATA | data base size |
CPLX | product complexity |
RUSE | required reusability |
DOCU | documentation match to life cycle needs |
Platform Factors: |
|
TIME | execution time constraint |
STOR | main storage constraint |
PVOL | platform volatility |
Personnel Factors: |
|
ACAP | analyst capability |
PCAP | programmer capability |
AEXP | applications experience |
PEXP | platform experience |
LTEX | language and tool experience |
PCON | personnel continuity |
Project Factors: |
|
TOOL | use of software tools |
SITE | multisite development |
SCED | schedule |
Note: Other acronyms from Table 22.3 are listed below but should appear in the text.
COCOMO | constructive cost model |
ESLOC | equivalent source lines of code |
CUT | code and unit test |
CPU | central processing unit |
TPM | technical performance measurement |
SW | software |
FSWP | full-time software personnel |
L | low |
N | nominal |
H | high |
VH | very high |
Using the Living Lifecycle Model, it became obvious that the original completion plan could not be met. As shown in Table 22.3, the Living Lifecycle Model maps the project status to COCOMO parameters according to a cross-reference to predict project completion. Three different development models show the parameter inputs for COCOMO:
![]() As bid—the proposed project cost and schedule.
As bid—the proposed project cost and schedule.
![]() At status—the current phase (i.e., code and unit test) status check.
At status—the current phase (i.e., code and unit test) status check.
![]() Corrected—the predicted set of parameters after corrective action.
Corrected—the predicted set of parameters after corrective action.
The scaling drivers are the same across all four components of the system. The product factors for the four components are grouped together in a single cell. For example, “- - H H” represents “nominal, nominal, high, high” settings for central processor, user terminal, identification algorithms, and input firmware, respectively. Dashes are used for “nominal” to enhance readability. Moving to each model at the right, only changes are listed. For example, the at-status model changed team cohesion from high to nominal. The schedule, cost, and staff numbers at the bottom are recorded from the COCOMO model [USC96] using the listed parameters. The line of code summary is included in Table 22.4.
The at-status COCOMO parameters were modified from the as-bid parameters per the cross-reference table. For example, input parameters were changed as follows:
![]() Team cohesion (TEAM) dropped to nominal based on high tension due to excessive requirements change.
Team cohesion (TEAM) dropped to nominal based on high tension due to excessive requirements change.
![]() Architecture/Risk resolution (RESL) dropped to low based on excessive requirements volatility.
Architecture/Risk resolution (RESL) dropped to low based on excessive requirements volatility.
![]() Process maturity (PMAT) dropped to SEI Level 2 based on a miniassessment of the project.
Process maturity (PMAT) dropped to SEI Level 2 based on a miniassessment of the project.
![]() Execution time constraint (TIME) was increased to very high for the central processor based on CPU utilization technical performance measure.
Execution time constraint (TIME) was increased to very high for the central processor based on CPU utilization technical performance measure.
![]() Analyst capability (ACAP) dropped to low for the central processor based on excessive requirements changes and extended effort to complete the requirements phase.
Analyst capability (ACAP) dropped to low for the central processor based on excessive requirements changes and extended effort to complete the requirements phase.
![]() Personnel continuity (PCON) dropped to low for the central processor due to high turnover at the subcontractor.
Personnel continuity (PCON) dropped to low for the central processor due to high turnover at the subcontractor.
The majority of the changes took place in the central processor and input firmware. The central processor changes were due to requirements growth, observed lack of analyst and programmer experience, and the lowered performance margins due to the inefficient code generated by the 4GL. Using a development model update to study the effects of accumulated indicator variances is quite startling. As can be seen from the model summary data at the bottom of the table, the effects are significant. The modeled schedule increased from 33.7 months to 75.7 months (over 6 years). The cost grew from $27 million to $130 million. The staff required grew from 45 to a potential need for 94 developers.
Table 22.4 Line of Code Estimates as Bid and During Code and Unit Test
22.5.2 Take Corrective Action
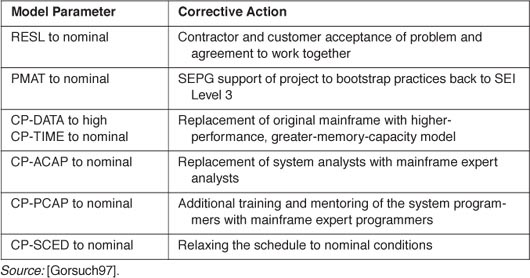
The severity of the potential problems was anticipated through analysis of a complete set of project indicators. Each indicator reviewed in isolation would not have identified how far off course the project was. Only the system perspective—the big picture—showed the extent of the change necessary to get the project back on track. This is the point where corrective action was taken to save the project from certain failure. Table 22.5 lists the changed COCOMO model parameter and corresponding corrective action required to change the parameter and save the project. The result of the replan was a 56-month schedule, $64 million software cost, and need for 63 developers.
22.5.3 Predict Project Performance
Through the use of the Living Lifecycle Model, the project management team was able to identify the necessary replan. The return on investment for this schedule risk was calculated as cost avoidance relative to the cost of the required risk management activity. The cost avoidance was calculated as two months down the wrong path for each of the project engineers. The risk management cost included the routine risk management activities and the research to investigate the effects of multiple small variances in project indicators using the Living Lifecycle Model.
Table 22.5 Mid Course Corrections
(The replan costs were not included; they were assumed to be inevitable at a later date.) The calculations show that the project ROI(schedule risk) was 23 to 1:
Savings: 25,600 labor hours cost avoidance (2 months x 80 engineers x 160 hours/month).
Cost: 1,120 labor hours:
480 hours meetings (10 engineers x 1 hour/week x 48 weeks).
320 hours assessment (40 hours x 8 engineers on average).
320 hours model research (1 engineer x 320 hours).
ROI(schedule risk) | = 25,600 labor hours/1,120 labor hours. |
| = 23 to 1. |
The project was completed at an overall cost of $110 million with about $65 million for software development. The initial operating capability was achieved in 4.5 years from the start date. Without the measurements, indicators, and project risk analysis, the project would surely have continued to the point of no return and then been written off as a failure. Updating the development model with accumulated effects of the project indicators amplifies the danger and provides an early warning system.
22.6 Summary and Conclusions
In this chapter, I described the practices that characterize the anticipation stage of risk management evolution. These practices include training a measurement process and quantifying risk exposure. Risk metrics are reported to the customer. Core measuresare collected and periodically analyzed together with refined developmentmodel parameter inputs to predict the completed project in terms of cost, schedule, and staff. The projection using actual measures yields a more accurate picture of the future. By this early warning system, anticipated problems are avoided through corrective action.
The primary project activity to achieve the anticipation stage is training of the measurement process and definition of measures used to evaluate risk quantitatively. Piloting the metrics for process improvement is the key to reporting risk management metrics that provide management insight. The involvement of the customer in collaborating on risk issues provides a shared understanding of project issues. The Living Lifecycle Model accumulated indicators during the development life cycle. The results show how the model can predict the project’s future. The model improves the utility of measurement practice.
At the anticipation stage, we observed the following:
![]() Several risk management champions. Approximately 20 people participated in the organization to identify and manage project risks. The organization had three major elements—a risk review board, a risk management committee, and an independent data collection team—and a facilitator.
Several risk management champions. Approximately 20 people participated in the organization to identify and manage project risks. The organization had three major elements—a risk review board, a risk management committee, and an independent data collection team—and a facilitator.
![]() Measurement process discipline. A set of core measures provided data to assess status and risk quantitatively. Return on investment of 23 to 1 for a significant schedule risk provided assurance that a costly replan was worthwhile. Automated tools such as a project scheduling tool, configuration management tool, and cost history database ensured process consistency (i.e., standard definition and regular collection).
Measurement process discipline. A set of core measures provided data to assess status and risk quantitatively. Return on investment of 23 to 1 for a significant schedule risk provided assurance that a costly replan was worthwhile. Automated tools such as a project scheduling tool, configuration management tool, and cost history database ensured process consistency (i.e., standard definition and regular collection).
![]() Problem prediction. Analysis of the project cost model showed how the summation of a small variance (e.g., 10 percent) in several status indicators yields a large risk. This prediction triggered corrective action because of the faith in the accuracy of the refined cost model.
Problem prediction. Analysis of the project cost model showed how the summation of a small variance (e.g., 10 percent) in several status indicators yields a large risk. This prediction triggered corrective action because of the faith in the accuracy of the refined cost model.
22.7 Questions for Discussion
1. What software process assets does an organization assessed at SEI maturity Level 3 possess? In your opinion, how valuable are these assets?
2. Do you agree that a proactive approach to risk makes the difference between success and failure? Discuss why you do or do not agree.
3. Discuss the similarities and differences between a risk management committee and a single risk manager. Which would you choose for your project? Explain your answer.
4. Give five reasons that a measurement process is important. How could you ensure that the measurement process is cost-effective?
5. List the minimum set of measures required to know whether to change a plan. Discuss the relationship among these measures.
6. Discuss the value of a risk metric. What would you expect the graph of the risk metric to show over the project life cycle?
7. Why should the project cost model parameters be updated based on the current status? Do you agree that using current parameters can predict project completion? Discuss why you do or do not agree.
8. Explain how the summation of a small variance (e.g., 10 percent) in several status indicators yields a large risk.
9. You are a measurement analyst who is responsible for project variance reporting. Your analysis concludes that although no thresholds have been exceeded, corrective action is needed. Recommend the corrective action based on your measurement data. Use a cost model to support your findings.
10. Discuss how measurement makes known that which was previously unknown. In your opinion, what are the consequences of measurement?
22.8 References
[Boehm81] Boehm, B. Software Engineering Economics. Englewood Cliffs, NJ: Prentice-Hall, 1981.
[DeMarco82] DeMarco T. Controlling Software Projects. New York: Prentice-Hall, 1982.
[Florac92] Florac W, et al. Software quality measurement: A framework for counting problems and defects. Technical report CMU/SEI-92-TR-22. Pittsburgh, PA: Software Engineering Institute, Carnegie Mellon University, September 1992.
[Goethert92] Goethert W, et al. Software effort and schedule measurement: A framework for counting staff-hours and reporting schedule information. Technical report CMU/SEI-92-TR-21. Pittsburgh, PA: Software Engineering Institute, Carnegie Mellon University, September 1992.
[Gorsuch97] Gorsuch T. Dynamic project measures in a living-lifecycle model. Proc. Eighth International Conference on Applications of Software Measurement, Atlanta, October 1997.
[Park92] Park R. Software size measurement: A framework for counting source statements. Technical report CMU/SEI-92-TR-20. Pittsburgh, PA: Software Engineering Institute, Carnegie Mellon University, September 1992.
[Paulk93] Paulk M, et al. Capability Maturity Model for Software. Version 1.1. Technical report CMU/SEI-93-TR-24. Pittsburgh, PA: Software Engineering Institute, Carnegie Mellon University, 1993.
[USC96] USC Center for Software Engineering. USC COCOMO 2.0 Reference Manual. Los Angeles: University of Southern California, 1996.
[Van Doren91] Van Doren C. A History of Knowledge. New York: Ballantine, 1991.