
“You can observe a lot just by watching.”
IN THIS CHAPTER
- Reviewing existing information
- Interviewing internally
- Creating a draft map
- Contextual inquiry and analysis
- Quantitative research
- Case Study: Music Curation: User Research and Diagramming at Sonos
I’m often stunned by how little some organizations know about the people they serve. Sure, they may have detailed demographic data and comprehensive purchasing statistics and the like. But they fail to understand the fundamental needs and motivations of their customers.
Part of the problem is that people’s behaviors are often irrational. They act on emotions and subjective beliefs. These are harder to understand and quantify, and are generally not part of the business vernacular.
I’ve come across many organizations with low appetites for understanding the customer experience. These same organizations might be willing to spend tens of thousands on market analysis reports. But getting out, speaking with customers, and observing them directly receives little funding.
It’s not just a matter of money. I’ve worked with plenty of companies that simply avoid in-depth investigations of the customer experience. Uncovering deep emotional connections to products and services is a messy endeavor. Instead, they focus on things like operational efficiency and short-term gains.
Creating diagrams of experiences breaks this pattern of organizational navel gazing. It shifts the mindset from inside-out to outside-in. Of course, the diagrams themselves don’t create empathy, but they spark and guide the conversations that do.
It all begins with investigation. Research is necessary to inform and provide confidence. Otherwise, conclusions and decisions are made based on conjecture.
What’s more, research into the customer experience is typically eye-opening. There’s a healthy reality check for everyone involved. I tend to uncover insights that the organization didn’t know about or even suspect.
For instance, on one project for an educational testing service, my research team found several educators doing extra calculations with spreadsheets and sometimes even by hand on paper. Adding a mechanism to do these online was simple, but no one was aware of this need until we observed it. It wasn’t something users ever complained about or asked for: they just accepted the system the way it was.
People use products and services in unintended ways. They find hacks and workarounds. They invent novel uses and applications of the offering. In doing so, they may fabricate their own satisfaction.
Peter Drucker, the renowned “father” of modern management, famously wrote:
The customer rarely buys what the company thinks it sells him. One reason for this is, of course, that nobody pays for a “product.” What is paid for is satisfaction.
Strive to uncover the value customers believe they are getting. Understanding how your offering gets their jobs done is a source of opportunity. Target your solutions to fulfill unmet needs.
This chapter covers the five main steps of investigation in an alignment diagram project.
- Reviewing existing sources of information
- Interviewing internal stakeholders
- Creating a draft map
- Conducting research externally
- Analyzing the data
The steps outlined in this chapter present a logical sequence to follow. You may find yourself moving back and forth between these activities fluidly. The process is typically more iterative than linear.
Creating diagrams of experiences breaks this pattern of organizational navel gazing. It shifts the mindset from inside-out to outside-in.
Note also that some specific techniques, such as the methods for creating a mental model diagram, may start with external user research as well. The order of activities in the process outlined in this chapter is descriptive rather than prescriptive.
Survey Existing Sources
Take advantage of existing sources of information as a starting point. Begin by reviewing insight for patterns across various resource types, such as:
Direct feedback
People typically can contact an organization in a variety of ways: via phone, email, contact forms, online comments, face-to-face service encounters, and chat. Obtain a sample of data for review—for instance, customer emails or call center logs for the past month.
Social media
Get a sense of what people are saying in social media channels about your organization and about your service. Obtain a cross section of posts that refer to your organization on sites like Facebook and Twitter.
Reviews and ratings
Tap into reviews and ratings for relevant insight. Amazon.com is famous for their reviews and ratings; so are services like TripAdvisor.com for travel and Yelp.com for restaurants. Even comments and ratings in the Apple App Store can be a source of insight.
Market research
Many organizations regularly conduct surveys, questionnaires, and focus groups—details that could inform your effort.
User testing
If your organization has performed tests in the past, review them for insight into the overall experience they are having.
Industry reports and whitepapers
Depending on the industry you are working in, there may be reports available from analysts in the field.
Consolidate Findings
You probably won’t find a single, existing source of information about an end-to-end customer experience. Most industry reports and whitepapers focus only on slices of an overall experience. And unless your organization has already done work mapping experiences, it’s unlikely you’ll have any preexisting research in house.
Instead, you’ll have to pick through and identify the relevant bits. This is a bottom-up process that takes patience and tolerance for irrelevant information. An industry report, for instance, may only include a few facts useful for your particular project.
To help comb through existing data, use a common format to review findings across source types. Organize user research findings using a simple progression of three steps—evidence, interpretation, and implications for the experience:
Evidence
First, note any relevant facts or observations from the sources of information without any judgment. Include direct quotes and data points to illuminate the evidence.
Interpretations
Explain potential causes for the evidence you identified: why did people behave or feel the way they did? Consider multiple interpretations of the observed behavior.
Implications for the experience
Finally, determine the impact of the finding on the individual’s experience. Strive to include the emotional factors motivating their behavior.
For each source, consolidate insights in a separate table. Table 5-1 shows this type of consolidation from two different source types for a fictitious software service.
The consolidation tables help sort through various information types. They then normalize findings for comparison across sources.
|
Source 1: Email feedback |
||
|
Evidence |
Interpretations |
Experience implications |
|
Many emails indicate trouble with installation, e.g.: “After going through the instructions and process several times, I gave up.” – Trial customer |
People lack the skills and knowledge to complete the installation process and get frustrated. People don’t have the time or patience to read the instructions carefully. |
Installation is a problematic phase in the journey. |
|
There were frequent questions about having admin rights to install the software, e.g.: “I got the message ‘Please contact your IT admin’ and didn’t know what to do.” |
For security reasons, many companies don’t allow employees to install software. It may be difficult or time consuming for employees to contact an IT admin. |
For users without admin rights, installation ends their experience: it’s a showstopper. |
|
Some emails praised customer support, e.g.: “The customer service agent I spoke with was really knowledgeable and helpful!” |
People like to be able to speak with a “real” person. People feel like they are getting personal attention with live agents. |
Customer support is a positive aspect of the current experience. |
|
Source 2: Marketing survey |
||
|
Evidence |
Interpretations |
Experience implications |
|
Respondents indicated that the top ways of becoming aware of the magazine are: 1. Word of mouth (62%) 2. Web searches (48%) 3. Internet ads (19%) 4. TV ads (7%) |
Customers seek input from others in their decision to purchase our software. Advertisements may not be as effective as previously assumed. |
Word of mouth plays the greatest role in becoming aware of our service. |
|
64% of customers indicated they regularly switch between a computer and mobile while using our service. |
People have a need to use the software on-the-go. |
Customers experience our software across devices. |
|
A majority of customers indicated installation was difficult or very difficult. |
Installation is not straightforward for some users. Instructions for installation are not easy to follow. |
Installation is a source of frustration. |
TABLE 5-1. Examples of consolidation of two different existing sources of information for a fictitious software service
Make Conclusions
Next, collect all the implications for the experience in a separate list. Then group these by topic. Patterns then emerge that bring your investigation into greater focus. For instance, from the tables in Table 5-1, the implication statements are shown in the simple list that follows.
- Installation is a problematic phase in the journey.
- For users without admin rights, installation ends their experience: it’s a showstopper.
- Customer support is a positive aspect of the overall experience.
- Word of mouth plays the greatest role in becoming aware of our service.
- Customers experience our software across devices.
- Installation is a source of frustration.
Some of your findings from this exercise will be straightforward and not need much validation. For instance, you may find that the ways in which people become aware of a service may not need much further research. From the example in Table 5-1, you could conclude that word of mouth is the leading way people hear about your service. If you are creating a customer journey map, you can readily include this information in the diagram.
Other points you uncover may reveal gaps in knowledge. For example, from the list of implications in Table 5-1, it’s apparent that frustration during installation is already emerging as a theme. But you may not know why this is the case. You may need to research the causes of this frustration further.
Overall, the process is grounded in evidence, moving from individual facts to broader conclusions (Figure 5-1). By breaking down findings in a common format, you can then compare themes across different sources.

FIGURE 5-1. Comb existing sources for relevant evidence, group the implications on the experience people may have, and make conclusions.
Reviewing existing sources of information not only informs the creation of a diagram, it also sets up your research agenda for the following steps in this investigation phase. You’ll have a better sense about what to ask in your next phases of research, starting with internal stakeholders.
![]() This step need not take long. Depending on the number of sources to review, it may only take a day or less to complete. Try distributing the review of sources across several members to work even quicker. Then come together and discuss the key findings in a brief meeting.
This step need not take long. Depending on the number of sources to review, it may only take a day or less to complete. Try distributing the review of sources across several members to work even quicker. Then come together and discuss the key findings in a brief meeting.
Interview Within the Organization
Alignment diagram efforts necessarily involve investigation with people within the organization. Seek out a range of people to interview. Don’t stop with the primary sponsors of the project. Include decision makers, managers, sales representatives, engineers and technicians, and frontline personnel.
At this point, your investigation is exploratory: you want to uncover the main themes to research further. The sample of people you have access to may be fairly small—only a half dozen or so in total. This also means you may only get one or two people to interview per function within the organization. If this is the case, assume your interview partner can speak on behalf of others in a similar function.
Conduct Interviews
Internal stakeholder interviews can be informal and take anywhere from 30 to 60 minutes. If many of them work in the same location, it may only take a day to complete them. Phone interviews are also possible if you can’t get with everyone face-to-face.
Open questioning works best since you’ll be talking with different types of people. This is a technique that allows you to have a free-flowing conversation. Your interviews should not be a questionnaire but rather guided discussions with participants. The goal is to explore and learn, not to take a quantitative poll. See the sidebar, “A Brief Guide to Interviewing,” for more on interviewing qualitatively with open questioning. There are three key areas to include:
Role and function
Start by getting the background of the participant. What do they do within the organization? How is their team organized? Get a sense of where they fit into the value creation chain.
Touchpoints
Everyone in an organization has some impact on the experience people have when interacting with them. In some cases, stakeholders have direct contact with customers. In this case, ask them directly about their perspective on the customer experience. Others may only have indirect contact. Either way, probe to understand their role in the user experience and the touchpoints most relevant to them.
Experience
Find out what participants think people experience when interacting with the organization. Start by understanding the flow of actions: What do customers do first? What happens after that? Also probe on how the participant believes customers feel along the way. When are they most frustrated? What delights them? When are potential moments of truth? Keep in mind their understanding may not match what customers actually experience. At this point, your investigation will generate assumptions that need to be validated with subsequent field research.
Ask participants to draw a diagram of the experience or parts of it as they describe it. Figure 5-2 shows an example of such a diagram from my own work. The sketch evolved over the course of the conversation, and allowed us to point to specific parts of the experience and dig deeper. This drawing then served as a basis for creating a diagram.

FIGURE 5-2. Have participants sketch during stakeholder interviews.
Alternatively, try using a template to have a guided conversation about the user experience. For instance, Figure 5-3 shows a PDF template created by John Kembel at Designing CX (www.designingcx.com). It outlines a generic customer journey.
![]() Present a template to your interview partners and have them fill it in. This allows you to collaboratively understand the experience from end to end very quickly. This visual aid guides the conversation and keeps participants engaged. To conclude, ask participants if you can contact them again with follow-up questions. This is usually not a problem with internal stakeholders.
Present a template to your interview partners and have them fill it in. This allows you to collaboratively understand the experience from end to end very quickly. This visual aid guides the conversation and keeps participants engaged. To conclude, ask participants if you can contact them again with follow-up questions. This is usually not a problem with internal stakeholders.

FIGURE 5-3. A simple mapping template can be used to gather existing knowledge about an experience.
Create a Draft Diagram
At this point you should be able to draft an initial diagram. This serves as a preliminary hypothesis of the experience. At a high level, consider some of the basics of creating a map discussed in Chapter 2: the point of view, scope, focus, and structure.
The draft diagram will guide future research. From it, you should be able to identify key research questions. At a minimum, a draft map will also help organize your thoughts.
Include others in the creation of a draft map. Assemble a small group of stakeholders to create a model of the experience together. The goal is not to analyze the experience and add data points. Instead, get agreement on the underlying model of the experience.
Use sticky notes to work out a preliminary structure of the diagram together. You should end up with something similar to the diagram shown in Figure 5-4. The aim is to think about how to tell the story of alignment and value creation for your situation. Some inference may be involved, and you may have to fill in gaps by making educated guesses at this point.

FIGURE 5-4. Create a simple, draft diagram in a team workshop.
There may be a tendency to come up with solutions in such an initial workshop. Let this happen, and be sure to capture those ideas. But don’t make the focus of the workshop brainstorming. Instead, concentrate on the diagram and generating questions for research.
![]() Note that, in startups and “lean” efforts, creating a draft map may be all you need to do. Remember: you’re looking for a common understanding within your organization of how you’ll create value for customers. If a small team is focused on how they will create user value, more formal activities may not be needed.
Note that, in startups and “lean” efforts, creating a draft map may be all you need to do. Remember: you’re looking for a common understanding within your organization of how you’ll create value for customers. If a small team is focused on how they will create user value, more formal activities may not be needed.
Touchpoint Inventory
After you have an initial framework for your diagram, take inventory of current touchpoints.
One way to do this is with a type of role playing or so-called “mystery shopping.” With this, you’ll step through a defined process or flow as an individual would experience it. Then record the artifacts and evidence they come in contact with, including:
- Physical evidence, such as regular mail sent home, or even packaging.
- Digital touchpoints, including everything from emails, to online marketing, to use of software.
- One-to-one contact, such as a phone call with a sales representative or chat with customer care.
Mystery shopping might not touch on edge-case and exception flows, however. Go back and find alternative touchpoints to complete your inventory. For instance, the emails that a solo trial customer gets might be different from those for a paid account with multiple users. Look at the broader picture so that the breadth of touchpoints is accounted for.
Figure 5-5 shows an example of a touchpoint inventory from Chris Risdon of Adaptive Path. This was created for the Rail Europe Experience Map shown in Chapter 1 (see Figure 1-5). It’s a simple table with a list of touchpoints per channel.

FIGURE 5-5. Take inventory of existing touchpoints.
In this example, each touchpoint is described with text. You may want to also include a screenshot or photo of the touchpoint for higher fidelity. If there are many images to capture, this can get unwieldy to manage in a single document: the images take up a lot of real estate and make the document unnavigable. In that case, you may just want to include a sample of images that represent key touchpoints to accompany the text descriptions.
Both the draft diagram and a touchpoint inventory will help you understand the domain within which you are working. This will guide future research. Keep in mind that mere inspection of existing touchpoints will not provide a complete picture of the customer experience. For that you need to do research with actual users.
Open questioning is a qualitative approach to interviewing that is well suited for creating alignment diagrams. With this, you’ll strive to hold in-depth conversations with participants on their terms. Don’t read directly from a questionnaire, but instead probe in a nondirected way on topics relevant to the effort.
The idea is to embrace the uniqueness of the participants and their particular situation. What makes them special? What concerns do they have in particular? How do they feel while experiencing your offering?
This type of interviewing is an art. The challenge is balancing between a nondirected conversation and getting feedback on the specific topics you need to learn about. It’s the interviewer’s job to drive the conversation, letting go of control at times, and jumping in and steering the session at others.
Use a discussion guide, such as the one shown in Figure 5-6. This is a one- or two-page document to refer to during the session, in this case for interviewing journalists. It’s a prompt for the interviewer, not a survey.

FIGURE 5-6. A sample discussion guide for a fictitious interview with journalists.
A discussion guide typically begins with a standard greeting to set expectations. The body of the discussion guide consists of questions to prompt a conversation about the topics relevant to the study. These prompts should address the questions, assumptions, and gaps in knowledge you have.
The discussion guide is more of a reminder of topics than a script to read from top to bottom. In fact, it’s rare you’ll cover the themes in the same order as in your guide. That’s OK. If a participant immediately starts talking about one of the topics further down on your list, go with the flow, and shift to that section of the guide.
- Create a rapport. Establish a bond with the participant and try to gain their trust and confidence.
Avoid yes-or-no questions. Strive to ask open-ended questions that keep the participant talking.
- Follow the conversation. Use eye contact and affirmative gestures, such as nodding and feedback, to show you’re actively listening. Agree with them, when appropriate (e.g., “Yes, I can see how that could be frustrating for you” or “Yes, that does sound like a lot of work for one person”).
- Listen. Let the participant do most of the speaking. Do not lead participants and put words in their mouth. Follow their line of thought and use their language.
- Dig deep. Try to understand participants’ underlying beliefs and values. They may not offer this information immediately. Dig further with simple phrases like: “Why do you think that is?” and “How do you feel about that?”
- Avoid generalizations. People often generalize when talking about their own behavior. To avoid generalizations, ask questions like: “How do you personally accomplish that task or feel when doing it?”
- Minimize distractions. People may get calls or be interrupted during the session. Try to restore focus on the interview as quickly as possible.
- Respect participants’ time. Be sure to start on time. If the interview starts running late, acknowledge that fact first and ask if it’s OK to continue.
- Go with the flow. The setting for the interview may not be what you expected and may not be the best condition for interviewing. Try to make the best of the interview nonetheless.
Conduct Research Externally
Research for alignment diagrams typically focuses on qualitative interviews and observations as a primary source of data. The draft diagram you co-created with the team helps identify your assumptions and open questions about the individual’s experience. Structure your research to fill in your gaps in knowledge.
Conducting interviews and observation on location is the gold standard for this type of research. This provides face-to-face interaction with participants and allows you to see their environment firsthand.
![]() In some cases, however, conducting remote interviews by phone or teleconferencing software is a viable option. (See the case study at the end of this chapter for an example.) Remote investigation speeds the process up and reduces the need to travel, but may miss some of the richness of data you can collect on location. Determine the level and type of research you need to understand the experience before you begin.
In some cases, however, conducting remote interviews by phone or teleconferencing software is a viable option. (See the case study at the end of this chapter for an example.) Remote investigation speeds the process up and reduces the need to travel, but may miss some of the richness of data you can collect on location. Determine the level and type of research you need to understand the experience before you begin.
The next section outlines a formal approach for field research, involving on-site interviews and observations. Remote interviews follow a similar pattern, but involve less direct observation.
Field Research
One of the best techniques for investigation is a qualitative method called contextual inquiry, pioneered by Hugh Beyer and Karen Holtzblatt in their book Contextual Design. This type of interviewing involves visiting participants on location, in the context of their experiences.
Formal contextual inquiry can be time consuming and expensive. Full-blown research of this sort is not required for mapping efforts. However, understanding the principles of contextual inquiry is valuable for the type of field research required in general.
Onsite interviews and observations typically last between one to two hours. Longer sessions are possible, but are typically not needed. Plan on conducting four to six interviews per segment are needed.
![]() To gather feedback more rapidly, try sending several teams into the field simultaneously to collect data. Then debrief together at the end of the day.
To gather feedback more rapidly, try sending several teams into the field simultaneously to collect data. Then debrief together at the end of the day.
Field research can be broken into four steps: preparing, conducting the interview, debriefing, and analyzing the data. Each is outlined below. Refer to the resources at the end of the chapter for more in-depth discussions on the technique.
Prepare
Interviewing participants on location adds complexity to the preparation. It’s not like conducting a survey or remote interview. You’ll want to pay particular attention to recruiting, incentives, scheduling, and equipment:
Recruiting
Be sure to brief the participants and set expectations. Remind them that you will be at their workplace or in their home during the interview and that you shouldn’t be interrupted. Also be sure that it’s OK to record audio of the session. Use a screener to make sure you recruit the appropriate participants and that they approve of the conditions.
Incentives
Going on location may require higher incentive than other research techniques, such as a survey. It’s not unusual to offer several hundred dollars. Generous incentives typically make recruiting easier, so it’s not advisable to save money here.
Scheduling
Since you’ll be going on-site, be sure to schedule interviews with enough time to travel between them. Finding multiple participants in a single location is ideal, but not always possible. Typically you’ll only be able to do two to three on-site interviews a day comfortably.
Equipment
Prepare thoroughly for each interview. Be sure to go out into the field with everything you’ll need:
- Discussion guide (see the sidebar, “A Brief Guide to Interviewing”)
- Notepad and pens to take notes
- Sheets of paper for the participant to draw on (optional)
- Digital voice recorder or audio recording app
- Camera (ask permission before taking any photos)
- Business cards
- Incentives
Parts of an interview
Since you’ll be on location for the interview, you don’t want to overwhelm the participant with interviewers and observers. Research in pairs—no more than two people at a time. More than two researchers can create an unnatural atmosphere, which in turn can affect participant behavior and the insights you get.
Determine clear roles for each researcher. One is the primary interviewer; the other acts as an observer. Maintain these roles. This allows the lead researcher to build a rapport with the participant and steer the conversation. The observer may ask questions at the end or when asked.
There are four parts to an interview.
1. Greet the participant
Greet the participant, explain who you are, and set the stage for the interview. Keep this brief. Confirm that it’s OK to record the session before starting the audio.
Begin by having the participants introduce themselves and describe their background as it relates to the study.
2. Conduct the interview
Use a discussion guide for open questioning. Have a naïve curiosity. The relationship you want to assume is one of master-apprentice: the interviewer is the apprentice, and the interviewee is the master. In other words, don’t instruct or correct them, even if the behaviors they describe seem inefficient. You want to learn what they actually do in the situation you’re investigating, not what the assumed “correct” way is. Make the interview about them and their experiences, not about you or your organization.
When asking broad, open questions, you may often get the response “it depends.” If that’s the case, try to qualify the question by asking about the most common situation or a typical situation.
One technique to keep the session moving is called the critical incident technique.
With this, there are three simple steps to follow.
- Recall a critical incident. Have the participant remember an event that happened in the past that went particularly badly.
- Describe the experience. Ask them to describe what happened, what went wrong, and why. Be sure to also ask how they felt at the time.
- Finally, ask what should have happened and what would have been ideal. This typically reveals their underlying needs and expectations of the experience.
The critical incident technique not only avoids generalizations but also gets deep insight into useruseremotions and philosophies people have about their experiences. In general, you want to bridge the gap between what people say or think they do and what they actually have done or would do.
3. Make observations
Take advantage of being on-site and make direct observations. Take note of the physical arrangement of the space participants are in, what artifacts are present, and how the participant interacts with them.
If appropriate, ask participants to show you how they might do a representative task. Keep in mind that some things may be confidential. Once they begin, simply observe with as little interjection as possible.
Take photographs. Make sure to ask permission first and avoid including confidential information or artifacts in the photo.
Video recording the session is also possible, but this is more involved. The angle of the camera, the sound quality, and lighting may distract you at the beginning of the interview. What’s more, analysis of full-length interviews can take a very long time. Don’t video the session if you don’t have the resources to review the recordings afterward. Instead of the entire session, try video-recording short testimonials or responses to a few predetermined questions.
4. Conclude
At the end of the session, summarize the main points to confirm your understanding. Keep this short. Ask any follow-up questions for clarification. Ask if participants have any final thoughts about anything that was discussed.
If you’re recording the session, keep the recording going during this part of the session. Often people interject important details they previously left out. Even while walking toward the door, you may hear a new insight you’ll want to record.
Make sure you give the participant his or her incentive. It may be uncomfortable for them to have to ask you directly. The incentive is your way of saying “thank you.” Be sincere and appreciative as you hand it to them.
Finally, ask if you can contact them later for follow-up questions or clarification.
Debrief
Schedule time to debrief immediately after each session or two. Review notes with your interview partner. Take the time to complete and complement each other’s understanding of what the participant said and did. You can start to pull out some main themes and highlights as well.
It also helps to make a brief description of the customer’s environment immediately after the interview. If you were interviewing someone at their workplace, for instance, sketch a map of their office. Include tools and artifacts around them, as well as interactions they had with others.
![]() Create an online space to capture thoughts, particularly if there are multiple researchers involved. An online collaboration board such as MURAL (Figure 5-7) provides an excellent format to accumulate findings quickly. Each interview can add photos and notes from the field. The intended structure of the diagram and elements it will include are already reflected.
Create an online space to capture thoughts, particularly if there are multiple researchers involved. An online collaboration board such as MURAL (Figure 5-7) provides an excellent format to accumulate findings quickly. Each interview can add photos and notes from the field. The intended structure of the diagram and elements it will include are already reflected.

FIGURE 5-7. MURAL (http://mur.al) is a good online tool to debrief after interviews.
Analyze the Data
Qualitative research uncovers tacit knowledge—a clear strength of the approach. However, the data you collect does not come organized. Instead, you’ll be left with a wealth of unstructured notes and recordings to plow through. Don’t be daunted. Let the overall story of interaction defined in the Initiation stage guide your analysis.
Diagrams of a current experience are aggregate pictures of the people and organizations you are investigating. When synthesizing the data you’ve gathered, seek out the common patterns. Create a single storyline for each target group.
From each interview, extract relevant findings. Group these by theme. Then align the conclusions into a flow or pattern of your diagram. Figure 5-8 shows the progress of moving from unstructured texts to common themes to sequences of experiences.

FIGURE 5-8. During analysis you’ll move from unstructured texts to clusters, and then to the flows that make up a diagram.
Informal analysis
![]() One informal way to analyze the data is to cluster sticky notes on a wall. Figure 5-9 shows the creation of a mental model diagram using sticky notes. This can be done alone, or collectively in a small group.
One informal way to analyze the data is to cluster sticky notes on a wall. Figure 5-9 shows the creation of a mental model diagram using sticky notes. This can be done alone, or collectively in a small group.
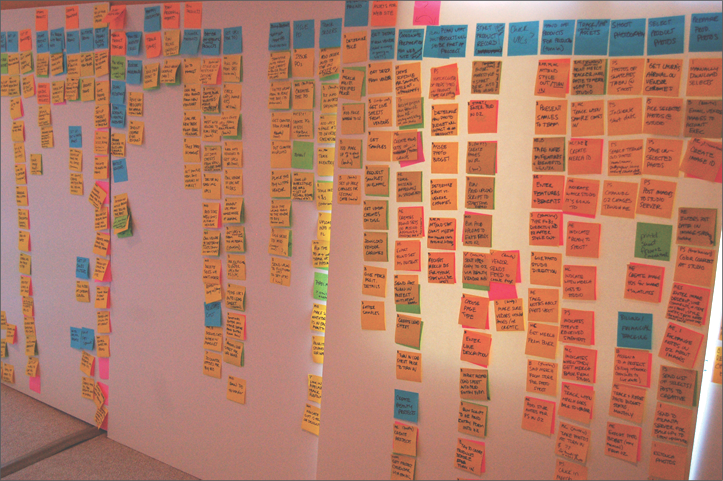
FIGURE 5-9. Informal analysis using sticky notes can be done on a large wall.
Alternatively, you may start analyzing data in a simple spreadsheet. Figure 5-10 shows a spreadsheet used to capture research findings. This is a modified version of a data collection sheet I used on a past project investigating a chronic illness. It allowed multiple people to contribute independently.

FIGURE 5-10. Use a simple spreadsheet for an informal analysis of your research.
Formal analysis
A more formal analysis requires full transcripts of the audio recordings for each interview. A 60-minute interview may yield 30 pages of transcribed text. Consider outsourcing this step, as transcription is a very time-consuming process.
Then, use a qualitative text analysis tool to comb through the transcribed texts—for instance, MaxQDA, shown in Figure 5-11. First, upload interview texts (upper left), create a list of themes to code passages (lower left), and apply the codes to the interview texts (center). Finally, view all coded passages across interviews for a given theme in one place (right).

Reading the coded passages for a particular theme then allows for grounded conclusions about the experience. Compare the themes to your open research questions and incorporate your findings into the draft map.
Quantitative Research
When you are creating an alignment diagram, a survey is the primary tool to get quantitative data. This will allow you to measure the same aspect across phases or touchpoints.
At a basic level, try to understand what types of experiences people are having. For instance, a question could list a series of touchpoints and require respondents to select the ones they encounter. This would allow you to indicate the percentage of people who encounter a given touchpoint.
Asking questions on a scale is more powerful. This allows you to indicate how much of an aspect people experience, including such things as:
- Frequency in which phases or steps are experienced
- Importance or criticality of a given touchpoint
- Satisfaction at each touchpoint or phase
When you create the survey, use a consistent scale throughout. If you ask participants to rank satisfaction on a scale of 1 to 5 for one question, don’t change to a different scale for the next.
Creating a bespoke survey is no easy task. Consider using a standardized survey instead. For instance, NPS (Net Promoter Score) is a popular measure for customer loyalty, introduced by Fred Reichheld in his book The Ultimate Question. Or, in software and web applications, there are surveys such as SUMI (Software Usability Measurement Index, http://sumi.ucc.ie) and SUS (System Usability Scale)* that have been around for decades. There are also newer measurements such as the UX Score, a proprietary measure created by market research giant GfK.†
Other sources of quantitative information include:
Usage metrics
Electronically enabled services—everything from online software to computer chips in cars—can capture actual usage data. Things like web analytics and software telemetrics allow for very detailed measurement of usage.
Call center reports
Most call centers record the volume of calls and general traffic patterns. There is often a quantitative classification of call types as well.
Social media monitoring
Quantitative measures of social media activity can be considered for a diagram. This may include such things as traffic for each social media platform or the volume of a hashtag use or mentions.
Industry benchmarks
Depending on the sector and industry you are working in, there may be benchmark data available. This will show how your current service compares to others in the same field.
As you collect data from these sources, think about how you might incorporate them into your diagram. There are many approaches that depend on the type of diagram you’re targeting, its structure, and its depth. Chapter 6 discusses some specific ways to represent quantitative information in an alignment diagram.
Summary
An experience is something that is constructed in the mind of the perceiver. It’s not something an organization owns. To map experiences, investigation into those experiences from the perspective of the individual is necessary.
Begin by assessing existing sources of information. This can include email feedback, phone calls, blog comments, social media activity, formal marketing studies, and industry reports. Extract relevant information that can inform the creation of a diagram. This information may be hidden or buried in existing sources.
Also create a touchpoint inventory of existing physical, digital, and person-to-person interactions. Note the channel and means of interaction as you complete the inventory, and collect images of each touchpoint.
Create a draft diagram together with the project team and stakeholders. This provides an initial picture of your current understanding of the individual’s experience. It also provides an overview of knowns and unknowns, which guides subsequent research. In some cases, this may be all that is needed for your team to get aligned.
Next, interview people internally within the organization. Get a mix of roles across functions and levels. Try to include frontline personnel in your initial interviews as well: service desk agents and call center workers, for instance, often have a clear perspective on a client’s experience because they are serving them.
Conduct field research to fill in gaps in knowledge and to deeply understand the individual’s experience. Go on location to the place where participants interact with the service in question. Engage them in interviews, but also observe their surroundings. Remote research using teleconferencing solutions speeds up the process, but loses the richness of face-to-face interaction.
Qualitative research can validate assumptions. Surveys and questionnaires work best here. The results of these methods can be included in an alignment diagram for greater impact.
All of this data needs to be analyzed and reduced to just the key points. Only then can you start drawing a map of the experience with confidence. The next chapter discusses how to take the findings from your research and illustrate a map.
Further Reading
Hugh Beyer and Karen Holtzblatt. Contextual Design (Morgan Kaufmann, 1997)
This is the original, landmark book that introduced a formal technique for contextual inquiry to the design community. This is a thorough, well-structured book with step-by-step guidance into their process. The first part discusses interview and inquiry techniques in detail. The latter parts of the book outline a method of translating findings into concrete designs. This is a highly recommended book everyone should have.
Karen Holtzblatt, Jessamyn Burns Wendell, and Shelley Wood. Rapid Contextual Design (Morgan Kaufmann, 2004)
This is a follow-up book to Contextual Design. It outlines ways to do contextual research quickly. There are many templates, tools, and examples that bring the subject to life. The level is not too advanced, and this is a great place for beginners to get started.
Mike Kuniavsky. Observing the User Experience (2nd ed., Morgan Kaufman, 2012)
Experience mapping requires some type of primary investigation. This is an excellent resource into the ins and outs of user research.
Steve Portigal. Interviewing Users (Rosefeld Media, 2013)
Steve Portigal is a recognized expert in user research. This book is a must-read for anyone engaging in contextual interviews or ethnographic research. There is a wealth of practical information and tips in this volume, with a wealth of examples.
Giff Constable. Talking to Humans, self-published (2014)
This thin volume of only 75 pages provides an excellent overview to getting in front of customers and talking to them. The approach the author takes is clearly within the Lean Startup movement, featuring discussions of assumption and hypothesis testing. There is a wealth of practical information for getting starting and conducting quick interviews.
* For a thorough description of SUS, see Jeff Sauro’s article: “Measuring Usability with the System Usability Scale (SUS),” Measuring U (Feb 2011).
† For more on the UX Score, see http://www.gfk.com/products-a-z/ux-score/.
Music Curation: User Research and Diagramming at Sonos
By Amber Brown
Sonos is a leading provider of wireless home audio products. From the customer’s point of view, the service is simple: you connect your speakers to your home WiFi and then play music through your phone, tablet, or computer.
The app for Sonos speakers enables control for multiple services, multiple rooms, and multiple people. While these components are important in making the service work, nothing really matters more to the users than playing music. The goal of this effort was to illustrate the complexity involved.
Before attempting to diagram how people curate music, Sonos had to first understand how and why people used the product. Our research consisted of a series of extensive interviews with ten Sonos households over the course of two weeks.
At first, we conducted interviews remotely. Using teleconferencing software and webcams we were able to get participants to demonstrate how they use the Sonos application on their phones. All sessions were recorded to show other stakeholders not present during the interviews.
After that, we asked participants to record interactions with the product in a daily dairy. The weekly check-ins with each household made for the most eye-opening insights. We found that when participants recounted stories they often revealed their deeper goals.
Next, we examined all of the data we collected to find common themes. Using sticky notes and a whiteboard, we arranged our findings into a model that served as the basis for a diagram.
Finally, we created a complete diagram reflecting the key insights from our research, shown in Figure 5-12. This simplifies the user’s experience by focusing on five key elements:
- User goals. We sought to uncover underlying motivations: what are customers trying to achieve when playing music? In each interview, we asked the customer why they did what they did.
- Supporting features. Recalling Indi Young’s process of creating mental model diagrams, we mapped features of our app to the goals. This helped stakeholders understand what features people used to get the job done. In our case, we found there was too much weight on the queue functions of the app, for instance.
- Benefits of features. The benefits of the features reveal the value of your current features. This also helps with stakeholder buy-in. Instead of focusing on only negative feedback, they also show what is working well.
- Obstructions of actions. The most important aspect of the diagram showed that the app didn’t support people’s goals. The obstructions got our stakeholders’ attention.
- Unused items. This section showed features that are not used when people are playing music. The list helped us decide what could be removed without having an impact on user goals.

FIGURE 5-12. A simplified curation model for Sonos.
Once the model was created, we found that it could be used in multiple ways to engage with the stakeholders.
- Show the diagram during meetings and workshops. The model is simple enough that others don’t get overwhelmed. I showed it in a paper form and in electronic form. This helped create a common understanding of user motivations.
- Print out the model for colleagues to use at their desk. Having the model distributed around the office and kept near colleagues’ desks help socialize the insight and keep the conversation going.
- Map new concepts to the model. Once stakeholders saw what the problems were, they came up with solutions. They saw how they could exchange the supporting features with the new concept’s supporting features.
- Use the new benefits to write user stories. New (or sometimes existing) benefits served as a basis for writing user stories for development teams.
- Creating simple models allows stakeholders to easily engage. It encourages people to use them as a reference and leverage them for various different activities to help improve the design.
We saw product managers, engineers, and designers use this diagram to help them understand what problems they were addressing and how they can solve them. Since the model was based on firsthand investigation, we also had confidence that our decisions were grounded in actual customer needs.
About the Contributor
Amber Brown is a UX researcher at Sonos. Her areas of specialty include contextual interviews, mental models, and workshop facilitation. Amber holds a degree in human-computer interaction from Iowa State University.
Diagram and Image Credits
Figure 5-2: Sketch by Jim Kalbach reflecting feedback from interview participants
Figure 5-3: Journey map template created by John Kembel at Designing CX (www.designingcx.com)
Figure 5-4: Photo of a simple diagram during a workshop by Jim Kalbach
Figure 5-5: Touchpoint inventory created by Chris Risdon, appearing in his article “The Anatomy of an Experience Map,” Adaptive Path Blog (Nov 2001)
Figure 5-9: Image from Mental Models (Rosenfeld Media, 2007) by Indi Young, retrieved from flickr: https://www.flickr.com/photos/rosenfeldmedia/sets/72157603511616271/
Figure 5-10: Example of an online spreadsheet for data collection in Google Sheets, modified from the original version
Figure 5-11: Image of MaxQDA, by Jim Kalbach
Figure 5-12: Model for curating music with Sonos, created by Amber Brown