
IN THIS CHAPTER
- Background and history of visualizing services
- Lean techniques and diagrams
- Extending service blueprinting
- Elements of a service blueprint
- Case study: Expressive Service Blueprint
We live in a service-based economy, yet most organizations fail to provide good services. For all of the money invested in technical R&D, organizations tend to overlook development of their service experience. This is changing. More and more, organizations realize that customer experience is a source of growth and competitive advantage.
But good service design remains elusive. Part of the challenge is that, unlike physical goods, the transitions between touchpoints in a service are intangible. They unfold in real time, and then those moments are gone.
Service design is a growing field that seeks to prevent unintentional service experiences. The objective of service design is to take deliberate actions that create, deliver, and sustain positive service experiences over time, consistently and repeatedly.
A focus of service has historically been face-to-face interactions. But as the digital and the physical worlds of service blend more and more, service design extends into the design of digital services as well. As a result, service design is interdisciplinary, drawing attention from people in sales, marketing, product management, product design, interaction design, and user experience.
This chapter provides an overview and historical background to service blueprints. It also touches on related and extended techniques, such as lean consumption and expressive service blueprinting.
Visualizing Services
Service design is not new. It can be traced back to the writings of G. Lynn Shostack in the early 80s. A cornerstone of service design is a map of the service process. Shostack refers to these as service blueprints in her original articles. Figure 9-1 shows an early example from Shostack’s 1984 article “Designing Services That Deliver.”
This blueprint is rather plain and resembles a flow diagram. Yet it yields valuable insight about the experience of dealing with a discount broker. For instance, there are about a dozen steps that are required to “prepare and mail statements.”

Shostack also includes an indication of potential fail points (noted with an “F” in a black circle). These are critical points where the service may show issues of inconsistency or break down completely.
Shostack stresses the overall importance of mapping activities in service design. She writes:
The root of most service problems is, in fact, lack of systematic design and control. The use of a blueprint can help a service developer not only to identify problems ahead of time but also to see the potential for new market opportunities.
…
A blueprint encourages creativity, preemptive problem solving, and controlled implementation. It can reduce the potential for failure and enhance management’s ability to think effectively about new services. The blueprint principle helps cut down the time and inefficiency of random service development and gives a higher level view of service management prerogatives.
Since then, service blueprints have become widely used. For instance, the British Standard Institution provides general guidelines for service design in BS 7000-3: 1994. This gives direction on the management of the design of service across industries from the customers’ perspective. The intent of blueprinting is to isolate fail points—steps where the service may go awry—and address these accordingly.
Mary Jo Bitner and colleagues developed a more structured and normalized approach to service blueprinting. Figure 9-2 shows an example of a blueprint for a hotel, created by Bitner and her team.
More and more, organizations realize that customer experience is a source of growth and competitive advantage.
The separate rows of information and color coding make this map easier to read than Shostack’s example. It borrows from swim lane diagrams found in business process modeling. In doing so, this arrangement also makes both the service experience and the service provision more comprehensible. It better reveals the opportunities for improvement and growth.
Specifically, this arrangement highlights the separation of frontstage interactions, which are what the individual experiences, and backstage interactions, the processes necessary to provide a service. The notion of frontstage and backstage is found throughout service design literature, and it reflects the basic principles of value alignment presented in this book. The metaphor recalls a theater, where the audience sees only what’s on the stage. Everything backstage is invisible to them and goes into supporting the frontstage experience.

Staying Lean
“Lean” is a broad topic that gets used in a variety of ways. All uses of the term, however, have one thing in common: the notion of reducing waste. James Womack and Daniel Jones, pioneers in the lean movement, outline fundamental principles in their landmark book Lean Thinking. The steps they recommend taking are:
- Specify the value. State what value you are creating from the customer’s perspective. Define this in terms of the whole experience, not just individual interactions.
- Identify the value chain. The value chain is all of the actions and processes needed for an organization to deliver that value. In lean, the goal is to eliminate steps that do not add value.
- Optimize flow. Lean is about increasing the efficiency of production. This means optimizing the backstage service processes.
- Create customer pull. After flow is established, let the customer pull value upstream. Start with the customer demand or need, and align your offering to that.
Diagrams are an inherent part of lean practices. Value stream mapping is a specific technique for illustrating the value chain—see point #2. These graphs focus solely on the backstage processes needed to deliver value to the customer, as seen in Figure 9-3.
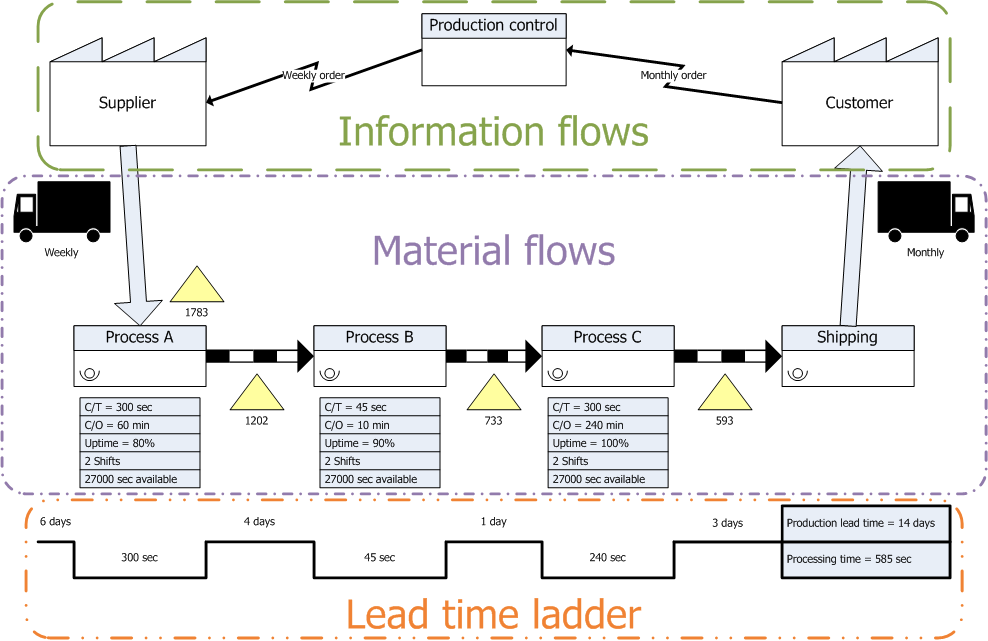
This diagram resembles the bottom half of a typical service blueprint, for instance. And while it doesn’t appear particularly customer-centric in nature, the intent of a value stream map is about delivering value. Authors Karen Martin and Mike Osterling explain its benefit in their book Value Stream Mapping:
In most organizations, no one person can describe the complete series of events required to transform a customer request into a good or service…This gap in understanding is the kind of problem that leads to making improvements in one functional area only to create new problems in another area…It’s the kind of problem that propels well-meaning companies to implement experience technology “solutions” that do little to address the true problem or improve the customer experience.
Being lean is being aligned. Alignment diagrams, then, not only fit into the lean canon, but they potentially extend it by including a rich description of customer experience.
Lean Consumption
One goal of value-centered design is reducing complexity on behalf of the customer. To illustrate this, Shostack examined the specific timings of each interaction in her original mapping studies in the 1980s.
Figure 9-4 shows precise timings for a service encounter Shostack offers as an example—in this case, getting a corner shoeshine. Since service encounters happen in real time, service designers should establish a standard and acceptable timeline, indicated directly on the blueprint.

James Womack and Daniel Jones coin the term “lean consumption” in their 2005 article of the same name. They describe the positive business returns and increased value creation for both sides of the equation. The authors write:
Companies may think that they save time and money by off-loading work to customers, making it the customer’s problem to get the computer up and running, and wasting the customer’s time. In fact, however, the opposite is true. By streamlining the systems for providing goods and services, and making it easier for customers to buy and use them, a growing number of companies are actually lowering costs while saving everyone’s time. In the process, these businesses are learning more about their customers, strengthening consumer loyalty, and attracting new customers who defect from less user-friendly competitors.
To visualize lean consumption, the authors recommend creating a map of the steps customers go through to consume products and services. They call these diagrams lean consumption maps.
Figures 9-5 and 9-6 show lean consumption maps created by Pete Abilla, a leading service designer expert. Compare the before (Figure 9-5) and after (Figure 9-6) states of a service encounter for a yearly car inspection and registration in the US.
The bar chart shows that the process takes the customer a total of 210 minutes, with touchpoints across two providers: the auto mechanic and the division of motor vehicles. After combining inspection and registration at Jiffy Lube, a national chain of service stations in the US, the process is reduced to just 65 minutes.


FIGURE 9-6. AFTER—a redesign of the service reduces the time investment for the customer to just 65 minutes.
From the lean consumption perspective, the imperative for service providers is clear: don’t waste the customer’s time. Making their experience as lean as possible improves satisfaction and loyalty. This ultimately gets reflected on the bottom line of the business.
Extending Service Blueprinting
Service blueprinting techniques continue to be extended. For instance, Wreiner and colleagues added multiple providers, as outlined in their 2009 article “Exploring Service Blueprints for Multiple Actors.” Figure 9-7 shows interactions between three actors in a public parking lot: the motorist, the operator, and the owner of the lot.

FIGURE 9-7. Wreiner and colleagues blueprinted three actors in a single map.
A common criticism of service blueprints is that they don’t explicitly include information about the individual’s emotional state. To address this gap, Susan Spraragen and Carrie Chan added the dimension of feelings to service blueprints. “Expressive Service Blueprinting” looks at how the client’s emotive state may vary during the service encounter. See the case study at the end of this chapter on “Expressive Service Blueprinting” for more details.
Andy Polaine, a leading service design expert, has also expanded on service blueprints by adding details about the emotional context. Inspired by Spraragen, he includes emotional information into his diagrams, reflected in Figure 9-8. Notice that Polaine maps multiple actors simultaneously as well. This adds a level of detail that makes the diagram more complex and may not be useful in all situations.

Elements of a Service Blueprint
Service blueprints consist of several layers of information. It’s the interaction between these layers that provides a systems view of the service experience, as seen in Figure 9-9. Table 9-1 summarizes the main aspects that define service blueprints using the framework outlined in Chapter 2.
|
Point of view |
Individual as the recipient of a service. Typically centered on a single actor, but may also include multiple actors when examining an entire service ecology. |
|
Structure |
Chronological. |
|
Scope |
Examples typically illustrate a discrete service encounter, but also include overviews of a whole service ecosystem. |
|
Focus |
Focus on service provision processes in a service encounter with emphasis on backstage action and touchpoints. Extensions of service blueprinting add emotive information. |
|
Uses |
Diagnosis, improvement, and management of existing service systems. Good for analyzing specific timings of service interactions, down to the minute in some cases. |
|
Strengths |
Simple, predefined structure with a clear focus of attention. Relatively light research and investigation needed. Suitable for co-creation with teams and stakeholders. Easy for others to understand from a single page. |
|
Weaknesses |
Lack many of the contextual, environmental cues of an experience (e.g., “noisy setting” or “great-tasting food”). Metaphor of a blueprint is a misnomer: they are more like flow diagrams than an architectural blueprint. |
TABLE 9-1. Defining aspects of service blueprints
There are five key components of a service blueprint. The basic arrangement of these elements is illustrated in Figure 9-9.
- Physical evidence. The manifestation of the touchpoints that customers interact with are physical evidence. This can include physical devices, electronic software, and face-to-face interactions.
- Customer actions. These are the main steps a customer takes to interact with an organization’s service.
- Onstage touchpoints. These are the actions of the provider that are visible to the customer. The line of visibility separates onstage touchpoints with backstage actions.
- Backstage actions. These are the internal service provision mechanisms of the organization that are not visible to the customer, but that directly impact the customer experience.
- Support processes. These are internal processes that indirectly impact the customer experience. Support processes can include interactions between the organization and partners or third-party suppliers.

Further Reading
Mary Jo Bitner, Amy L. Ostrom, and Felicia N. Morgan. “Service Blueprinting: A Practical Technique for Service Innovation,” Working Paper, Center for Leadership Services, Arizona State University (2007)
This is an academic article that has a wealth of practical information, including detailed instructions on creating a service blueprint. There are also numerous case studies in its use. This provides an excellent overview of service blueprinting in general.
Andy Polaine, Lavrans Løvlie, and Ben Reason. Service Design (Rosenfeld Media, 2013)
This is one of the best resources available for a complete understanding of service design in general. The book is thorough and presents a cohesive argument for the growing field. Chapter 5 focuses specifically on diagrams as a part of the service design discipline.
G. Lynn Shostack. “How to Design a Service,” European Journal of Marketing 16/1 (1982) and G. Lynn Shostak. “Designing Services That Deliver,” Harvard Business Review (1984)
These two articles are frequently pointed out as the impetus for the service design movement. The latter of the two is available online from the Harvard Business Review and is recommended reading. Although decades old, Shostak’s observations and advice are wholly relevant today.
James Womack and Daniel Jones. “Lean Consumption,”
Harvard Business Review (March 2005)
Womack is an early pioneer in the lean movement. In this landmark article, he shifts attention from lean processes within an organization to the customer experience. He and Jones make a compelling case and present evidence for following the path of lean consumption.
Thomas Wreiner, Ingrid Mårtensson, Olof Arnell, Natalia Gonzalez, Stefan Holmlid, and Fabian Segelström. “Exploring Service Blueprints for Multiple Actors” (First Nordic Conference on Service Design and Service Innovation, 2009)
This is a short case study of a project that resulted in a blueprint with several actors. Even with a simple example of a parking lot, the three-way relationship between actors reveals complexity in service provisions. The authors offer alternative ways to examine the service encounter.
Valarie Zeithaml, Mary Jo Bitner, and Dwayne Gremler. Services Marketing-Integrating Customer Focus Across the Firm, 6th ed. (McGraw-Hill, 2012)
This is a main, early text in the service design literature. Though dry and academic at times, it provides a wealth of detail on service design. There is considerable attention to service blueprinting throughout the book, with an entire chapter on the subject.
By Susan Spraragen, with Carrie Chan
Evaluating and investigating service systems, consumer experiences, and service delivery outcomes is an ongoing task for service providers. Providers who view the service from the consumer’s perspective may reveal opportunities for refining their offerings so they are differentiating and effective, and enable stronger customer relationships.
As I researched a human-centered approach to examining and illustrating a service system, I wondered what form or model would best represent and communicate this perspective. Business process modeling notations, data flow diagrams, and operational charts seem to put the consumer in a marginal role rather than an explicit one. They do not lend themselves to discussions about the human motivations, interactions, and emotive responses that all occur during a service encounter.
I then came across the work of Lynn Shostack and Mary Jo Bitner and saw how they employ a service blueprint, which is purposely drawn from the consumer’s perspective. But these visualizations looked rather swim-lane-like in their format.
By expanding on their work and adding a dramatic shift in style, I hoped the service blueprint would enunciate with fervor: “Hey! There are humans in this picture—see how they respond and interact with your service!”
Most fortunately, I had an enlightening opportunity to work with Carrie Chan, a service designer who flourished with my challenge to: Create a service blueprint with limited use of boxes and arrows. Create something that won’t be brushed aside as yet another swim-lane or data flow diagram. I want to explicitly show the human emotions of a service encounter! Together, we created a more organic look for describing a service episode—one that gave a personal voice to the service consumer and service provider.
Our approach uses graphic symbols, images, or plot lines to visualize the ebb and flow of the consumer’s emotive response as they personally interact with the service provider. From our early designs, I coined the term expressive service blueprinting. The key components of an expressive service blueprint, which are distinct from a traditional service blueprint, are as follows:
- Emotive responses. Consumer emotions are clearly stated and graphically shown either through icons, photographs, graphs, or other elements. We chose elements that we can modulate in intensity, either through color or positioning, so that we can emulate the variability of a consumer’s emotion during the service encounter. We embed those elements within the onstage journey area of the blueprint. In addition, we add the consumer’s thoughts as they perform their service actions.
- Layout. More space is allocated to the onstage customer journey than the backstage area, as this stage of the blueprinting and design process emphasizes the consumer perspective. Moments of direct interaction with the provider are represented with vertical arrows indicating one-way or bidirectional conversations.
- Provider identity. The roles of the service participants are stated in terms of their function relative to the service domain. So rather than using generic terms like provider and consumer, we like to use terms that will resonate with actual team members in the provider organization.
Figure 9-10 shows an expressive service blueprint of a patient visit to an ophthalmologist. This is based upon interviews and observations with an ophthalmic technician who encounters a myriad of patients daily. A fundamental challenge illustrated here is one of prescription compliance.
In our example, the patient is left confused about their prescription and concerned about the cost of the medicine. The expressive blueprint illustrates the source of the confusion by tracking two emotive states: distraction and anxiety.
We delineate the fluctuation of these two emotions with graph-like elements embedded in the patient’s onstage journey. For marking their distraction level we chose a line graph. The patient icon appears on the line at key moments of the service encounter.
When the patients are taking their eye exam and meeting with the ophthalmologist, they are not as distracted as they are during the key moment of information exchange about how to follow the prescribed regimen. The high level of distraction at this moment is further exacerbated by their growing level of anxiety about adding more medicine to their daily routine. The patient’s varying anxiety levels are depicted with a wave form.
This expressive blueprint invites the viewer to determine when or how the prescription information might be more effectively administered, as the emotional state of the patient is clearly impacting the outcome of their visit.
This blueprint also suggests the complex backstage activities of the ophthalmologist. While the patient happens to be in the office, the doctor addresses a number of issues, only one of them concerning the care of this particular patient.
Expressive service blueprinting is a part of a larger effort for designing and prototyping services. It is a messy process that is best constructed collaboratively with key service providers and consumers. When building blueprints that explicitly note the consumer’s varying emotive states, we add a unique descriptive layer to the investigation about the service encounter. This approach may give rise to truly understanding why and how service gaps emerge.

FIGURE 9-10. This example of an expressive service blueprint depicts an encounter with an ophthalmologist.
Further Reading
Susan Spraragen and Carrie Chan. “Service Blueprinting: When Customer Satisfaction Numbers Are Not Enough.” (International DMI Education Conference, 2008).
Susan Spraragen. “Enabling Excellence in Service with Expressive Service Blueprinting,” Case Study 9 in Design for Services by Anna Meroni and Daniela Sangiorgi (Gower, 2011).
About the Contributors
Susan Spraragen is a service design researcher, educator, and faculty member at Parsons School of Design Strategies. Susan lives in New York, where she enjoys hiking and taking photos along the Hudson River. She can be reached via LinkedIn at https://www.linkedin.com/in/slspraragen.
Carrie Chan is currently Strategy Director at Nurun San Francisco, where she works at the intersection of customer research, business, design, and technology to develop strategies for digital products and services across a variety of industries. She spends her free time on the opposite side of technology: dreaming of future travels, paper crafting, playing in a piano duo, and perfecting her marinara sauce recipe. She can be reached via LinkedIn at linkedin.com/in/thinkcarrie.
Diagram and Image Credits
Figure 9-1: Service blueprint by G. Lynn Shostack from her article “Designing Services That Deliver,” Harvard Business Review (1984)
Figure 9-2: Service blueprint from Mary Jo Bitner, Amy L. Ostrom, and Felicia N. Morgan. “Service Blueprinting: A Practical Technique for Service Innovation,” Working Paper, Center for Leadership Services, Arizona State University (2007)
Figure 9-3: Value stream map from Wikipedia, uploaded by Daniel Penfield, CC BY-SA 3.0
Figure 9-4: Blueprint for a corner shoeshine by G. Lynn Shostack from her article “Designing Services That Deliver,” Harvard Business Review (1984)
Figures 9-5 and 9-6: Diagrams taken from a blogpost by Pete Abilla: “Lean Service: Customer Value and Don’t Waste the Customer’s Time” (Schmula.com, 2010), used with permission
Figure 9-7: Service blueprint from Thomas Wreiner, Ingrid Mårtensson, Olof Arnell, Natalia Gonzalez, Stefan Holmlid, and Fabian Segelström. “Exploring Service Blueprints for Multiple Actors” (First Nordic Conference on Service Design and Service Innovation, 2009)
Figure 9-8: Diagram taken from Andy Polaine. “Blueprint+: Developing a Tool for Service Design” (Service Design Network Conference, 2009), used with permission
Figure 9-10: Expressive service blueprint created by Susan Spraragen and Carrie Chan, used with permission
Part 3, bottom-left diagram: Customer journey map created by Adam Richardson, originally appearing in Adam Richardson. “Using Customer Journey Maps to Improve Customer Experience,” Harvard Business Blog (Nov 2010)