
IN THIS CHAPTER
- Background and overview of mental models
- Rapid mental model diagrams
- Deriving structure
- Elements of Mental Model Diagrams
- Case study: Forward-Thinking Insurance Company
The term mental model has its roots in psychology. It refers to someone’s thought process about how the world works—their frame of reality.
Mental models allow us to predict how things work. They are cognitive constructs built on beliefs, assumptions, and past experiences. But a person’s mental model is a perception of a how a system functions, not necessarily how it actually may work.
For instance, say you come into your house on a cold day. To get warmed up quickly, you turn the thermostat way up. Your assumption is that the higher thermostat setting, the more heat will come out.
But a thermostat does not work like a faucet valve. It’s more like a switch: the heat goes on or off depending on set temperature (see Figure 12-1). In this scenario, you’d have a wrong mental model of how the system actually works. The room won’t get warmer faster. Instead, the heater will simply stay on longer to reach a higher temperature.

FIGURE 12-1. Thermostats are more like switches, not faucets.
The lesson for providers of products or services is profound: your understanding of the systems you create differs from the user’s understanding. You have far more knowledge about how the system actually works than others do.
The difference in mental models is a key point Don Norman makes in his landmark book The Design of Everyday Things (1988). Figure 12-2 shows his now-iconic graphic of three different models at play: the model the designer has of the system, the actual system model, and the mental model the user has of the system.
The goal of design is to understand the mental model of the people you are designing for. To do this, you need a feedback loop, indicated by the two arrows on the right side of Figure 12-2. It requires the ability to put your own perspective to the side and to view the system as a user might. In a word, designing requires empathy.

FIGURE 12-2. Don Norman’s well-known diagram illustrates that the designer’s model is not the same as user’s mental model.
The diagrams explored in this book help you understand the feedback loop between the user and the system. But there is something broader. The mental model the user has of the system is framed by that system. If you explore the mental model of a person, rather than a user, who is trying to achieve a purpose, then you can break out of the system frame. You can discover aspects of how a person thinks that have nothing to do with the system, but everything to do with how that person accomplishes their intent.
Mapping is a key way to understand mental models and make them visible to your organization. In practice, mapping experiences is effectively mapping someone’s mental model. The approach discussed in this chapter focuses on a specific technique developed by Indi Young simply called mental models diagrams.
Mental Model Diagrams
In 2008 Indi Young published a formal method for visualizing mental models in her book of the same title. Figure 12-3 shows an early example of a mental model used in the book. This instance examines “movie going.”
Mental model diagrams are typically very long documents and can extend 10–15 feet across a wall when printed. The diagram in Figure 12-3 has been broken into two parts to fit on the page.

The top half of the diagram describes the mental model patterns across a set of people. There are three basic levels of information in this portion of the diagram (Figure 12-4):
Boxes
These are the basic building blocks, shown as small squares. The boxes contain a person’s thoughts, reactions, and guiding principles. (Originally, Young refers to these as “tasks” but has since moved away from that language to avoid confusion with physical actions only.)
Towers
Boxes form groups based on affinity, called towers. These are the areas with colored backgrounds on a diagram.
Mental spaces
Towers, in turn, form affinity clusters called mental spaces. The mental spaces are labeled above towers, between the dark vertical lines.
A dark line in the center separates the mental model from “support”—all of the products and services that address the thought process within a tower. From this arrangement, we see the basic principles of alignment at work.
Overall, this approach of describing mental models focuses on people, not tools. For instance, instead of writing “Filter image colors in Photoshop,” focus on the root task and record “Alter image colors” or perhaps, “Improve image color.”
The diagrams also don’t reflect personal preference or opinion. Instead, strive to focus on what goes through a person’s mind—their internal voice—and capture that in the diagram.
As a result, of all the diagrams covered in this book, the top half of mental model diagrams are the most person-focused in nature. This provides an advantage in flexibility: they can be applied to any domain or situation. Mental model diagrams also enjoy longevity: once completed, a mental model will change only slowly, often remaining relevant for years.
However, mental model diagrams may also overwhelm others with detail. I have seen business leaders ask for a simpler model. But that detail is also a strength for those looking to deeply understand people’s state of mind.

FIGURE 12-4. The three basic elements in a mental model diagram are boxes, towers, and mental spaces.
Combing the Transcripts
The process for creating mental model diagrams is similar to the steps outlined in Chapters 4–7 of this book. One main difference is the normalization of research findings into standard format. This normalization makes the process of finding affinities between items much easier.
You begin analysis by combing interview transcripts for relevant information. The time spent combing gives the research a much stronger understanding of what each participant meant as they repeat and re-explain their thinking to others. This process stands at the heart of the mental model technique. Every element on the diagram follows a similar format:
- Start with a verb, to focus on the thinking, rather than the goal.
- Use the first person to put the researcher in the participant’s shoes.
- Add one idea per box, for simplicity and clarity.
Each element comes from the thinking you hear from participants. If you record the listening session and get a transcript, you can draw each element from the transcript as a quote. To make it easier to find affinities between the elements, write a summary of each quote using this form:
[I (optional)] [verb] [noun] [qualifiers]
This strict uniformity allows for the arrangement of elements hierarchically: boxes are grouped into towers, towers are grouped into mental spaces. The process begins with distilling elements from the transcripts. The aim is to get the essence of people’s mental models into the prescribed format.
Formatting tasks takes practice. It’s not merely a process of copying phrases from the raw texts gathered during research. To illustrate, Table 12-1 shows some hypothetical quotes about drinking coffee. On the right are example summaries in the prescribed format you might derive from this data.
|
DIRECT QUOTE FROM RESEARCH |
SUMMARIES |
|
“When I get up, my body is just saying ‘get some coffee!’ It’s like I can’t function without it. So the first thing I do pretty much every morning is make coffee—it’s almost automatic. I think I can almost do that in my sleep. I’ll then enjoy a cup with breakfast or while reading the newspaper.” |
Feel nonfunctional until I get coffee |
|
Feel compelled to make coffee in the morning |
|
|
Enjoy a cup of coffee in the morning |
|
|
“My wife and I both really like drinking coffee in the morning. It’s a good way to wake up—it gets you going. Actually, I don’t quite feel right until I’ve had my first cup.” |
Enjoy a cup of coffee in the morning |
|
Crave coffee in the morning |
|
|
Feel not-quite-right until after my first cup of coffee |
TABLE 12-1. Example of summaries (right) in a normalized format derived from raw research texts (left).
Rapid Mental Model Method
![]() Creating a mental model diagram can take a lot of effort. Formal projects with 20–30 participants take weeks or months to complete. It’s a valuable upfront investment, but some organizations don’t want to take the time.
Creating a mental model diagram can take a lot of effort. Formal projects with 20–30 participants take weeks or months to complete. It’s a valuable upfront investment, but some organizations don’t want to take the time.
After Mental Models was published, Young developed a method for creating diagrams quickly—within days. She describes this approach in a post entitled “Lightning Quick Method.” It centers on a single workshop with stakeholders.
Here is a summary of Young’s rapid approach to gathering data and finding affinities:
1. Solicit stories in advance
Collect short stories about a particular topic from your target audience a week in advance. This can be done through email, short listening sessions, as well as via social media and other online sources. The stories are accounts of how people reason their way toward a purpose captured on 1-2 pages. If you need to, rewrite these stories using the first person so all of the texts have a similar perspective.
2. Comb and summarize
Read through the stories aloud in the workshop. With either large sticky notes or in a shared document, different team members record summaries as you read. Within a few hours, you should be able to produce 100 discrete summaries.
3. Group by patterns
Once the summaries begin to accumulate, start grouping them by the intent of the storywriter. Many of these first groups will change as you add summaries. As you get further, you can begin to organize the towers into mental spaces. You should be able to create a provisional structure within an afternoon.
4. Brainstorm
Use the remainder of the workshop to brainstorm solutions. Where are the gaps between how people are reasoning and how your organization supports that reasoning? What opportunities do you see?
The rapid method is ideal for teams that need to act on results quickly. The result is a first-generation diagram that reflects what you have collected at this point. It may need further validation. But since people’s stories are collected up front, this diagram is nonetheless grounded in reality.
From Construct to Structure
The hierarchical nature of mental model diagrams makes them particularly relevant for the practice of information architecture. The process can be described as grounded: a bottom-up approach starting with summaries of how people describe their reasoning, reactions, and guiding principles as they accomplish a purpose larger than your offering. Then, it’s a matter of successively grouping information into higher-level categories (Figure 12-5).

FIGURE 12-5. Deriving structure from mental model diagrams is a bottom-up process grounded in a real-world insights.
The result is a categorization that matches the actual mental model of the people you serve and reflects vocabulary that people have used in interviews. App and web designers, for example, can then use this scheme as the basis for navigation. This greatly improves usability of the navigation and ensures its longevity as well.
Young describes the process of deriving structure and mapping it to navigation in detail. Figure 12-6 is an example of the process outlined in her book. It shows how mental spaces can be grouped into categories that then serve as the main navigation for a website.

Related Approaches
The origins of investigation into mental models goes back to the work of Kenneth Craik in his 1943 book The Nature of Explanation. He offers a concise, simple-to-understand definition of mental models:
The mind constructs small-scale models of reality to anticipate events, to reason, and to underlie explanation.
Later, Philip Johnson-Laird did some of the most significant research on the subject, resulting in a full-length book entitled Mental Models (1983). Early attempts at representing mental models visually reflect a hierarchical arrangement of information.
For instance, Johnson-Laird’s approach looked at how a meaningful story builds up across events and episodes. His was grounded in textual analysis, which he then visualized (Figure 12-7).

Broadly speaking, this represents the technique of laddering: showing layers of causality from granular evidence to high-level conclusions. Mental model diagrams are also based on a type of laddering.
Consider the laddering in the goals-means framework, shown in Figure 12-8. This shows a hierarchy of goals and means for pregnancy, created by designer Beth Kyle. At the top is primary goal of having a healthy child and mother. The means of achieving that are listed on the next level. The process iterates until specific solutions and features are determined at the lowest level.

In another example, Figure 12-9 shows the new business activities of an architectural firm. This is a diagram I created on a previous project, modified to conceal both the firm and my client.

Because new business activities can happen in any order, using a hierarchical representation made sense in this case. It allowed me to show relationships between actions without putting them on a timeline. Through laddering, higher-level goals and needs can then be identified.
Elements of Mental Model Diagrams
Of the types presented in Part 3 of this book, mental model diagrams represent an archetype for hierarchical illustrations. Indi Young’s seminal book, Mental Models, provides a step-by-step guide to creating these diagrams, as well as ways to use them in practice.
Broadly speaking, mental model diagrams reflect the concept of laddering—a grounded, bottom-up approach to creating models of human experiences based on observations.
Table 12-2 summarizes the main aspects that define mental model diagrams using the framework outlined in Chapter 2.
Further Reading
Thomas Reynolds and Jonathan Gutman. “Laddering theory, Method, Analysis, and Interpretation,” Journal of Advertising Research (1988)
This is an older article from two of the primary originators of the laddering approach, based on Gutman’s means-end approach outlined a few years earlier. This is a detailed description of the technique with many examples. In general, laddering grounds conclusions you make in evidence.
Indi Young. Mental Models (Rosenfeld Media, 2008)
Indi pioneered a specific technique for illustrating mental models in the early 2000s. This is a meticulously detailed book with step-by-step instructions. This book is essential for anyone interested in completing a mental model diagramming project.
Indi Young. “Try the ‘Lightning Quick’ Mental Model Method,” Indi Young blog (March 2010)
In this blog post, Young describes a modified process to creating and using mental model diagrams that can be done in a matter of days. It offers a quick alternative to the full-blown method outlined in her book.
A Forward-Thinking Insurance Company: Mental Model
By Indi Young
This particular case study represents a common scenario where a product or service already exists, and the organization is seeking a way to make incremental improvements.
The example organization is an insurance company.* The company offers auto insurance and home insurance. There is a group within the company, separate from any of these businesses, tasked with strategic direction and new products. The group has existed for two years, created by a few of the executives in response to discussions in the boardroom about competition and innovation. The executives wanted to experiment with something beyond traditional industrial methods. Recently, this group has conducted a few person-focused studies, one of which was about what goes through people’s minds during and immediately after an auto accident. Because of what they discovered, the group suspects there might be something related to learn from thinking patterns during near-misses.
They want to conduct another study as a twin to the accident study, so they have a stronger foundation from which to create their potential ideas for new directions. The group hopes to use the discoveries to guide the way they provide services to the individuals they insure.
The scope of their subsequent study is: “What was on your mind during and after a memorable near-miss accident?” This scope is not restricted by type or location of the incident. The team will hear stories from people who have nearly had accidents in the kitchen or on the road, by themselves or in a crowd, where someone is at fault or no one is at fault. Because this is person-focused research, the accident does not have to relate to the product—auto insurance—that the company provides. The team is after the styles of thinking and manners of decision making during a near-miss, whether or not it has to do with autos. The patterns of thinking can then be used as a framework for new ideas about auto insurance.
The team began by conducting listening sessions with 24 people. They began each session with the question, “What was on your mind during and after a memorable near-miss accident?” Then they let the participant take the conversation wherever, within that scope.
Here is the first part of one of the stories. The Listener digs into various things that were mentioned so that she can better understand the reasoning and reactions that went through the participant’s mind at the time.
Listener: I’m looking for stories that will help me understand what goes through people’s minds in near-accidents or injuries. Do you have any near-accidents or near-injuries that you remember?
Speaker: I guess this counts as a near-accident, because it was an actual accident, but it could have been much worse. So I think it counts as both. It wasn’t recent—it must have been when my daughter was 4 or 5. These don’t have to be car things, right?
Listener: Right.
Speaker: This is one of those things when you’re driving on the freeway, and you’re going 65 miles per hour. I was right behind a fencing company truck. An aluminum bracket tumbled off the little storage cabinet above the truck. I wasn’t even that close behind it—just a normal distance. I was driving my Honda Odyssey, and the bracket struck the windshield right in front of my face. Instant spider web! It was one of those things that happens in a flash. I had all this adrenaline. So, I’m going to pull up to this other car and tell them to pull over. So I get in the other lane and I pull up next to them. I look over and it is four men, and three of them are asleep! I’ve got to stop them to get their insurance. I was gesticulating at them. There was another some sort of a service car, or some sort of county-related government car. I tried to flag them down, and they just looked confused. Finally I drove home and looked at it. Boy, am I glad for tempered glass. If this had happened 50 years ago, I would be dead. And my daughter was in the car seat in the back going, “What’s going on, mom?”
Listener: Wow! Yes, thank goodness for tempered glass. That’s so scary to think about! You said the word “adrenaline.” What do you mean?
Speaker: That’s the part where you kind of panic a little bit. Everything’s happening fast but sort of slow at the same time. Your heart’s beating fast, and you’re not quite sure what the right thing to do is, but you have to do something. You have a smidgeon of common sense to not veer off the road. But this sort of thing has never happened before, so some of the adrenaline is from being in unfamiliar water. I wasn’t sure what to do next. Maybe I should get the name of the company. I tried to get the license plate. I remember looking them up on the Internet when I got home. I was thinking, “Can I just call them and tell them, ‘you guys did this to my car.’” I was upset.
Listener: You were upset?
Speaker: It’s a good $500 when something happens to your car! But the adrenaline was also knowing it could have been worse. You just get scared. Everything on that truck should have been packed up and strapped down. This stuff happens all the time, though, which is what’s scary. In a perfect world, nothing would ever happen like this. So it was adrenaline to do something: fight or flee. Or a little of both. [laughs]
Listener: You say you looked them up on the Internet when you got home?
Speaker: I looked them up to make sure it was a company. I thought about calling them, but what would I have said? How can I prove that anything happened? It happened on a freeway going 65 miles per hour. There were no witnesses. All I have is a car that needs a new windshield and is undrivable. I decided I guess there’s nothing I can do about this, except chalk it up to one of life’s experiences. Try to learn from it. Never drive behind a work truck like that. Tell my teenagers never to drive behind a truck. There are all sorts of scary scenarios; you can drive yourself crazy with it. When my husband got home he said I got lucky. He said, “That was in a really bad spot. You could have really gotten hurt.”
Listener: What was going through your mind when he told you that?
Speaker: That I completely agree, “Yeah, you’re right.” “Oh yeah, it wasn’t just my imagination.” It was a validation. I am as lucky as I think I am.
Writing Summaries
After collecting stories, the team sat down to go over the details in the written transcripts. Making sense of what a person said from the transcript provided them double the depth of understanding rather than simply listening. It involved corralling messy, meandering dialog, picking out certain quotes to put with other parts of this person’s dialog, and forging a better idea of what he really meant to convey. This work allowed the team to absorb participants’ thoughts, reactions, and philosophies. The team developed deep cognitive empathy with the participants.
Here are some example quotes the team worked through. They strung together several quotes from one transcript that represented the same concept, jotted down whether it was reasoning/thinking, a reaction, or a guiding principle, tried out a few verbs that could possibly star as the first scintillating word of the summary, then wrote the summary for that concept.
Maybe I should get the name of the company. … get the license plate. … if that happened to someone else, and they were telling me about it, I’d ask, “Who did it?” … to get information about them … I remember looking them up on the Internet when I got home. … I looked them up to make sure it was a company.
(thinking)
Verbs: Get, Find, Look, Identify …
Summary: Identify who made this accident happen, by the name of the company or the license place, because I want to know who did it.
Finally I drove home … I decided I guess there’s nothing I can do about this, except chalk it up to one of life’s experiences.
(thinking)
Verbs: Drive, Decide, Think, Chalk, Realize, Conclude …
Summary: Decide to drive home because there was nothing I could do
Finding Patterns
After summarizing all the concepts in all 24 transcripts, the team looked for patterns across the summaries. As patterns started to form, they found surprises, as well as things they expected. Both the surprises and the nonsurprises became extremely useful later for reframing their thinking.
When the team was finished, they went through all the piles a second time to see if the piles themselves formed into bigger groups. Here is a list of all the piles they labeled (the indented a, b, c level) and the groups that formed based on these piles (the 1, 2, 3 level).
- Recognize I am in a dangerous situation
- Feel shocked to suddenly be in a situation that could be dangerous
- Feel terrified that I’m about to have an accident (or get hurt)
- Figure out if this is a dangerous situation
- Get safe again
- Reach out mentally to others for help to get out of the situation
- Find out if anyone was hurt
- Feel relieved I was/others were not hurt
- Reassure people I am not hurt
- Feel relieved it’s over
- Feel relieved the danger is over
- Spend some time getting the adrenaline out of my system
- Feel surprised I reacted this way
- Feel angry at the other person involved.
- Confront the other person (or not) so he knows he put me out
- Confront the person so he won’t do it again to anyone else
- Try to defuse the tension between me and the other person involved
- Wonder what the other person involved was thinking
- Feel upset that the person who did this probably wasn’t paying attention, doesn’t care
- Feel upset with myself
- Feel embarrassed at my reaction, lack of skill
- Return home/to what I was doing
- Get back home
- Follow the insurance process
- Feel compelled to do things I don’t think need to be done because of the insurance process
- Spend time thinking about what happened
- Think about what would have happened if
- Feel amazed how such a minor thing caused such big repercussions
- Feel grateful for emotional support from people after the incident
- Figure the accident could have been worse, which qualifies it as a near-miss
- Try to prevent this from happening again/to others
- Convince someone in charge to do something to prevent this from happening again
- Change my actions so this doesn’t happen again
- Prevent an accident by following safe habit
The Mental Model Diagram
The labels from the piles the team put together are the titles of the towers in the mental model diagram. The boxes within each tower are each of the summaries, themselves. The affinity groups that formed are the mental spaces for the diagram (Figure 12-10).
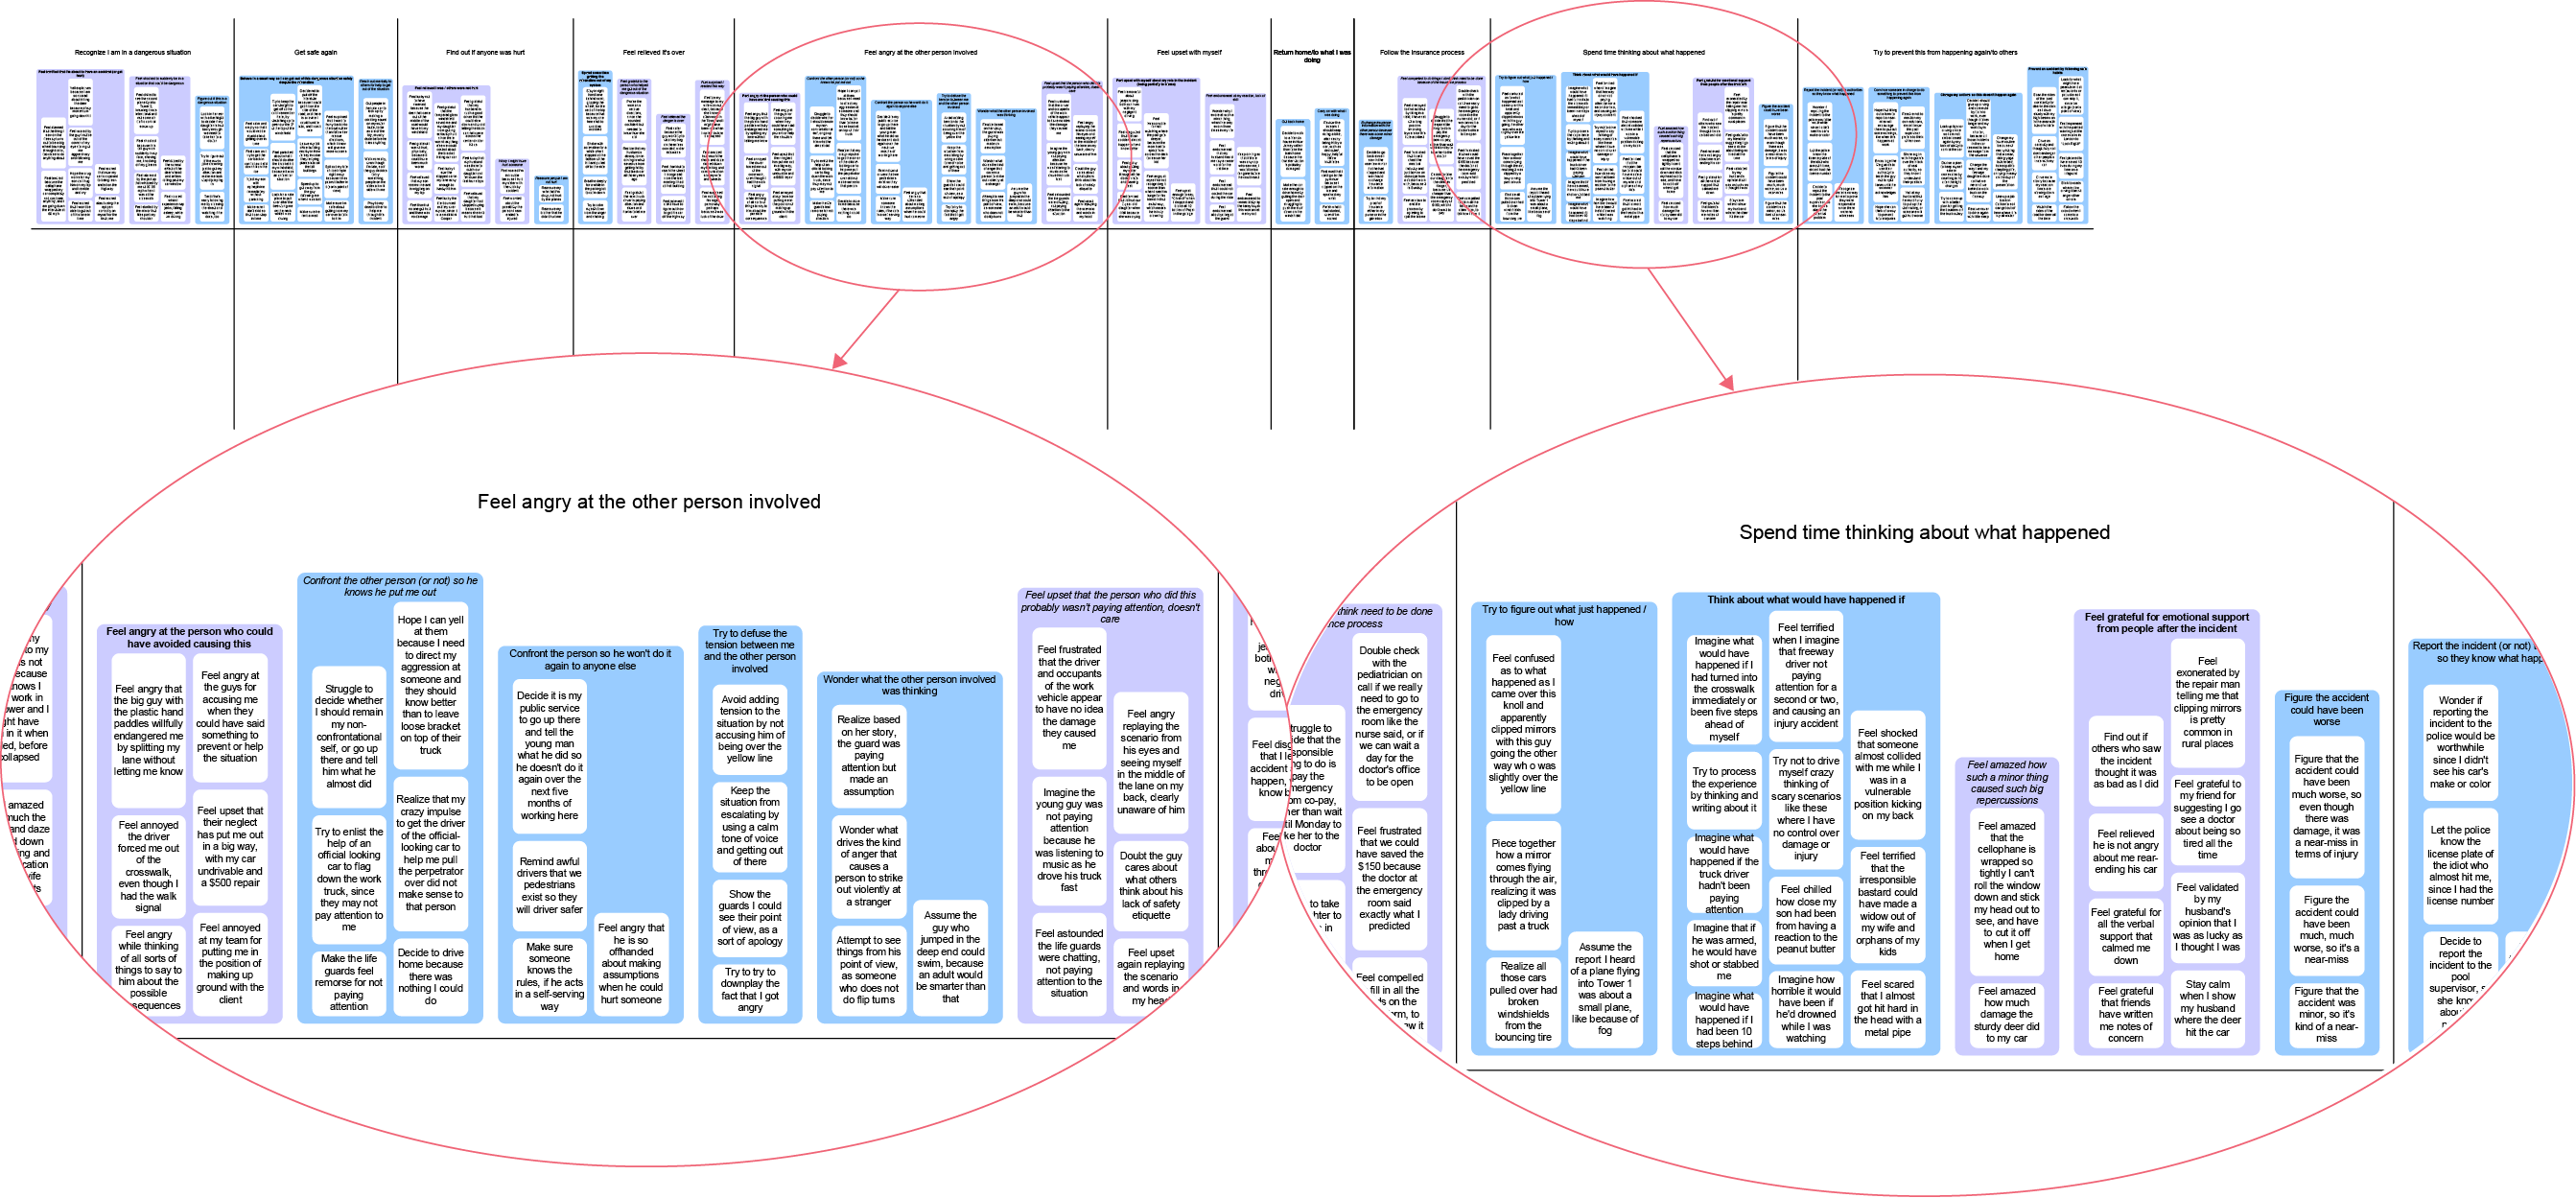
FIGURE 12-10. The top portion of a mental diagram generated from primary research.
Zero In on Current Business Goals
There are quite a few patterns the team found in the summaries. Their next step was to bring attention to some of the behaviors related to priorities articulated in this year’s business goals. These are the business goals:
- Increase membership—attract more insurance customers (a perennial goal)
- Reduce claims (a perennial goal)
- Leverage the company’s social capital (has been a goal for four years)
- Offer more services via mobile apps, phone or tablet—to help people “on the scene” (has been a goal for the past two years)
- Increase employee pride in what the company does (new this year)
With these organization-wide goals in mind, the team went through the list of patterns and chose those of interest. These are patterns that the team thinks might be able to affect some of the goals.
- Reassure people I am not hurt
- Confront the person so he won’t do it again to anyone else
- Try to defuse the tension between me and the other person involved
- Feel upset with myself about my role in the incident (being partially to blame)
- Feel embarrassed at my reaction, lack of skill
- Spend some time getting the adrenaline out of my system
- Report the incident (or not) to authorities so they know what happened
- Convince someone in charge to do something to prevent this from happening again
- Change my actions so this doesn’t happen again
- Feel compelled to do things I don’t think need to be done because of the insurance process
- Prevent an accident by following safe habits
- Figure the accident could have been worse, which qualifies it as a near-miss
Get Started Inspiring Ideas
Finally, during some working sessions with key stakeholders, the team used these patterns to touch off some ideation. Using the actual stories they heard in the listening sessions, the team helped the group cycle through extensions that might end in various ways for the organization. They guided the working session so that the ideas were not limited to an existing product or a service.
Here are a few of the ideas the group came up with, along with notes about feasibility and questions to further explore before deciding whether to pursue an idea.
Idea: Warn Others of This Hazard or Error
Pattern: Some customers want to report the incident so that authorities know what happened, so they are aware of a hazard or of the process not working right.
Idea: Choose a few details to describe the hazard or error. If these details don’t cover it, type in a description. We’ll get the information to people who can warn others.
Goals Met:
Reduce Future Claims: Getting the message out to the channels that customers already use, such as traffic reports or Google maps, will help them become aware of a road hazard. They can drive a safer route.
Build Social Capital: If we can get the message out that the customers are supplying these valuable hazard reports, and we’re getting it to the right people, that would certainly build our reputation.
Increase Membership: Customers will feel satisfaction helping others avoid what they experienced. They may pass the word to others.
Idea: Claim-Lite
Pattern: Several of the near-misses are actually minor accidents. People are thinking “it could have been so much worse.” The subsequent interaction with the insurance process become too entangling, when people think of their incident as a near-miss.
Idea: Create a new kind of claim for when the people involved consider it minor, and they don’t want the process to become too involved.
Goals Met:
Increase Membership: If it is a positive experience, customers will talk about this kind of claim. After the new process seems to be working and stable, we can use it in our marketing.
Reduce Future Claims: This should actually read, “reduce claims,” since we’ll replace a certain percentage of claims with the “lite” version.
This insurance company example demonstrates the way person-focused research can reframe the way an internal group approaches improvements to their offerings and to their internal processes. Not every idea should be pursued. The team will want to test them. Some of the ideas will wait until later; others will never see any more attention. It’s even possible that none of the ideas from an interval make sense for the organization. Try not to become too attached. What’s key is to use your empathic understanding of people that the idea supports to clearly judge whether to invest more resources in it, or let it wither. Successful organizations know the difference.
* Because it’s difficult to get legal permission to use genuine studies and transcripts, the insurance company case study is fake. The 24 participant stories that were collected are true, but the ideas that emerged from the findings are invented from a foundation of two decades’ experience.
Diagram and Image Credits
Figure 12-2: Diagram by Don Norman from his book The Design of Everyday Things (1988)
Figure 12-3: Diagram by Indi Young from her book Mental Models (Rosenfeld Media 2008), used with permission
Figure 12-6: Image from Indi Young’s book Mental Models (Rosenfeld Media, 2008), used with permission
Figure 12-7: Diagram by Philip Johnson-Laird from his book Mental Models (Harvard Business Press, 1983)
Figure 12-8: Goals-means framework by Beth Kyle from “With Child: Personal Informative and Pregnancy.” http://www.bethkyle.com/EKyle_Workbook3_Final.pdf
Figure 12-9: Diagram by Jim Kalbach
Figure 12-10: Diagram by Indi Young, used with permission