
“If you don’t know where you are going, any road will get you there.”
IN THIS CHAPTER
- Storyboards, scenarios, and storylines
- Design maps and user story maps
- Business model canvas and value proposition canvas
- Case Study: Customer Journey Mapping Game
In the preface, I urged you to empathize with the people you serve. The advice is clear: view your offering from the outside-in rather than the inside-out.
But it’s important to first develop empathy before conceiving new solutions. Distinguish gaining empathy from applying empathy, a point Indi Young makes in her book Practical Empathy (Rosenfeld Media, 2015). She writes:
You can’t apply empathy until you’ve developed it by listening deeply to a person...People try to act empathetic—to take someone’s perspective, to walk in his shoes—without first taking time to develop empathy.
I’ve experienced this trap in the past. At a prior company I worked for, for example, a small team spent two months behind closed doors developing a new concept that helped people plan events. They had virtually no contact with potential customers.
To anyone who had already gained empathy for the target users it was clear this solution had serious flaws. It didn’t address actual user needs, and it didn‘t match their mental model. Despite the team’s passion, the concept was doomed from the outset. They would have better spent their time developing empathy first.
![]() Note that I am not advocating big, upfront research. Ideally, empathy building is a regular ongoing activity. But grounding yourself in reality first saves time and reduces risk later. It need not take long, and visualization tends to make the process go quicker.
Note that I am not advocating big, upfront research. Ideally, empathy building is a regular ongoing activity. But grounding yourself in reality first saves time and reduces risk later. It need not take long, and visualization tends to make the process go quicker.
The process of mapping helps teams acquire develop common understanding of a person’s experience. For this reason, this book has focused on current state visualizations—diagrams of the world as it exists today. After gaining empathy, then envision a future as you think it should be.
One approach to represent the intended experience is to create future state maps of the experience—separate, full-fledged illustrations akin to those described throughout this book. However, this is time consuming and is often not needed.
Instead, it’s typically possible to include future experiences within the current state map, for example at the bottom of a diagram (see Figure 8-1). This highlights the transition needed to move from the present to the future. Both cause and cure are captured in one place.

FIGURE 8-1. Mapping the current state to the future state shows the relationship between the two.
But also, it’s more efficient to use complementary techniques to illustrate the future state creates greater impact. This chapter deals with some of these techniques, including storyboards, scenarios, storylines, and design maps, as well as user story mapping. By the end of the chapter you should have a good idea of how to visualize future experiences with complementary techniques.
Storyboards
Storyboards come from filmmaking. The process organizes a series of illustrated panels to represent the flow from scene to scene. A storyboard allows creators to experiment with different sequences of action.
The technique is also used in product and service design. Each step in the experience is given a panel with a rough description of what should happen at that moment. Storyboarding is a way to quickly flesh out concepts before building a prototype.
As a modeling tool, storyboarding helps you put personas in action, taking various constraints and context into account. If an alignment diagram is a map of the landscape, storyboards are specific routes through that landscape.
Storyboards let you focus on the emotional highs and lows of a specific experience. They also allow you to focus on extreme cases. For instance, you can create a storyboard for a novice user of a system and compare it to what a power user might experience in another storyboard.
![]() More than that, storyboards allow you to test ideas and “debug” them conceptually. They serve as the first iteration of an idea and allow teams to think about the service in terms of how the experience unfolds over time. This saves an enormous amount of time and pain later.
More than that, storyboards allow you to test ideas and “debug” them conceptually. They serve as the first iteration of an idea and allow teams to think about the service in terms of how the experience unfolds over time. This saves an enormous amount of time and pain later.
Storyboards are also collaborative documents that anyone can contribute to. Their informal nature invites contributions from others, fostering teamwork and collective decision making. They become part of the common language of the team and function as a shared reference.
Figure 8-2 shows an example of a simple storyboard created in a workshop by UX designer Erik Hanson. It was used to demonstrate the essence of a new idea, which evolved and changed over the course of the ensuing discussion.

FIGURE 8-2. A simple storyboard can be very effective, like this one created by UX designer Erik Hanson.
More formal storyboards take time. For instance, I helped create a storyboard of the intended experience on a recent project. The concept allowed people to take a picture of a technical problem and request help from a network of experts and friends.
First, I sketched a rough sequence of interactions using a drawing app on my iPad (see Figure 8-3). As a team, we iterated on this sequence several times. Then, we enlisted the help of Deb Aoki, a professional comic artist and graphic facilitator, to make the panels into a more presentable storyboard (see Figure 8-4).

FIGURE 8-3. A draft storyboard shows an intended experience.
The touchpoints and interactions are clearly depicted in this storyboard. But there is also a focus on the human experience: the initial problem is described, and the emotions of the resolution are represented. The storyboard helped form the idea and socialize the concept with others in the organization.

FIGURE 8-4. A revised version of the storyboard in Figure 8-3, created by expert illustrator Deb Aoki.
Comic strips are like storyboards and used to communicate a vision. Figure 8-5 shows an example from Kevin Cheng’s book See What I Mean (Rosenfeld Media, 2012). Obviously Cheng is an expert illustrator. But don’t be daunted: he breaks down the technique into its basic components to show that anyone can get started creating comic strips at some level.

FIGURE 8-5. Comics are an effective way to envision future ideas, like this one by illustrator Kevin Cheng from his book See What I Mean.
Overall, storyboards are a type of visual storytelling. They depict the steps in an interaction and foster a shared understanding of a vision. You don’t need to be an expert illustrator to create storyboards: sketching basic shapes and stick figures is all that’s required to get started. Have an expert create a final version, if needed.
Scenarios
Scenarios are detailed descriptions of an intended experience from the individual’s perspective. They go hand-in-hand with storyboards, but are text-based rather than illustrated. Since no drawing is involved, the barrier to create them is even lower than with storyboards.
Consider this example of a scenario from the beginning of the landmark article “The Semantic Web” by Tim Berners-Lee, inventor of the World Wide Web, and his colleagues. These are the opening lines of his landmark article that set the stage for a broader, more technical discussion later on in the text:
The entertainment system was belting out the Beatles’ “We Can Work It Out” when the phone rang. When Pete answered, his phone turned the sound down by sending a message to all the other local devices that had a volume control. His sister, Lucy, was on the line from the doctor’s office: “Mom needs to see a specialist and then has to have a series of physical therapy sessions. Biweekly or something. I’m going to have my agent set up the appointments.” Pete immediately agreed to share the chauffeuring.
At the doctor’s office, Lucy instructed her Semantic Web agent through her handheld Web browser. The agent promptly retrieved information about Mom’s prescribed treatment from the doctor’s agent, looked up several lists of providers, and checked for the ones in-plan for Mom’s insurance within a 20-mile radius of her home and with a rating of excellent or very good on trusted rating services. It then began trying to find a match between available appointment times (supplied by the agents of individual providers through their websites) and Pete’s and Lucy’s busy schedules.
In a few minutes the agent presented them with a plan. Pete didn’t like it—University Hospital was all the way across town from Mom’s place, and he’d be driving back in the middle of rush hour. He set his own agent to redo the search with stricter preferences about location and time. Lucy’s agent, having complete trust in Pete’s agent in the context of the present task, automatically assisted by supplying access certificates and shortcuts to the data it had already sorted through.
Almost instantly the new plan was presented: a much closer clinic and earlier times—but there were two warning notes. First, Pete would have to reschedule a couple of his less important appointments. He checked what they were—not a problem. The other was something about the insurance company’s list failing to include this provider under physical therapists: “Service type and insurance plan status securely verified by other means,” the agent reassured him.
The words not in italics come from the original source of this scenario and indicate touchpoints with the Semantic Web. This example has many qualities of a well-written scenario. It’s easy to understand, it’s enjoyable to read, it describes an experience rather than technology, and it offers a clear vision.
Scenarios describe the ideal user experience. They give personas a voice and set them in motion. And as with storyboards, scenarios allow you to focus on edge cases. They let you explore specific experiences, including extreme situations.
![]() Scenarios also help validate an idea. For instance, I once participated in an ideation workshop where we spent hours writing up our favorite ideas as scenarios. It was very telling: some of the most attractive ideas were difficult to describe in terms of the user experience. Based on these scenarios, we were better able to prioritize our ideas.
Scenarios also help validate an idea. For instance, I once participated in an ideation workshop where we spent hours writing up our favorite ideas as scenarios. It was very telling: some of the most attractive ideas were difficult to describe in terms of the user experience. Based on these scenarios, we were better able to prioritize our ideas.
Rarely can you go from a rough idea on a sticky note directly to implementation. Steps are needed in between to expand on the features of a concept. Scenario writing is a quick way to involve everyone on the team and represent an intended experience in detail for evaluation and feedback.
Storylines
Storytelling is not only a means of communicating a vision, it helps make sense of complex problems. According to digital product strategist Donna Lichaw, author of The User’s Journey: Storymapping Products That People Love (Rosenfeld Media, 2016), you can use the principles of storytelling to guide the design of products and services.
To do this, Lichaw relies on a structure common to most all stories, called the narrative arc (Figure 8-6).

FIGURE 8-6. The archetypal narrative arc shows the rise in action before the resolution.
This structure is not new. It can be traced all the way back to Aristotle. It is a timeless form used to tell stories over thousands of years and across cultures.
The elements of the narrative arc are:
- Exposition: Good stories establish the context and introduce the characters and situation at the beginning.
- Inciting incident: This is the point where something goes wrong or there is some change to the situation.
- Rising action: A good story builds over time. Intensity and action increase as the story unfolds.
- Crisis: The story culminates at the point of maximum friction. It’s the point of no return.
- Climax/resolution: The climax is the most exciting part of the story and the point at which the audience realizes that all might be well again. This is when the problem that was surfaced at the inciting incident is resolved.
- Falling action: But wait, there’s more. After the climax, the story comes back down in action and begins to end.
- End: This is the very end of the narrative. Typically, there is a return back to the original state.
The point of storylines is not storytelling, but rather building products and services as if you are crafting a story. In other words, apply the narrative arc to the design process itself. To do this, Lichaw recommends first mapping out an ideal journey against the narrative. Then design your product or service based on that flow.
![]() Figure 8-7 shows an example of using a narrative arc to plan the content of a digital service. The intent is to make the user’s journey into a dramatic, engaging story. The result is a strategy for content and features that meet audience needs in an engaging way.
Figure 8-7 shows an example of using a narrative arc to plan the content of a digital service. The intent is to make the user’s journey into a dramatic, engaging story. The result is a strategy for content and features that meet audience needs in an engaging way.

FIGURE 8-7. An example of a narrative arc and envisioned content from a workshop shows the rise of action and resolution.
Applying narrative arcs in design workshops is straightforward. Together with Lis Hubert, Lichaw describes the process in their article “Storymapping: A MacGyver Approach to Content Strategy” (UX Matters, 2014).
- Hold a workshop with a broad set of stakeholders
- Draw the user’s journey as a narrative arc on a whiteboard
- Map individual pieces of content users would need at each stage
- Below that, record existing content
- Identify gaps and weaknesses in the existing content
- Prioritize and plan a broader content strategy
Following these steps results in a content strategy with focus and meaning. It aligns teams to a common purpose and yields more engaging services in general.
Design Maps
Design maps are simple diagrams of an ideal experience co-created by a team. The technique is described by Tamara Adlin and Holly Jamesen Carr in Chapter 10 of the book The Persona Lifecycle.
Creating a design map is a simple practice that requires only sticky notes and a whiteboard. The result is a map of an ideal experience. There are four basic elements in the map, each with a different color note:
- Steps: Blue notes denote the steps a given persona takes in a process.
- Comments: Green notes provide more details about each action, including thoughts, feelings, and pain points.
- Questions: Yellow notes capture questions a team has about the experience. They highlight their gaps in knowledge and assumptions about the proposed experience.
- Ideas: Pink notes are used to capture ideas how to provide a better service.
Figure 8-8 shows an example of a design map for a fictitious app. The steps, in blue, form the basis of the chronology across the top of the map. Comments, questions, and ideas appear below each step, forming an interlocking grid of sticky notes.
Interestingly, Adlin and Carr recommended using design maps asynchronously. The idea is to place a map in a common office area and invite colleagues to contribute to it individually. Over the course of days or weeks, team members can add questions and ideas as they come to light. With this, the map grows organically over time.
![]() Otherwise, design maps can be used in workshops to envision a future experience. For instance, I once used design maps in an alignment workshop with three breakout groups. First, each group created an ideal flow for one of three experiences we were targeting. They also added comments to describe the steps in greater detail.
Otherwise, design maps can be used in workshops to envision a future experience. For instance, I once used design maps in an alignment workshop with three breakout groups. First, each group created an ideal flow for one of three experiences we were targeting. They also added comments to describe the steps in greater detail.

FIGURE 8-8. An example of a design map, modeled after the technique outlined in The Persona Lifecycle.
Then, I rotated the groups so that they were now working with another group’s design map. They read the steps and comments on the new design map and posed questions about each step on a different color sticky notes.
Finally, I rotated the groups once more. After we read all of the steps, comments, and questions of the preceding groups, the task was to brainstorm new ideas at the bottom of the map. We also sketched the best ones as wireframes. In total, each group engaged with all three diagrams and got to build on their colleague’s thoughts.
Figure 8-9 shows part of one whiteboard used for this exercise. Note that the color coding of sticky notes varied from what Adlin and Carr set out. Instead, we used yellow notes for steps, blue for comments, pink for questions, and green for ideas. But the process for creating the design map was the same.

FIGURE 8-9. A section of a design map created in a workshop shows the various types of information on different-colored sticky notes.
This book is about possibilities. Throughout, I’ve highlighted many of the tools for mapping experiences, shown in Figure 8-10.

FIGURE 8-10. A sequence of techniques discussed in this book can be categorized into three groups: diagrams about individuals, context an goals, and future state diagrams.
But with possibilities comes choice. To help you select the best approach, consider the types of models that describe an experience:
- Models of individuals: who are you designing for? Personas, proto-personas, and consumer insight maps are examples.
- Models of context and goals: maps of experiences describe the circumstances of interaction. What are the jobs to be done? What are their needs, feelings, and motivations?
- Models of future experiences: finally, create models for the envisioned future state. What do solutions look like? How can we represent them for evaluation?
At a minimum, use one of each. More are possible, but be careful of model proliferation. Don’t confuse your audience.
![]() Alternatives for an informal diagramming might look like this:
Alternatives for an informal diagramming might look like this:
A more formal mapping process might include these models:
- Personas > Mental Model Diagram > Scenarios and storyboards > Value proposition canvas
- Consumer insight maps > Service blueprint >
storylines > Business model canvas
Always keep the intent of mapping in mind: to tell the story of interactions (past and future) to align your team.
User Story Mapping
My childhood neighbor had a Mr. Potato Head toy. If you’re not familiar with this toy, it’s a featureless plastic head to which you add various facial features. The resulting combinations can be humorous, e.g., Groucho Marx glasses with big red lips.
Producers of software typically want to avoid creating products that look like Mr. Potato Head. But without a common vision of what you are building, it’s possible to unknowingly combine elements that don’t go well together.
Agile development—the leading approach for software development—strives to break the product down into small chunks, called user stories. These are short descriptions of a feature told from the user’s perspective. User stories typically have a common format:
As a <type of user>, I want <some goal> so that <some reason>
While utilizing user stories makes development more manageable, it can also cause teams to lose the big picture of what they are building. Focusing on individual features gives a team tunnel vision, losing the overall picture of what is being built.
To avoid the Mr. Potato Head effect in software development, Agile coach and expert Jeff Patton came up with a technique called user story mapping. He advises development teams to not assume everyone has the same view of the final product. In his book User Story Mapping (O’Reilly, 2014), Patton describes this phenomenon and how to overcome it:
If I have an idea in my head and I describe it in writing, when you read that document, you might quite possibly imagine something different…However, if we get together and talk, you can tell me what you think and I can ask questions. The talking goes better if we can externalize our thinking by drawing pictures or organizing our ideas using index cards or sticky notes. If we give each other time to explain our thoughts with words and pictures, we build shared understanding.
Don’t assume that everyone has the same mental model of the outcome. More importantly, visualizations go a long way toward building a shared understanding (see Figure 8-11).

FIGURE 8-11. Don’t assume everyone has the same picture of the solution in their minds.
A strength of user story maps is that they are simple to comprehend. Figure 8-12 shows an example created by Steve Rogalsky, an expert agile coach with the company Protegra. You can see the alignment of user activities (in orange and blue sticky notes) to planned features (in yellow).
User story mapping has its roots in task modeling as pioneered by Larry and Lucy Constantine.* The technique is flexible, with different ways to approach creating a map. The main elements that most user story maps include are as follows:
- User types. A brief description of the different roles the system is designed for. These are typically listed at the top or on the side (not shown in Figure 8-12).
- Backbone. This is a sequence of user activities listed across the top of the diagram. Frequently a more granular description of user tasks that form a flow across the phases accompanies them. These are listed horizontally just below the phases of the backbone.
- User stories. The body of the map contains stories needed to achieve the desired outcomes. These are typically prioritized and separated into releases.
The backbone is similar to the chronology in an experience map. A user story map, however, tends to lack much of the detail and context of an experience map, such as thoughts and feelings. Instead, it focuses on software product development.
The process to user story mapping requires team participation from the very beginning. Follow these steps to involve everyone in the map’s creation:
- Frame the idea: As a team, discuss why you are building the product. Identify and record the benefits and problems it solves. Also decide on who you are building the product for. Write your responses down at the top of the map.
- Map the big picture: Illustrate the flow of the solution chronologically, including details about specific actions. If possible, include the pains and joys users have today to inform your development decisions.
- Explore: Use the map to facilitate conversations about desired outcomes and the intended experience. Describe the features to support users and record them as stories on the map. Sketch solutions as needed, and go back and interview customers as well.
- Create a release strategy: Break the user stories into different releases, starting with the minimum that’s necessary to reach the desired outcome.
- Build, measure, learn: As development progresses, track the team’s learning against the user story map. Keep it in a visible place and refer back to it often.

FIGURE 8-12. Story maps align development tasks with the intended user experience.
Typically, the exercise is done offline, utilizing sticky notes and a whiteboard. For instance, Figure 8-13 shows an example created in a team workshop. However, it’s also possible to map stories visually online using software such as LucidCharts or MURAL (http://mur.al).

FIGURE 8-13. This example of a user story map created by a team in a face-to-face workshop reveals prioritization of efforts into releases.
A user story map illustrates how user stories relate to one another in an overarching model. This allows teams to grasp the entirety of the system. More importantly, they align planning and development with actual user experiences. Ultimately, it’s about a shared understanding of software a team intends to build to guide decisions, improve efficiency, and result in better outcomes.
Further Reading
Donna Lichaw, The User’s Journey: Storymapping Products That People Love (Rosenfeld Media, 2016)
Donna regularly writes and teaches about storylines. This is a complete volume on the techniques she’s developed over the years. You can find more information online, including a pair of articles on UXMatters.com. Also see the book’s page on the Rosenfeld Media website for updates and additional information: http://rosenfeldmedia.com/books/storylines/.
Jeff Patton, User Story Mapping (O’Reilly, 2013)
Patton pioneered the technique of user story maps and details the approach in this book. It is well written and gets to key points quickly. Latter chapters include details on validation through lean processes.
John Pruitt and Tamara Adlin, The Persona Lifecycle: Keeping People in Mind Throughout Product Design (Morgan Kaufmann, 2006)
This is one of the few full-length books on personas that is often cited as the key reference source on the topic. At nearly 700 pages it is thorough and comprehensive. Chapter 8 discusses design maps in detail.
While utilizing user stories makes development more manageable, it can also cause teams to lose the big picture of what they are building.
* See, for example, Larry Constantine, “Essential Modeling: Use Cases for User Interfaces,” ACM Interactions (Apr 1995). As well as other writings by Constantine and his wife, Lucy.
![]() Working with multiple stakeholders is a challenge. They may have a different vision of the world driven by their individual goals and perspectives, whether coming from engineering, business, or public policy backgrounds.
Working with multiple stakeholders is a challenge. They may have a different vision of the world driven by their individual goals and perspectives, whether coming from engineering, business, or public policy backgrounds.
We Design Services (WDS), a leading service innovation firm, developed the customer journey mapping game to facilitate communication in such complex environments. The game uses the customer journey as a catalyst for team interaction.
While several configurations of the game are possible, a typical process has the following steps:
- Prepare the game: Before the game session, create a blank journey worksheet with swim lanes for relevant touchpoint and information types. Then furnish a set of cards representing possible touchpoints. These will vary depending on the domain and situation involved.
- Select personas: Start the game by having the participants choose a persona. Ask, “Whose journey are you going to map?”
- Set goals: Define a goal for this persona. What is the overall need and what are they trying to get done?
- Add touchpoints: Then, for the selected persona, place the touchpoints in the order they might experience them. Do this step as a team.
- Reflect: Find patterns in the experience across the different touchpoints. Where are there gaps and problems? Where are the emotional highs and lows? Where are there opportunities for the organization?
- Repeat: Select a different persona or change the goals, and repeat the process. How do the journeys differ? What are common patterns across them? How would extreme users experience the touchpoints?
We piloted this technique for a major French city that wanted to gather stakeholders for a co-creation exercise. The goal was to reinvent urban transportation.
This project was a challenge because of the widely different perspectives of the different people around the table (Figure 8-14). The participants came from car manufacturing companies, large commercial firms, public transit companies, and labor unions, as well as users of the system.

FIGURE 8-14. Playing the journey mapping game engages everyone in the workshop.
Introducing this new methodology allowed us to develop a common language shared by everyone and dominated by no one. This language helped identify shared value between the different stakeholders.
This initial workshop confirmed that mapping the user journey as a group is an efficient way to visualize common touchpoints, interests, and ways to create value. It proved to be eye-opening for participants.
In this case, participants reported an increased sense of team alignment and cross-functional collaboration, in general, after our workshops. Unfortunately, it is rarely used by local governments looking to re-energize their local ecosystem.
The underlying problem is siloed thinking. The journey mapping game breaks down those departmental barriers and allows companies to think holistically and collaboratively.
We tested our approach with other companies and have invariably found that aligning disparate points of view allows them to uncover new business opportunities.
The customer journey mapping game was originally developed by Christophe Tallec and Paul Kahn. Figure 8-15 shows an example of what a completed game round looks like.
Tallec and Kahn also created an online version of the journey game. You can access this template online at: http://prezi.com/1qu6lq4qucsm/customer-journey-mapping-game-transport/.
About the Contributor
Christophe Tallec is the founder of We Design Services (WDS), a leading service innovation agency in France, advising organizations such as Airbus Group, SNCF, The National French Post Office Groupe La Poste, Qatar Foundation, World Bank, and other industries. WDS is committed to delivering cutting-edge experiences.
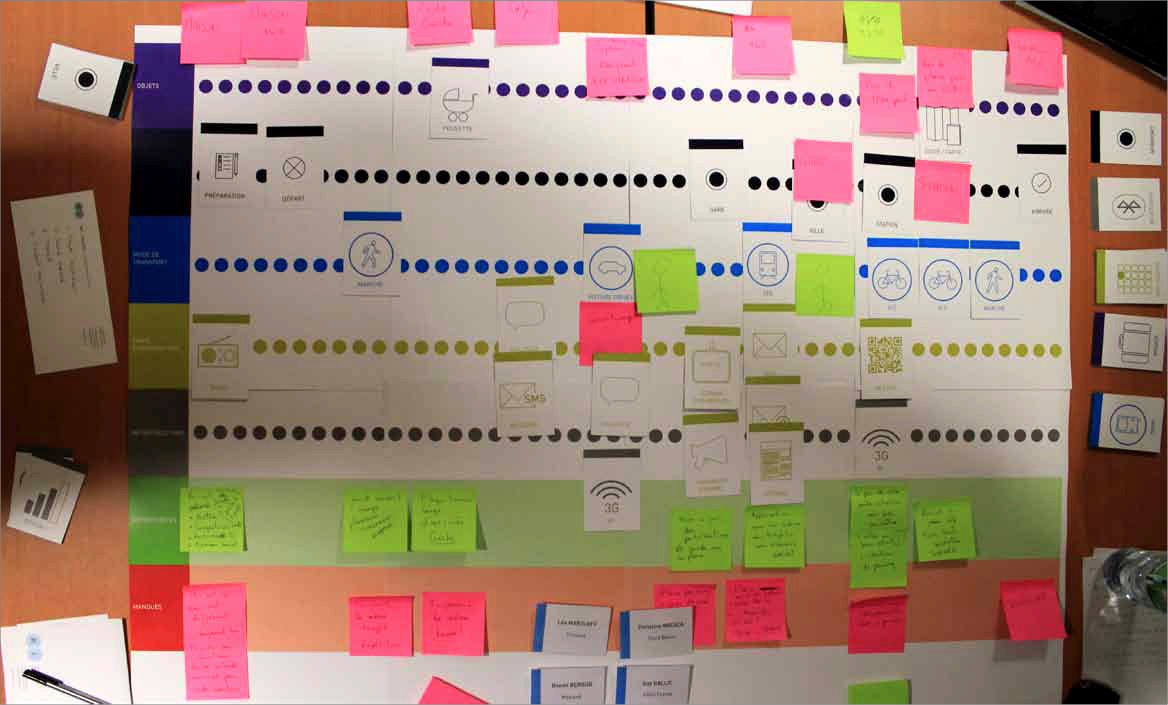
FIGURE 8-15. An example of a customer journey game board and elements.
Diagram and Image Credits
Figure 8-2: Storyboard sketched by Erik Hanson, used with permission
Figure 8-3: Draft storyboard created by Jim Kalbach
Figure 8-4: Storyboard created by Deb Aoki (http://www.debaoki.com), used with permission
Figure 8-5: Comic created by Kevin Cheng from his book See What I Mean (Rosenfeld Media), used with permission
Figure 8-6: Narrative arch diagram created by Donna Lichaw, used with permission
Figure 8-7: Photo of storyline exercise by Donna Lichaw, used with permission
Figure 8-8: Example design map created by Jim Kalbach
Figure 8-9: Image of design map by Jim Kalbach
Figure 8-11: Illustration from Jeff Patton’s book User Story Mapping (O’Reilly, 2014)
Figure 8-12: User story map created by Steve Rogalsky of Protegra (http://www.protegra.com), used with permission
Figure 8-13: Image of user story map by Steve Rogalsky, used with permission
Figure 8-14: Image of workshop participants playing the journey game, by Christophe Tallec, used with permission
Figure 8-15: Photo of an example journey game board by Christophe Tallec taken from http://servicedesigntools.org, used with permission