
Our first attempt at visualizing concurrency will have two simple goroutines running the drawPoint function in a loop with 100 iterations. After running this, you can visit localhost:1900/visualize and see what concurrent goroutines look like.
If you run into problems with port 1900 (either with your firewall or through a port conflict), feel free to change the value on line 99 in the main() function. You may also need to access it through 127.0.0.1 if your system doesn't resolve localhost.
Note that we're not using WaitGroup or anything to manage the end of the goroutines because all we want to see is a visual representation of our code running. You can also handle this with a specific blocking code or runtime.Gosched(), as shown:
package main

import (
    "github.com/ajstarks/svgo"
    "net/http"
    "fmt"
    "log"
    "time"
    "strconv"
)

var width = 800
var height = 400
var startTime = time.Now().UnixNano()


func drawPoint(osvg *svg.SVG, pnt int, process int) {
  sec := time.Now().UnixNano()
  diff := ( int64(sec) - int64(startTime) ) / 100000

  pointLocation := 0

  pointLocation = int(diff)
  pointLocationV := 0
  color := "#000000"
  switch {
    case process == 1:
      pointLocationV = 60
      color = "#cc6666"
    default:
      pointLocationV = 180
      color = "#66cc66"

  }

  osvg.Rect(pointLocation,pointLocationV,3,5,"fill:"+color+";stroke:
  none;")
  time.Sleep(150 * time.Millisecond)
}

func visualize(rw http.ResponseWriter, req *http.Request) {
  startTime = time.Now().UnixNano()
  fmt.Println("Request to /visualize")
  rw.Header().Set("Content-Type", "image/svg+xml")

  outputSVG := svg.New(rw)

  outputSVG.Start(width, height)
  outputSVG.Rect(10, 10, 780, 100, "fill:#eeeeee;stroke:none")
  outputSVG.Text(20, 30, "Process 1 Timeline", "text-
    anchor:start;font-size:12px;fill:#333333")
  outputSVG.Rect(10, 130, 780, 100, "fill:#eeeeee;stroke:none")
  outputSVG.Text(20, 150, "Process 2 Timeline", "text-
    anchor:start;font-size:12px;fill:#333333")

  for i:= 0; i < 801; i++ {
    timeText := strconv.FormatInt(int64(i),10)
    if i % 100 == 0 {
      outputSVG.Text(i,380,timeText,"text-anchor:middle;font-
        size:10px;fill:#000000")
    }else if i % 4 == 0 {
      outputSVG.Circle(i,377,1,"fill:#cccccc;stroke:none")
    }


    if i % 10 == 0 {
      outputSVG.Rect(i,0,1,400,"fill:#dddddd")
    }
    if i % 50 == 0 {
      outputSVG.Rect(i,0,1,400,"fill:#cccccc")
    }


  }

  for i := 0; i < 100; i++ {
    go drawPoint(outputSVG,i,1)
    drawPoint(outputSVG,i,2)
  }

  outputSVG.Text(650, 360, "Run without goroutines", "text-
    anchor:start;font-size:12px;fill:#333333")
  outputSVG.End()
}

func main() {
  http.Handle("/visualize", http.HandlerFunc(visualize))

    err := http.ListenAndServe(":1900", nil)
    if err != nil {
        log.Fatal("ListenAndServe:", err)
    }

}
When you go to localhost:1900/visualize, you should see something like the following screenshot:
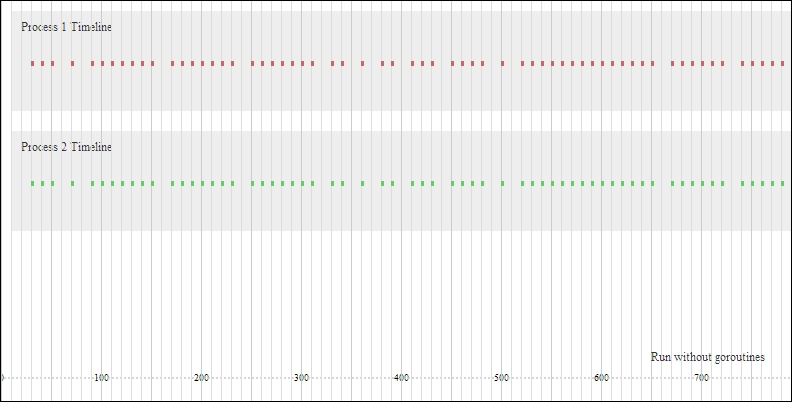
As you can see, everything is definitely running concurrently—our briefly sleeping goroutines hit on the timeline at the same moment. By simply forcing the goroutines to run in a serial fashion, you'll see a predictable change in this behavior. Remove the goroutine call on line 73, as shown:
    drawPoint(outputSVG,i,1)
    drawPoint(outputSVG,i,2)
To keep our demonstration clean, change line 77 to indicate that there are no goroutines as follows:
outputSVG.Text(650, 360, "Run with goroutines", "text-
  anchor:start;font-size:12px;fill:#333333")
If we stop our server and restart with go run, we should see something like the following screenshot:
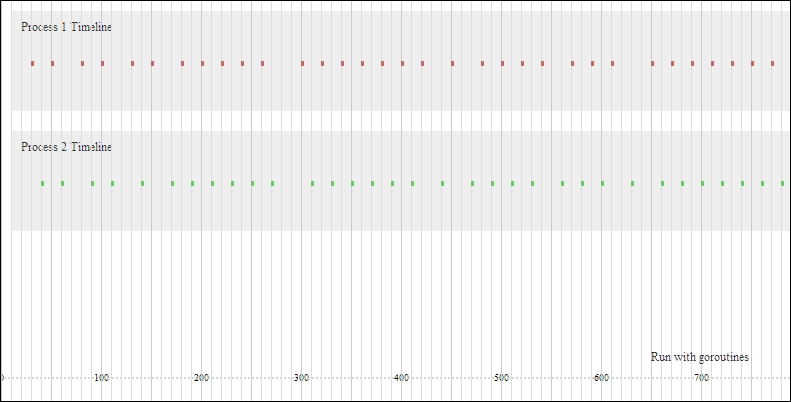
Now, each process waits for the previous process to complete before beginning. You can actually add this sort of feedback to any application if you run into problems with syncing data, channels, and processes.
If we so desired, we could add some channels and show communication across them as represented. Later, we will design a self-diagnosing server that gives real-time analytics about the state and status of the server, requests, and channels.
If we turn the goroutine back on and increase our maximum available processors, we'll see something similar to the following screenshot, which is not exactly the same as our first screenshot:
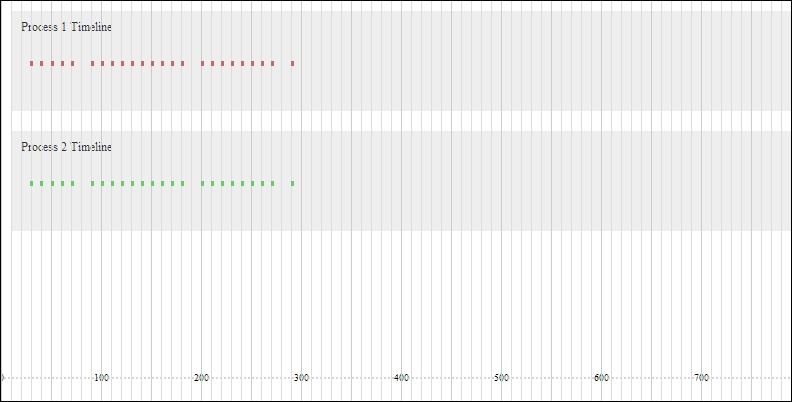
Your mileage will obviously vary depending on server speeds, the number of processors, and so on. But in this case, our change here resulted in a faster total execution time for our two processes with intermittent sleeps. This should come as no surprise, given we have essentially twice the bandwidth available to complete the two tasks.