
Just when you think you've seen the entire spectrum of Go's amazing tool set, there's always one more utility that, once you realize it exists, you'll wonder how you ever survived without it.
Go format is great for cleaning up your code; the -race flag is essential for detecting possible race conditions, but an even more robust, hands-in-the-dirt tool exists that is used to analyze your final application, and that is pprof.
Google created pprof initially to analyze loop structures and memory allocation (and related types) for C++ applications.
It's particularly useful if you think you have performance issues not uncovered by the testing tools provided in the Go runtime. It's also a fantastic way to generate a visual representation of the data structures in any application.
Some of this functionality also exists as part of the Go testing package and its benchmarking tools—we'll explore that more in Chapter 7, Performance and Scalability.
Getting the runtime version of pprof to work requires a few pieces of setup first. We'll need to include the runtime.pprof package and the flag package, which allows command-line parsing (in this case, for the output of pprof).
If we take our chat server code, we can add a couple of lines and have the application prepped for performance profiling.
Let's make sure we include those two packages along with our other packages. We can use the underscore syntax to indicate to the compiler that we're only interested in the package's side effects (meaning we get the package's initialization functions and global variables) as shown in the following lines of code:
import
(
  "fmt"
...
  _ "runtime/pprof"
)
Next, in our main() function, we include a flag parser that will parse and interpret the data produced by pprof as well as create the CPU profile itself if it does not exist (and bailing if it cannot be created), as shown in the following code snippet:
var profile = flag.String("cpuprofile", "", "output pprof data to
  file")

func main() {
  flag.Parse()
  if *profile != "" {
    flag,err := os.Create(*profile)
    if err != nil {
      fmt.Println("Could not create profile",err)
    }
    pprof.StartCPUProfile(flag)
    defer pprof.StopCPUProfile()

  }
}
This tells our application to generate a CPU profiler if it does not exist, start the profiling at the beginning of the execution, and defer the end of the profiling until the application exits successfully.
With this created, we can run our binary with the cpuprofile flag, which tells the program to generate a profile file as follows:
./chat-server -cpuprofile=chat.prof
For the sake of variety (and exploiting more resources arbitrarily), we'll abandon the chat server for a moment and create a loop generating scores of goroutines before exiting. This should give us a more exciting demonstration of profiling data than a simple and long-living chat server would, although we'll return to that briefly:
Here is our example code that generates more detailed and interesting profiling data:
package main

import (
  "flag"
  "fmt"
  "math/rand"
  "os"
  "runtime"
  "runtime/pprof"
)

const ITERATIONS = 99999
const STRINGLENGTH = 300

var profile = flag.String("cpuprofile", "", "output pprof data to
  file")

func generateString(length int, seed *rand.Rand, chHater chan
  string) string {
  bytes := make([]byte, length)
  for i := 0; i < length; i++ {
    bytes[i] = byte(rand.Int())
  }
  chHater <- string(bytes[:length])
  return string(bytes[:length])
}

func generateChannel() <-chan int {
  ch := make(chan int)
  return ch
}

func main() {

  goodbye := make(chan bool, ITERATIONS)
  channelThatHatesLetters := make(chan string)

  runtime.GOMAXPROCS(2)
  flag.Parse()
  if *profile != "" {
    flag, err := os.Create(*profile)
    if err != nil {
      fmt.Println("Could not create profile", err)
    }
    pprof.StartCPUProfile(flag)
    defer pprof.StopCPUProfile()

  }
  seed := rand.New(rand.NewSource(19))

  initString := ""

  for i := 0; i < ITERATIONS; i++ {
    go func() {
      initString = generateString(STRINGLENGTH, seed,
        channelThatHatesLetters)
      goodbye <- true
    }()

  }
  select {
  case <-channelThatHatesLetters:

  }
  <-goodbye

  fmt.Println(initString)

}
When we generate a profile file out of this, we can run the following command:
go tool pprof chat-server chat-server.prof
This will start the pprof application itself. This gives us a few commands that report on the static, generated file as follows:
topN: This shows the top N samples from the profile file, where N represents the explicit number you want to see.web: This creates a visualization of data, exports it to SVG, and opens it in a web browser. To get the SVG output, you'll need to install Graphviz as well (http://www.graphviz.org/).
The command-line results will be telling enough, but it's especially interesting to see the blocking profile of your application presented in a descriptive, visual way as shown in the following figure. When you're in the pprof tool, just type in web and a browser will spawn with the CPU profiling detailed in SVG form.
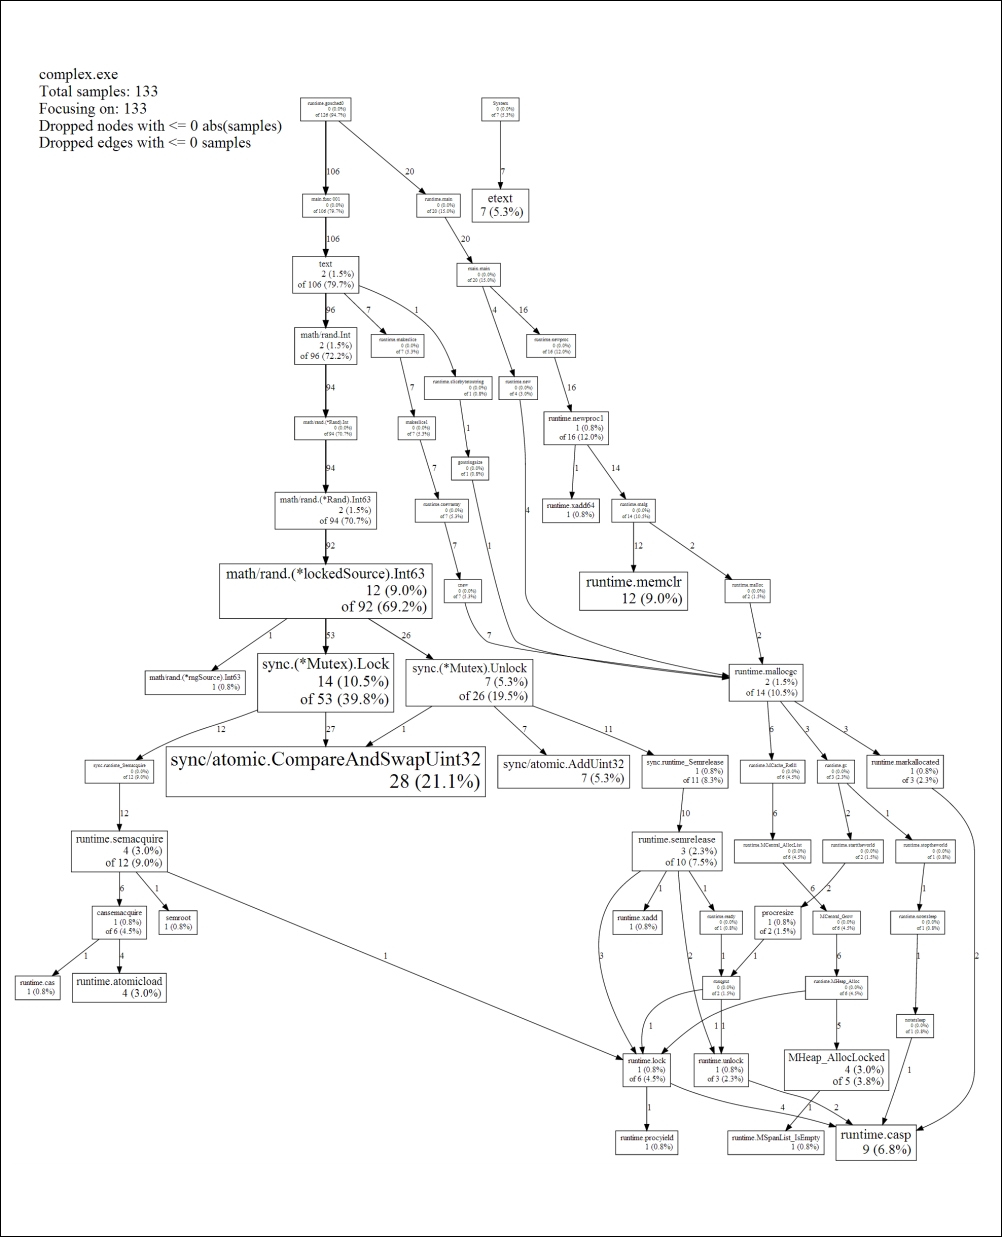
The idea here is less about the text and more about the complexity
And voila, we suddenly have an insight into how our program utilizes the CPU time consumption and a general view of how our application executes, loops, and exits.
In typical Go fashion, the pprof tool also exists in the net/http package, although it's more data-centric than visual. This means that rather than dealing exclusively with a command-line tool, you can output the results directly to the Web for analysis.
Like the command-line tool, you'll see block, goroutine, heap, and thread profiles as well as a full stack outline directly through localhost, as shown in the following screenshot:
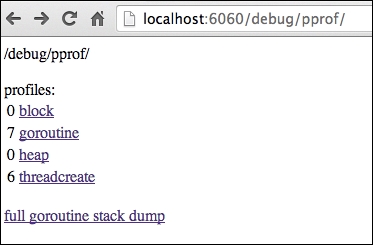
To generate this server, you just need to include a few key lines of code in your application, build it, and then run it. For this example, we've included the code in our chat server application, which allows us to get the Web view of an otherwise command-line-only application.
Make sure you have the net/http and log packages included. You'll also need the http/pprof package. The code snippet is as follows:
import(_(_
  "net/http/pprof"
  "log"
  "net/http"
)
Then simply include this code somewhere in your application, ideally, near the top of the main() function, as follows:
  go func() {
    log.Println(http.ListenAndServe("localhost:6060", nil))
  }()
As always, the port is entirely a matter of preference.
You can then find a number of profiling tools at localhost:6060, including the following:
- All tools can be found at
http://localhost:6060/debug/pprof/ - Blocking profiles cab be found at
http://localhost:6060/debug/pprof/block?debug=1 - A profile of all goroutines can be found at
http://localhost:6060/debug/pprof/goroutine?debug=1 - A detailed profile of the heap can be found at
http://localhost:6060/debug/pprof/heap?debug=1 - A profile of threads created can be found at
http://localhost:6060/debug/pprof/threadcreate?debug=1
In addition to the blocking profile, you may find a utility to track down inefficiency in your concurrent strategy through the thread creation profile. If you find a seemingly abnormal amount of threads created, you can toy with the synchronization structure as well as runtime parameters to streamline this.
Keep in mind that using pprof this way will also include some analyses and profiles that can be attributed to the http or pprof packages rather than your core code. You will find certain lines that are quite obviously not part of your application; for example, a thread creation analysis of our chat server includes a few telling lines, as follows:
#       0x7765e         net/http.HandlerFunc.ServeHTTP+0x3e     /usr/local/go/src/pkg/net/http/server.go:1149
#       0x7896d         net/http.(*ServeMux).ServeHTTP+0x11d /usr/local/go/src/pkg/net/http/server.go:1416
Given that we specifically eschewed delivering our chat application via HTTP or web sockets in this iteration, this should be fairly evident.
On top of that, there are even more obvious smoking guns, as follows:
#       0x139541        runtime/pprof.writeHeap+0x731           /usr/local/go/src/pkg/runtime/pprof/pprof.go:447
#       0x137aa2        runtime/pprof.(*Profile).WriteTo+0xb2   /usr/local/go/src/pkg/runtime/pprof/pprof.go:229
#       0x9f55f         net/http/pprof.handler.ServeHTTP+0x23f  /usr/local/go/src/pkg/net/http/pprof/pprof.go:165
#       0x9f6a5         net/http/pprof.Index+0x135              /usr/local/go/src/pkg/net/http/pprof/pprof.go:177
Some system and Go core mechanisms we will never be able to reduce out of our final compiled binaries are as follows:
#       0x18d96 runtime.starttheworld+0x126
  /usr/local/go/src/pkg/runtime/proc.c:451
Tip
A note for Windows users: pprof is a breeze to use in *nix environments but may take some more arduous tweaking under Windows. Specifically, you may need a bash replacement such as Cygwin. You may also find some necessary tweaks to pprof itself (in actuality, a Perl script) may be in order. For 64-bit Windows users, make sure you install ActivePerl and execute the pprof Perl script directly using the 64-bit version of Perl.
At publish time, there are also some issues running this on 64-bit OSX.