
6
Bypassing Anti-Reverse Engineering Techniques
In this chapter, we will cover various anti-reverse engineering techniques that malware authors use to protect their code against unauthorized analysts who want to understand its functionality. We will familiarize ourselves with various approaches, from detecting the debugger and other analysis tools to breakpoint detection, virtual machine (VM) detection, and even attacking anti-malware tools and products.
Additionally, we will cover the VM and sandbox-detection techniques that malware authors use to avoid spam detection, along with automatic malware-detection techniques that are implemented in various enterprises. As these anti-reverse engineering techniques are widely used by malware authors, it’s very important to understand how to detect and bypass them to be able to analyze complex or highly obfuscated malware.
This chapter is divided into the following sections:
- Exploring debugger detection
- Handling the evasion of debugger breakpoints
- Escaping the debugger
- Understanding obfuscation and anti-disassemblers
- Detecting and evading behavioral analysis tools
- Detecting sandboxes and VMs
Exploring debugger detection
For malware authors to keep their operations going without being interrupted by antivirus products or any takedown operations, they have to fight back and equip their tools with various anti-reverse engineering techniques. Debuggers are the most common tools that malware analysts use to dissect malware and reveal its functionality. Therefore, malware authors implement various anti-debugging tricks to complicate the analysis and keep their functionality and configuration details (mainly Command & Control servers or C&Cs) hidden.
Using PEB information
Windows provides lots of ways to identify the presence of a debugger; many of them rely on the information stored in the Process Environment Block (PEB). For example, one of its fields located at offset 2 and called BeingDebugged is set to True when the process is running under a debugger. To access this flag, malware can execute the following instructions:
mov  eax, dword ptr fs:[30h]     ; PEB
cmp  byte ptr [eax+2], 1 ; PEB.BeingDebugged
jz  <debugger_detected>
As you can see here, the pointer to PEB was found using the fs:[30h] technique. There are many other ways in which malware can get it:
- By using fs:[18h] to get a pointer to the TEB structure and, from there, using offset 0x30 to find the PEB.
- By using the NtQueryInformationProcess API with a ProcessBasicInformation argument. It returns the PROCESS_BASIC_INFORMATION structure, the second field of which, PebBaseAddress, will contain the PEB address.
An IsDebuggerPresent API can be used instead to perform exactly the same check.
NtGlobalFlag is another field located at offset 0x68 of the PEB on 32-bit systems and 0xBC on 64-bit systems, which can be used for debugger detection. During normal execution, this flag is set to zero, but when a debugger is attached to the process, this flag is set with the following three values:
- FLG_HEAP_ENABLE_TAIL_CHECK (0x10)
- FLG_HEAP_ENABLE_FREE_CHECK (0x20)
- FLG_HEAP_VALIDATE_PARAMETERS (0x40)
Malware can check for the presence of a debugger using these flags by executing the following instructions:
mov eax, fs:[30h] ; Process Environment Block
mov al, [eax+68h] ; NtGlobalFlag
and al, 70h ; Other flags can also be checked this way
cmp al, 70h ; 0x10 | 0x20 | 0x40
je <debugger_detected>
Here, malware prefers to check for the presence of all of these flags together by combining them into the value of 0x70 (the result of using bitwise OR against them).
The following logic can be used to detect the debugger in the 64-bit environment:
push 60h
pop rsi
gs:lodsq ; Process Environment Block
mov al, [rsi*2+rax-14h] ; NtGlobalFlag
and al, 70h
cmp al, 70h
je <debugger_detected>
This example is trickier, as we should keep in mind that the lodsq instruction will increase the value of the rsi register by 8 (the size of QWORD). So, as a result, we will get an offset of (0x60 + 0x8)*2 – 0x14 = 0xBC, as mentioned earlier.
Finally, to detect the debugger, malware can also use the ProcessHeap structure stored in PEB (offset 0x18 for 32-bit, 0x30 for 64-bit, and 0x1030 for WoW64 compatibility levels). This structure has two fields of interest:
- Flags (32-bit: offset 0x0c on XP, 0x40 on Vista+; 64-bit: offset 0x14 on XP, 0x70 on Vista+): Generally, malware can either check for the presence of 0x40000062 bits revealing the debugger or do the opposite – check whether the value is the default one (2).
- ForceFlags (32-bit: offset 0x10 on XP, 0x44 on Vista+; 64-bit: offset 0x18 on XP, 0x74 on Vista+): Here, malware can check for 0x40000060 bits set when the debugger is present or 0 otherwise.
Apart from the direct access, the pointer to the ProcessHeap structure can be found using the GetProcessHeap and RtlGetProcessHeaps APIs. The value of the Flags field in the ProcessHeap structure can be read using the RtlQueryProcessHeapInformation and RtlQueryProcessDebugInformation APIs.
Finally, the reason why these flags are set is that when the debugger is attached, heap tail checking will be enabled, and the system will be appending the 0xABABABAB signature at the end of the allocated blocks. So, the malware could allocate a heap block and check whether this signature is present there and, in this way, identify the presence of the debugger:

Figure 6.1 – Detecting the presence of the debugger because of heap tail checking
The common way to bypass these checks is by overwriting them with NOP instructions or by setting a breakpoint at the start of them to jump over the check. In addition, dedicated debugger plugins can be used to change the values of the PEB structure in memory.
Using EPROCESS information
EPROCESS is another system structure containing information about the process that can reveal the presence of the debugger:
- The DebugPort field is nonzero if the process is debugged using a remote debugger.
- The Flags field contains the NoDebugInherit flag, which is set to 1 if the debugger is present.
Unlike PEB, this structure is located in kernel mode and, therefore, not directly readable by usual processes. However, malware can use dedicated APIs to read its values:
- CheckRemoteDebuggerPresent: This checks the DebugPort field of the EPROCESS structure.
- NtQueryInformationProcess: This depends on the following arguments:
Using DebugObject
When the debugger is present, the system creates a dedicated DebugObject. While the malware, in this case, can’t say whether it is its sample that is being debugged or maybe something else, for some malware writers, it is a red flag anyway. They could use the following APIs to check for its presence:
- NtQueryInformationProcess: With the ProcessDebugObjectHandle (0x1E) argument, it returns the handle to DebugObject if it exists.
- NtQueryObject: With the ObjectAllTypesInformation argument, it can be used to find DebugObject by its name.
Using handles
Here, malware could use the differences in the handle management behavior with and without the debugger attached. For example, the CloseHandle (or NtClose) API can be used to attempt to close an invalid handle. If the debugger is attached, the EXCEPTION_INVALID_HANDLE (0xC0000008) exception will be raised, revealing its presence.
Another less reliable option is to use CreateFile to open the malware’s own file with exclusive access. As some debuggers keep the handle of the analyzed file open, this action could fail under the debugger and, in this way, reveal it.
Using exceptions
Debuggers are designed to intercept various types of exceptions to be able to perform all their functions. Malware can intentionally raise certain exceptions and detect the presence of the debugger if its exception handler (more information about Structured Exception Handling or SEH is discussed next) doesn’t receive control. Examples of this approach can involve the following APIs:
- RaiseException/RtlRaiseException/NtRaiseException can be used to raise debugger-related exceptions such as DBG_CONTROL_C, DBG_CONTROL_BREAK, or DBG_RIPEVENT.
- GenerateConsoleCtrlEvent with the CTRL_C_EVENT or CTRL_BREAK_EVENT arguments can be used to generate Ctrl + C or Ctrl + Break events. If the BeingDebugged flag is set (when the debugger is attached), the system would generate a DBG_CONTROL_C exception (or a DBG_CONTROL_BREAK exception, respectively) that malware might attempt to intercept.
- SetUnhandledExceptionFilter can be used to set a custom function to process unhandled exceptions. If the debugger is attached, it won’t be executed as the control will be passed to the debugger instead.
Using parent processes
One last technique worth mentioning is that processes can detect whether they were created by a debugger by checking the parent process’s name. The Windows operating system sets the process ID and the parent process ID in the process information. Using the parent process ID, you can check whether it was created normally (for example, by using explorer.exe) or whether it was created by a debugger (for example, by detecting the presence of the dbg substring in its name).
There are two common techniques for malware to get the parent process ID, which are listed as follows:
- Looping through the list of running processes using CreateToolhelp32Snapshot, Process32First, and Process32Next (as we saw in Chapter 5, Inspecting Process Injection and API Hooking, with process injection). These APIs not only return the process name and ID but also more information, such as the parent process ID that the malware is looking for.
- Using the NtQueryInformationProcess API. Given ProcessBasicInformation or SystemProcessInformation as an argument, this API will return structures containing the parent process ID in the InheritedFromUniqueProcessId field, as shown in the following screenshot:
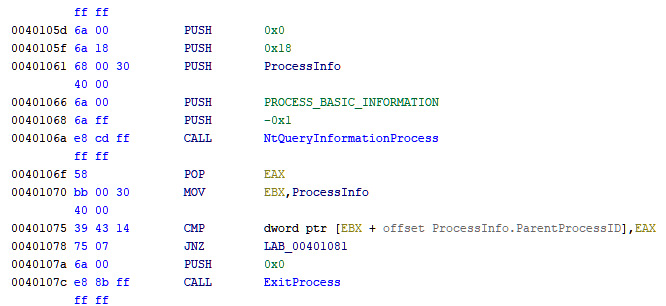
Figure 6.2 – Using NtQueryInfomationProcess to get the parent process
After getting the parent process ID, the next step is to get the process name or the filename to check whether it’s the name of a common debugger or whether it includes any dbg or debug substrings in its name. There are two common ways to get the process name from its ID, as shown in the following list:
- Looping through the processes in the same way to get the parent process ID, but this time, the attackers get the process name by providing the parent process ID that they got earlier.
- Using the GetProcessImageFileNameA API to get the filename of a process given its handle. To get a valid handle, malware would use the OpenProcess API with PROCESS_QUERY_INFORMATION as a required argument.
This API returns the process filename, which can be checked later to detect whether it’s a debugger or not.
Another common way in which the debugging process can be detected by malware is breakpoint detection, so let’s cover this topic in greater detail next.
Handling the evasion of debugger breakpoints
Another way to detect debuggers or evade them is to detect their breakpoints. Whether they are software breakpoints (such as INT3), hardware breakpoints, single-step breakpoints (trap flag), or memory breakpoints, malware can detect them and possibly remove them to escape reverse engineer control.
Detecting software breakpoints (INT3)
This type of breakpoint is the easiest to use and the easiest to detect. As we stated in Chapter 2, A Crash Course in Assembly and Programming Basics, this breakpoint modifies the instruction bytes by replacing the first byte with 0xCC (the INT3 instruction), which creates an exception (an error) that gets delivered to the debugger to handle.
Since it modifies the code in memory, it’s easy to scan the code section in memory for the INT3 byte. A simple scan will look like this:
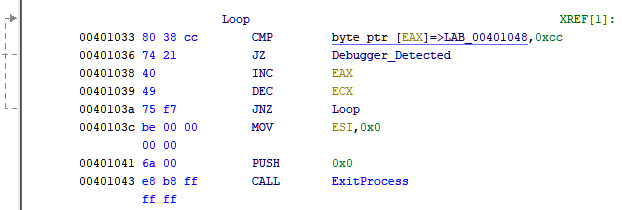
Figure 6.3 – A simple INT3 scan
The only drawback of this approach is that some C++ compilers write INT3 instructions after the end of each function as filler bytes. An INT3 byte (0xCC) can also be found inside some instructions as part of an address or a value, so searching for this byte through the code might not be an effective solution and could return lots of false positives.
There are two other techniques that are commonly used by malware to scan for an INT3 breakpoint, as shown in the following list:
- Pre-calculating a checksum of any kind for the entire code section and recalculating it again in execution mode. If the value has changed, then it means that there are some bytes that have been changed, either by patching or by setting an INT3 breakpoint. Here is an example of how it can be implemented using the rol instruction:
mov esi,<CodeStart>
mov ecx,<CodeSize>
xor eax,eax
ChecksumLoop:
movzx edx,byte [esi]
add eax,edx
rol eax,1
inc esi
loop .checksum_loop
jne <breakpoint_detected>
- Reading the malware sample file and comparing the code section from the file to the memory version of it. If there are any differences between them, this means that the malware has been patched in memory or there is a software breakpoint (INT3) that has been added to the code. This technique is not widely used, as it’s not effective if the malware sample has its relocation table populated (check Chapter 3, Basic Static and Dynamic Analysis for x86/x64, for more information).
The best solution to circumvent software breakpoint detection is to use hardware breakpoints, single-stepping (code tracing), or setting access breakpoints in different places in the code section for any memory read. Once a memory breakpoint on access gets a hit, you can find the checksum calculating code and deal with it by patching the checksum code itself, as you can see in the following screenshot:
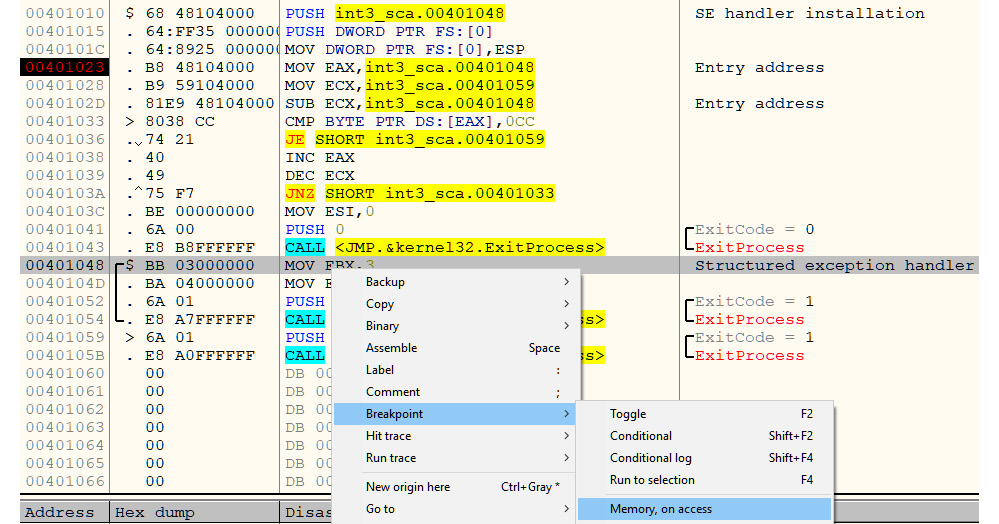
Figure 6.4 – A breakpoint on memory access for the code section to detect an INT3 scanning/checksum calculating loop
In the preceding screenshot, we have set a breakpoint, Memory, on access, in the code section. By executing the program, the application should stop at the 0x00401033 address, as this instruction tried to access the 0x00401048 address where we set our breakpoint. In this manner, we can detect the INT3 scan loop or the checksum calculating loop.
By patching the check at the end of the checksum calculator or jz/jnz with the opposite check, you can easily bypass this technique.
Detecting single-stepping breakpoints using a trap flag
Another type of breakpoint detection technique that is widely used is trap flag detection. When you trace over the instructions one by one, checking the changes they make in memory and on the registers’ values, your debugger sets the trap flag bit (TF) in the EFLAGS register, which is responsible for stopping on the next instruction and returning control back to the debugger.
This flag is not trivial to catch because EFLAGS is not directly readable. It’s only readable through the pushf instruction, which saves this register value in the stack. Since this flag is always set to False after returning to the debugger, it’s hard to check the value of this flag and detect a single-step breakpoint. However, there is a way it can be done.
In the x86 architecture, there are multiple registers that are not widely used nowadays. These registers were used in DOS operating systems before virtual memory in the way we know it was introduced, particularly the segment registers. Apart from the FS register (which you already know about), there are other segment registers, such as CS, which was used to point to the code segment; DS, which was used to point to the data segment; and SS, which was used to point to the stack segment.
The pop SS instruction is quite special. This instruction is used to get a value from the stack and change the stack segment (or address) according to this value. So, if there’s any exception happening while executing this instruction, it could lead to confusion (for instance, which stack would be used to store the exception information?). Therefore, no exceptions or interrupts are allowed while executing this instruction, including any breakpoints or trap flags.
If you are tracing over this instruction, your debugger will move the cursor, skip the next instruction, and jump directly to the instruction after it. That doesn’t mean this skipped instruction wasn’t executed; it was executed but not interrupted by the debugger.
For example, in the following code, your debugger cursor will move from POP SS to MOV EAX, 1, skipping the PUSHFD instruction, even if it was executed:
PUSH SS
POP SS
PUSHFD ; your debugger wouldn't stop on this instruction
MOV EAX, 1 ; your debugger will automatically stop on this instruction.
The trick here is that, in the previous example, the trap flag will remain set while executing the pushfd instruction, but it won’t be allowed to return to the debugger. So, the pushfd instruction will push the EFLAGS register to the stack, including the actual value of the trap flag (if it was set, it will show in the EFLAGS register). Then, it’s easy for malware to check whether the trap flag is set and detect the debugger. An example of this is shown in the following screenshot:
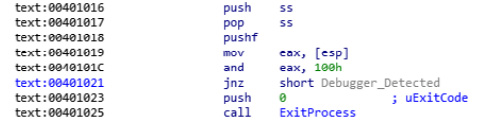
Figure 6.5 – Trap flag detection using the SS register
It is worth mentioning that some debuggers, such as new versions of x64dbg, are aware of this technique and don’t expose the TF bit in this way.
This is a direct way of checking for code tracing or single-stepping. Another way to detect it is by monitoring the time that passed while executing an instruction or a group of instructions, which is what we will talk about in the next section.
Detecting single-stepping using timing techniques
There are multiple ways to get the exact time with millisecond accuracy, from the moment the system is on to the execution of the current instruction. There is an x86 instruction called rdtsc that returns the time in EDX:EAX registers. By calculating the difference between the time before and after executing a certain instruction, any delay will be clearly shown, which represents reverse-engineering tracing through the code. An example of this is shown in the following screenshot:
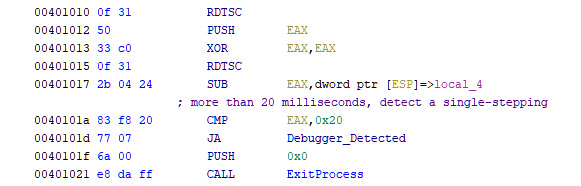
Figure 6.6 – The rdtsc instruction to detect single-stepping
This instruction is not the only way to get the time at any given moment. There are multiple APIs supported by Windows that help programmers get the exact time, which are listed as follows:
- GetLocalTime/GetSystemTime
- GetTickCount
- QueryPerformanceCounter
- timeGetTime/timeGetSystemTime
This technique is widely used and more common than the SS segment register trick. The best solution is to patch the instructions. It’s easy to detect it if you are already stepping through the instructions; you can patch the code or just set the instruction pointer (EIP/RIP) to make it point to the code after the check.
Evading hardware breakpoints
Hardware breakpoints are based on registers that are not accessible in user mode. Therefore, it’s not easy for malware to check these registers and clear them to remove these breakpoints.
For malware to be able to access them, it needs to have them pushed to the stack and pulled out from it again. To do that, many malware families rely on SEH.
What is SEH?
For any program to handle exceptions, Windows provides a mechanism called SEH. This is based on setting a callback function to handle the exception and then resume execution. If this callback failed to handle the exception, it can pass this exception to the previous callback that was set. If the last callback was unable to handle the exception, the operating system terminates the process and informs the user about the unhandled exception, and it often suggests that they send it to the developer company.
A pointer to the first callback to be called is stored in the thread environment block (TEB) and can be accessed via FS:[0x00]. The structure is a linked list, which means that each item in this list contains the address of the callback function and follows the address of the previous item in the list (the previous callback). In the stack, the linked list looks like this:
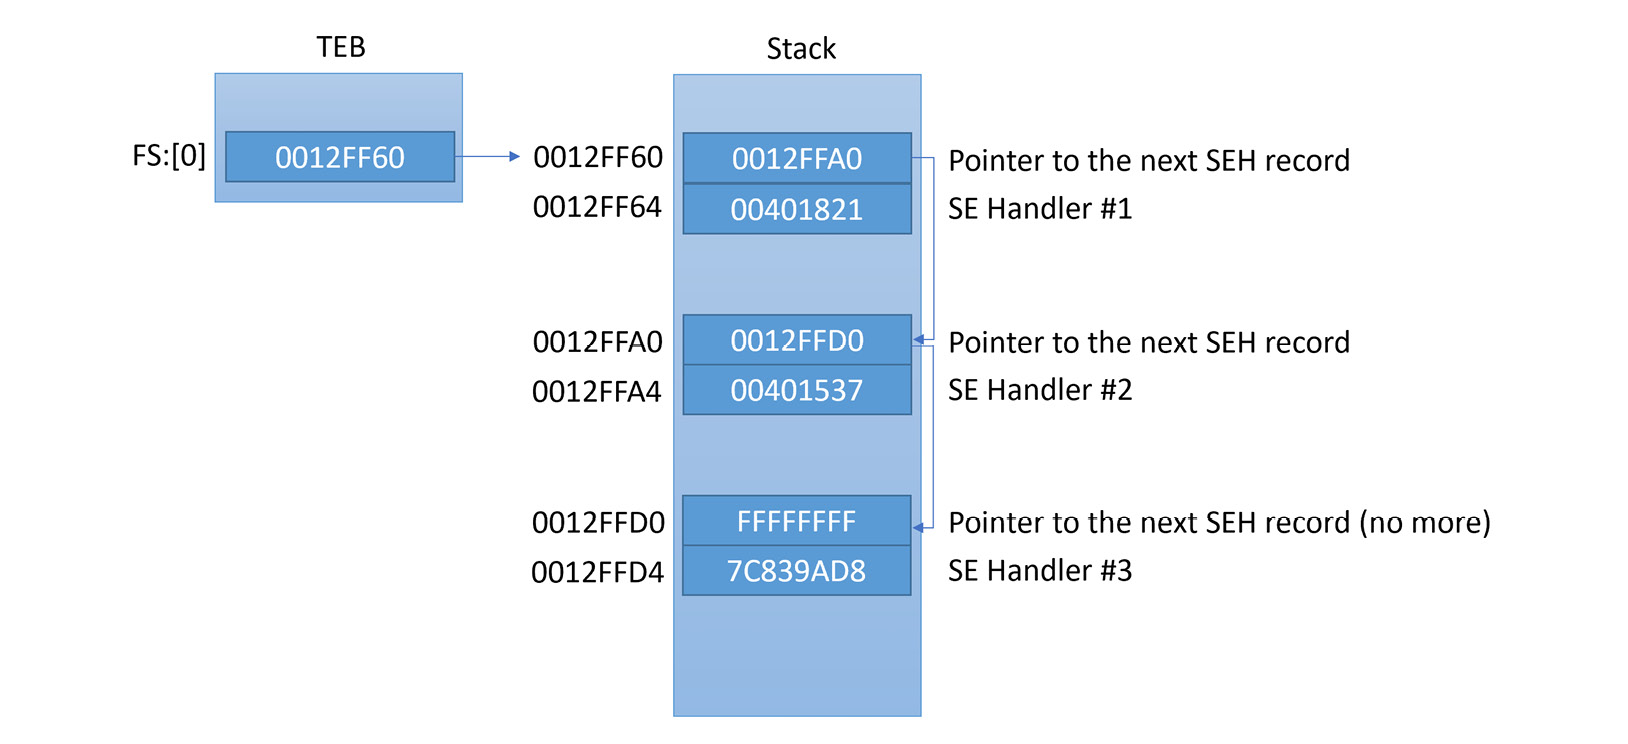
Figure 6.7 – The SEH linked list in the stack
The setup of the SEH callback generally looks like this:
PUSH <callback_func> // Address of the callback function
PUSH FS:[0] // Address of the previous callback item in the list
MOV FS:[0],ESP // Install the new EXCEPTION_REGISTRATION
As you can see, the SEH linked list is mostly saved in the stack. Each item points to the previous one. When an exception occurs, the operating system executes this callback function and passes the necessary information about the exception and the thread state to it (the registers, the instruction pointer, and more). This callback has the ability to modify the registers, the instruction pointer, and the whole thread context. Once the callback returns, the operating system takes the modified thread’s state and registers (which is called the context) and resumes execution based on it. The callback function looks like this:
_cdecl _except_handler(
   struct _EXCEPTION_RECORD *ExceptionRecord,
   void * EstablisherFrame,
   struct _CONTEXT *ContextRecord,
   void * DispatcherContext
);
The important arguments are the following:
- ExceptionRecord: This contains information related to the exception or the error that has been generated. It contains the exception code number, the address, and other information.
- ContextRecord: This is a structure that represents the state of that thread at the time of the exception. It’s a long structure that contains all the registers and other information. A snippet of this structure would look as follows:
struct CONTEXT {
DWORD ContextFlags;
DWORD DR[7];
FLOATING_SAVE_AREA FloatSave;
DWORD SegGs;
DWORD SegFs;
DWORD SegEs;
DWORD SegDs;
DWORD Edi;
....
};
There are multiple ways to detect a debugger using SEH. One of them is by detecting and removing hardware breakpoints.
Detecting hardware breakpoints
To detect or remove hardware breakpoints, malware can use SEH to get the thread context, check the values of the DR registers, and exit if a debugger has been detected. The code is as follows:
xor eax, eax
push offset except_callback
push d fs:[eax]
mov fs:[eax], esp
int 3 ; force an exception to occur
...
except_callback:
mov eax, [esp+0ch] ; get ContextRecord
mov ecx, [eax+4] ; Dr0
or ecx, [eax+8]  ; Dr1
or ecx, [eax+0ch] ; Dr2
or ecx, [eax+10h] ; Dr3
jne <Debugger_Detected>
Another way to detect hardware breakpoints is to use the GetThreadContext API to access the current thread (or another thread) context and check for the presence of hardware breakpoints or clear them using the SetThreadContext API.
The best way to deal with these techniques is to set a breakpoint on GetThreadContext, SetThreadContext, or the exception callback function to make sure they don’t reset or detect your hardware breakpoints.
Memory breakpoints
The last type of breakpoints we will talk about is memory breakpoints. It’s not very common to see techniques targeting them, but they are possible. Memory breakpoints can be easily detected by using the ReadProcessMemory API with the malware’s base as an argument and its image size as the size. ReadProcessMemory will return False if any page inside the malware is guarded (PAGE_GUARD) or set to no-access protection (PAGE_NOACCESS).
For a malware sample to detect a memory breakpoint on write or execute, it can query any memory page protection flags using the VirtualQuery API. Alternatively, it can evade them by using VirtualProtect with the PAGE_EXECUTE_READWRITE argument to overwrite them.
The best way to deal with these anti-debugging tricks is to set breakpoints on all of these APIs and force them to return the desired result to the malware in order to resume normal execution.
Now, it’s time to talk about how malware might attempt to escape the debugger.
Escaping the debugger
Apart from detecting debuggers and removing their breakpoints, there are multiple tricks that malware uses to escape the whole debugging environment altogether. Let’s cover some of the most common tricks.
Process injection
We talked about process injection before, in Chapter 5, Inspecting Process Injection and API Hooking. Process injection is a very well-known technique, not only for man-in-the-browser attacks but also for escaping the debugged process into a process that is not currently debugged. By injecting code into another process, malware can get out of the debugger’s control and execute code before the debugger can attach to it.
A commonly used solution to bypass this trick is to add an infinite loop instruction to the entry point of the injected code before it gets executed. Usually, this is in the injector code either before the WriteProcessMemory call when the code hasn’t been injected yet or before CreateRemoteThread, this time in another process’s memory.
An infinite loop can be created by writing two bytes (0xEB 0xFE) that represent a jmp instruction to itself, as you can see in the following screenshot:

Figure 6.8 – The injected JMP instruction to create an infinite loop
Next, we are going to talk about another popular technique using TLS callbacks. Read on!
TLS callbacks
Many reverse engineers start the debugging phase from the entry point of the malware, which usually makes sense. However, some malicious code can start before the entry point. Some malware families use Thread Local Storage (TLS) to execute code that initializes every thread (which runs before the thread’s actual code starts). This gives the malware the ability to escape the debugging and do some preliminary checks, and maybe even run most of the malicious code this way while having benign code at the entry point.
In the data directory block of the PE header, there is an entry for TLS. It is commonly stored in the .tls section, and its structure looks like this:
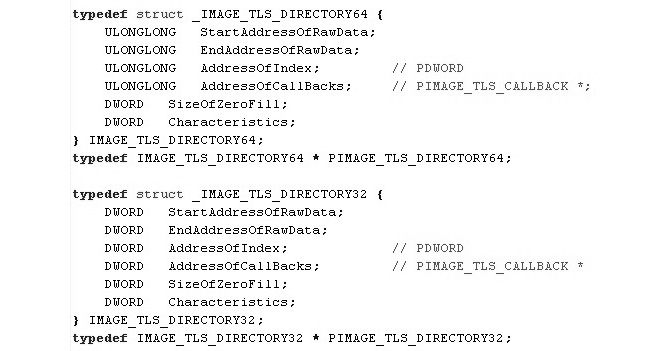
Figure 6.9 – The TLS structure
Here, AddressOfCallBacks points to a null-terminated array (the last element is zero) of callback functions, which are to be called after each other every time a thread has been created. Any malware can set its malicious code to start inside the AddressOfCallBacks array and ensure that this code is executed before the entry point.
A solution for this trick is to check the PE header before debugging the malware and set a breakpoint on every callback function registered inside the AddressOfCallBacks field. In addition, IDA will display them together with the entry point and exported functions (if present).
Windows events callbacks
Another trick used by malware authors to evade the reverse engineer’s single-stepping and breakpoints is by setting callbacks. Callbacks are each called for a specific event (such as a mouse click, keyboard keystroke, or a window moving to the front). If you are single-stepping over the malware instructions, the callback would still be executed without you noticing. In addition, if you are setting breakpoints based on the code flow, it will still bypass your breakpoints.
There are so many ways to set callback functions. Therefore, we will just mention two of them here, as follows:
- Using the RegisterClass API: The RegisterClass API creates a window class that can be used to create a window. This API takes a structure called WNDCLASSA as an argument. The WNDCLASSA structure contains all the necessary information related to this window, including the icon, the cursor icon, the style, and most importantly the callback function to receive window events. The code looks as follows:
MOV DWORD PTR [WndCls.lpfnWndProc], <WindowCallback>
LEA EAX, DWORD PTR SS:[WndCls]
PUSH EAX ; pWndClass
CALL <JMP.&user32.RegisterClassA> ; RegisterClassA
- Using SetWindowLong: Another way to set the window callback is to use SetWindowLong. If you have the window handle (from EnumWindows, FindWindow, or other APIs), you can call the SetWindowLong API to change the window callback function. Here is what this code looks like:
PUSH <WindowCallback>
PUSH GWL_DlgProc
PUSH hWnd ; Window Handle
CALL SetWindowLongA
The best solution for this is to set breakpoints on all the APIs that register callbacks or their callback functions. You can check the malware’s import table, any calls to GetProcAddress, or other functions that dynamically resolve and call APIs.
Attacking the debugger
In some cases, malware might attempt to attack the debugging session. For example, the BlockInput API can be used to block mouse and keyboard events making the attached debugger unusable. Another similar option is to use SwitchDesktop to hide mouse and keyboard events from the debugger.
Speaking of threads, the NtSetInformationThread API with the ThreadHideFromDebugger (0x11) argument can be used to hide the thread from the debugger. Any exceptions taking place in the hidden thread including triggered breakpoints won’t be intercepted by the debugger making the program crash instead. Finally, the SuspendThread/NtSuspendThread API can be used by malware against the debugger’s thread itself.
These are some of the most common ways how malware might attempt to affect the debugging process itself. Next, let’s talk about various types of obfuscation.
Understanding obfuscation and anti-disassemblers
Dissemblers are one of the most common tools that are used in reverse engineering, and so they are actively targeted by malware authors. Now, we will take a look at the different techniques that are used in malware to obfuscate its code and make it harder for reverse engineers to analyze it.
Encryption
Encryption is the most common technique as it also protects malware from static antivirus signatures. Malware can encrypt its own code and have a small piece of stub code to decrypt the malicious code before executing it. Additionally, the malware can encrypt its own data, such as strings including API names or the whole configuration block.
Dealing with encryption is not always easy. One solution is to execute the malware and dump the memory after it has been decrypted. For example, many sandboxes can now make process dumps of the monitored processes, which could help you get the malware in the decrypted form.
But for cases such as encrypting strings and decrypting each string on demand, you will need to reverse the encryption algorithm and write a script to go through all the calls to the decryption function and use its parameters to decrypt the strings. You can check out Chapter 4, Unpacking, Decryption, and Deobfuscation, for more information on how to handle encryption and write such scripts.
Junk code
Another well-known technique that’s used in many samples and that became increasingly popular in the late 1990s and early 2000s is junk code insertion. With this technique, the malware author inserts lots of code that never gets executed. For example, the code can be placed after unconditional jumps, calls that never return, or conditional jumps with conditions that would never be met. The main goal of this code is to waste the reverse engineer’s time analyzing useless code or make the code graph look more complicated than it actually is.
Another similar technique is to insert ineffective code. This ineffective code could be something such as nop, push and pop, inc and dec, or repetition of the same instruction. A combination of these instructions could look like real code; however, the same operation in reality would be encoded much simpler, as you can see in the following screenshot:

Figure 6.10 – Pointless junk code
There are different forms of this junk code, including the expansion of an instruction; for example, inc edx becomes add edx, 3 and sub edx, 2, and so on. This way, it is possible to obfuscate the actual values, such as 0x5a4D (MZ) or any other values that could represent specific functionality for this subroutine.
This technique has been around since the 1990s in metamorphic engines, but it’s still used by some families to obfuscate their code.
It is worth mentioning that while strings stored in local variables are more complicated to analyze, the following is not an example of such a technique but a legitimate compiler’s behavior:

Figure 6.11 – A string stored in local variables
Now, let’s talk about the code transportation technique.
Code transportation
Another trick that’s commonly used by malware authors is code transportation. This technique doesn’t insert junk code; instead, it rearranges the code inside each subroutine with lots of unconditional jumps, including call + pop or conditional jumps that are always true or false.
It makes the function graph look as though it is very complicated to analyze and wastes the reverse engineer’s time. An example of such code can be seen in the following screenshot:
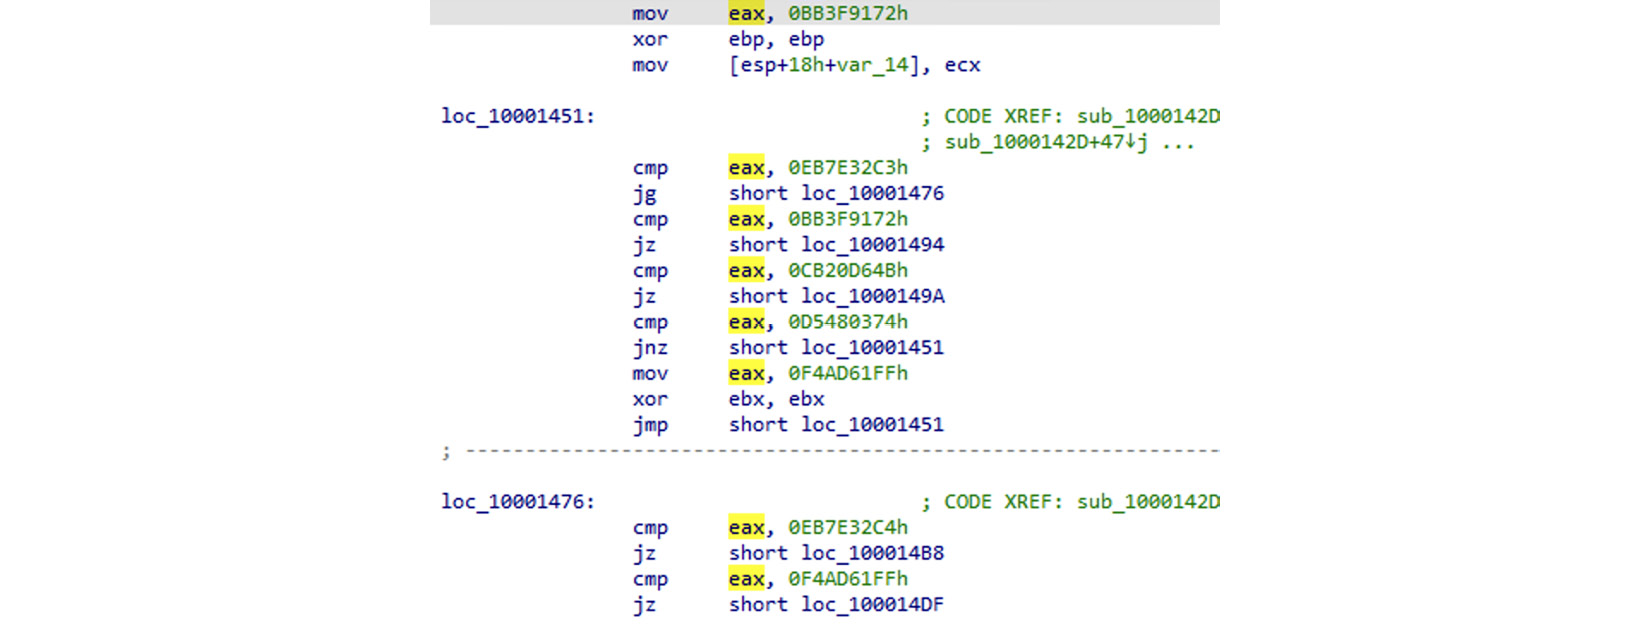
Figure 6.12 – Code transportation with unconditional jumps
There is a more complicated form of this where malware rearranges the code of each subroutine in the middle of the other subroutines. This form makes it harder for the disassembler to connect each subroutine, as it makes it miss the ret instruction at the end of the function and then not consider it as a function.
Some other malware families don’t put a ret instruction at the end of the subroutine and, instead, substitute it with pop and jmp to hide this subroutine from the disassembler. These are just some of the many forms of code transportation and junk code insertion techniques.
Dynamic API calling with checksum
Dynamic API calling is a famous anti-disassembling trick used by many malware families. The main reason behind using it is that, in this way, they hide API names from static analysis tools and make it harder to understand what each function inside the malware does.
For a malware author to implement this trick, they need to pre-calculate a checksum for this API name and push this value, as an argument, to a function that scans export tables of different libraries and searches for an API by this checksum. An example of this is shown in the following screenshot:
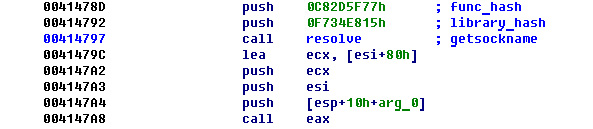
Figure 6.13 – Library and API names’ checksums (hash)
The code for resolving the function actually goes through the PE header of the library, loops through the export table, and calculates the checksum of each API to compare it with the given checksum (or hash) that’s provided as an argument.
The solution to this approach could require scripting to loop through all known API names and calculate their checksums. Alternatively, it could require executing this function multiple times, giving each checksum as input and saving the equivalent API name for it.
Proxy functions and proxy argument stacking
The Nymaim banking trojan took anti-disassembling to another level by adding additional techniques, such as proxy functions and proxy argument stacking.
With the proxy functions technique, malware doesn’t directly call the required function; instead, it calls a proxy function that calculates the address of the required function and transfers the execution there. Nymaim included more than 100 different proxy functions with different algorithms (four or five algorithms in total). The proxy function call looks like this:

Figure 6.14 – The proxy function arguments used to calculate the function address
The proxy function code itself looks like this:
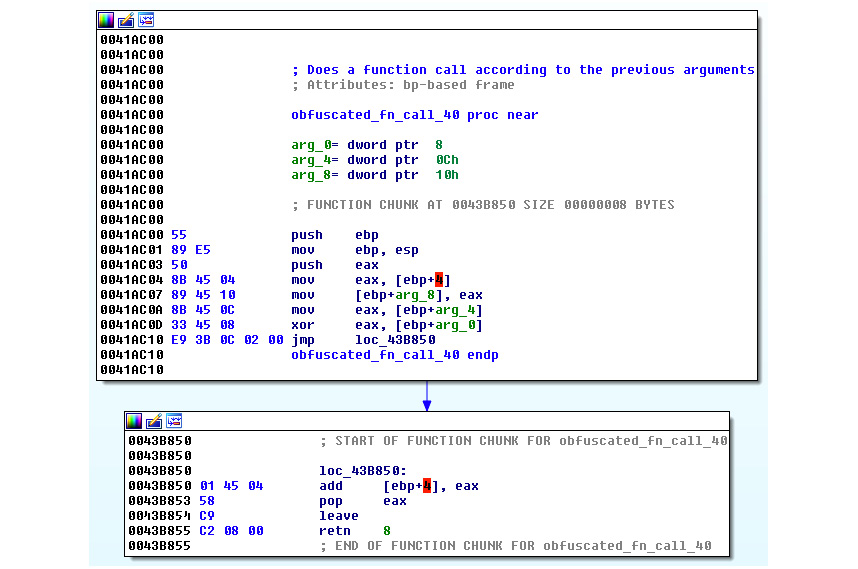
Figure 6.15 – The Nymaim proxy function
For arguments, Nymaim uses a function to push arguments to the stack rather than just using the push instruction. This trick could prevent the disassembler from recognizing the arguments that were given to each function or API. An example of proxy argument stacking is as follows:

Figure 6.16 – The proxy argument stacking technique in Nymaim
This malware included many different forms of the techniques that we introduced in this section. So, as long as the main idea is clear, you should be able to understand all of them.
Using the COM functionality
Instead of hiding APIs by dynamically resolving their names using hashes, malware might attempt to achieve the same result using different technologies. A good example would be using the Wscript.Shell COM object’s functionality to execute a program instead of calling APIs such as CreateProcess, ShellExecute, or WinExec, which would immediately draw the researcher’s attention. To create its object, malware can use the CoCreateInstance API specifying the required object’s class in the form of the IID, as you can see in the following screenshot:
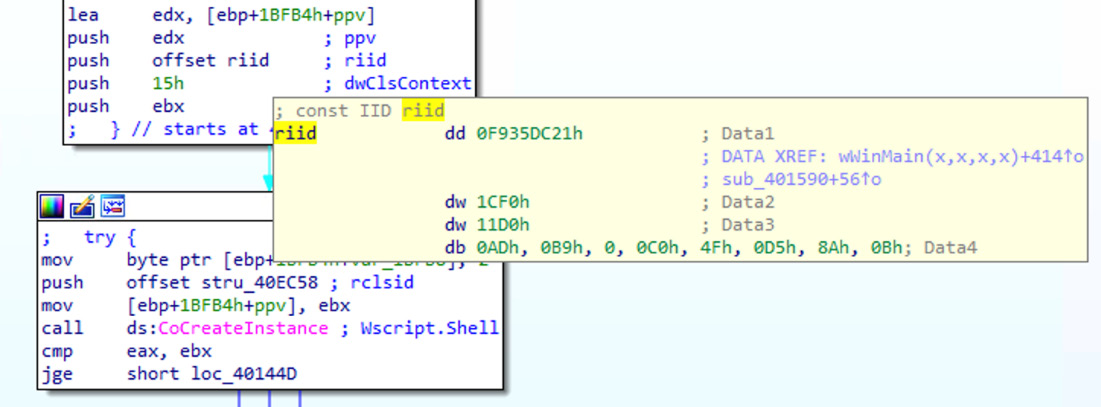
Figure 6.17 – Creating an instance of the Wscript.Shell object by its IID, F935DC21-1CF0-11d0-ADB9-00C04FD58A0B
After this, the actual method will be accessed by its offset. To figure out the method’s name by its offset, you can use the COMView tool:
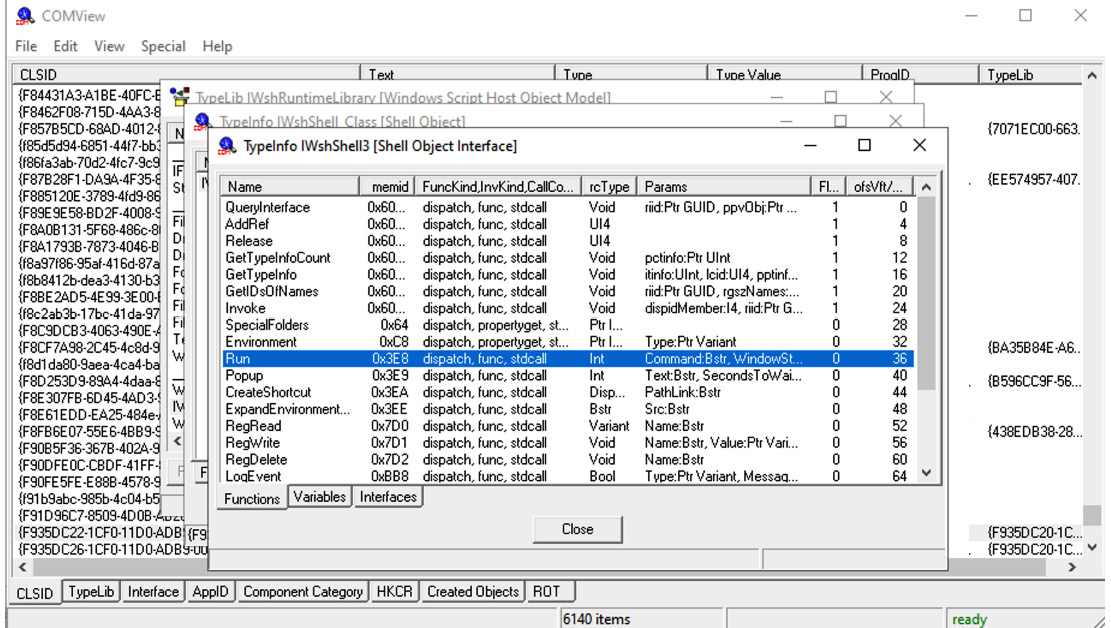
Figure 6.18 – Finding the name of the method of the COM object by its offset found in assembly
As you can see here, the Run method of the Wscript.Shell class would be accessed by its offset of 36 (0x24).
As we can see, obfuscation can take various forms, so the more examples you are aware of, the less time it will take to find the right approach to handle it. Now, it is time to learn how behavioral analysis tools can be detected using malware.
Detecting and evading behavioral analysis tools
There are multiple ways in which malware can detect and evade behavioral analysis tools, such as ProcMon, Wireshark, API Monitor, and more, even if they don’t directly debug the malware or interact with it. In this section, we will talk about two common examples of how it can be done.
Finding the tool process
One of the simplest and most common ways that malware can deal with malware-analysis tools (and antivirus tools, too) is to loop through all the running processes and detect any unwanted entries. Then, it is possible to either terminate or stop them to avoid further analysis.
In Chapter 5, Inspecting Process Injection and API Hooking, we covered how malware can loop through all running processes using the CreateToolhelp32Snapshot, Process32First, and Process32Next APIs. In this anti-reverse engineering trick, the malware uses these APIs in exactly the same way to check the process name against a list of unwanted process names or their hashes. If there’s a match, the malware terminates itself or uses an approach such as calling the TerminateProcess API to kill that process. The following screenshot shows an example of this trick being implemented in Gozi malware:
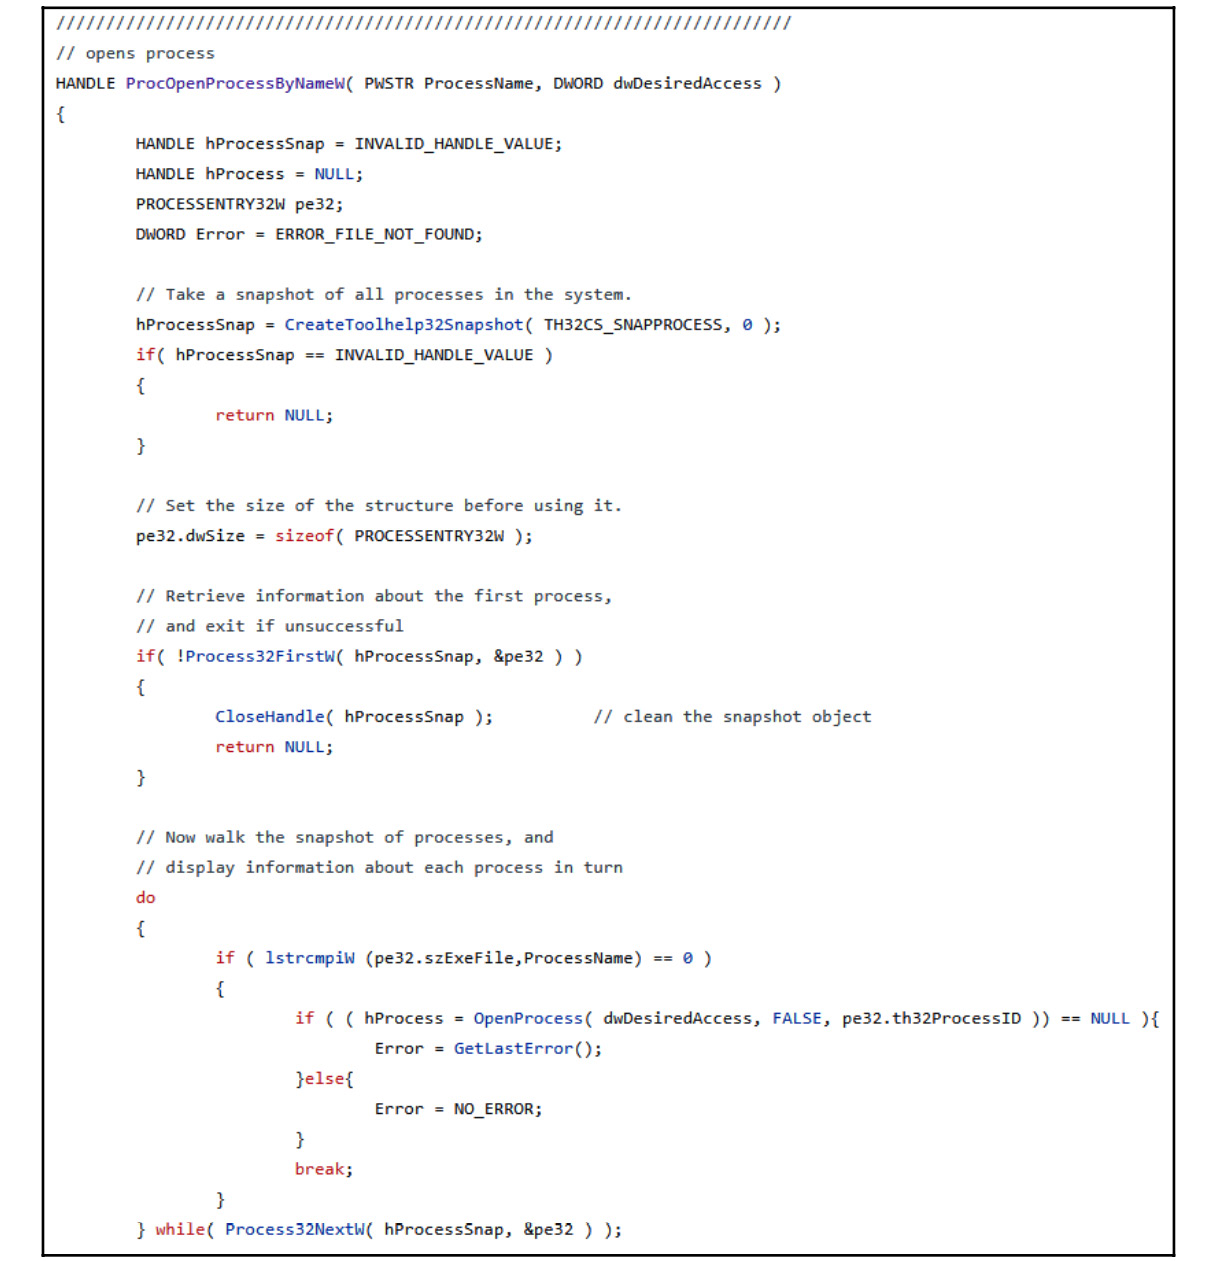
Figure 6.19 – Gozi malware looping through all of the running processes
The following screenshot shows an example of Gozi malware code using the TerminateProcess API to kill a process of its choice found by its name in a custom ProcOpenProcessByNameW routine:
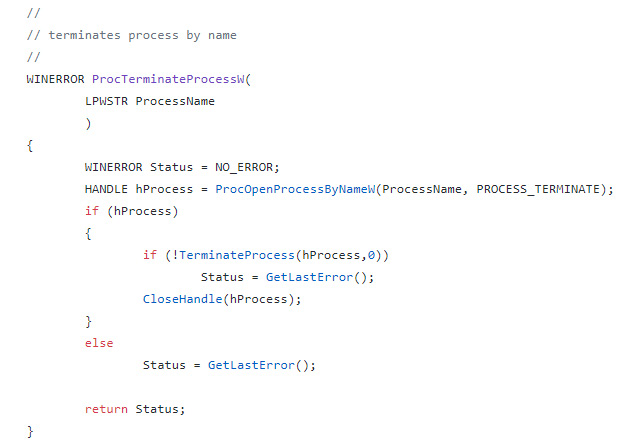
Figure 6.20 – Gozi malware terminating a process with the help of the ProcOpenProcessByNameW function
This trick can be bypassed by renaming the tools you are using before executing them. This simple solution could hide your tools perfectly if you just avoid using any known keywords in the newer names, such as dbg, disassembler, AV, and more.
Searching for the tool window
Another trick would be not to search for the tool’s process name, but to search for its window name (the window’s title) instead. By searching for a program window name, malware can bypass any renaming that could be performed on the process name, which gives it an opportunity to detect new tools, too (for the most part, window names are more descriptive than process names).
This trick can be carried out in the following two ways:
- Using FindWindow: Malware can use either the full window title, such as Microsoft network monitor, or the window class name. The window class name is a name that was given to this window when it was created, and it’s different from the title that appears on the window. For example, the OllyDbg window class name is OLLYDBG, while the full title could change based on the process name of the malware under analysis. An example of this is as follows:
push NULL
push .szWindowClassOllyDbg
call FindWindowA
test eax,eax
jnz <debugger_found>
push NULL
push .szWindowClassWinDbg
call FindWindowA
test eax,eax
jnz <debugger_found>
.szWindowClassOllyDbg db "OLLYDBG",0
.szWindowClassWinDbg db "WinDbgFrameClass",0
- Using EnumWindows: Another way to avoid searching for the window class name or dealing with the change of window titles is to just go through all the window names that are accessible and scan their titles, searching for suspicious window names such as Debugger, Wireshark, Disassembler, and more. This is a more flexible way to deal with new tools or tools the malware author forgot to cover. With the EnumWindows API, you need to set a callback to receive all of the windows.
For each top-level window, this callback will receive the handle of this window, from which it can get its name using the GetWindowText API. An example of this is as follows:
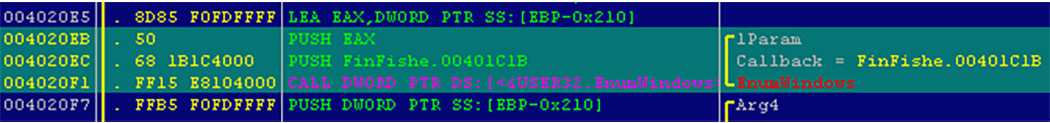
Figure 6.21 – The FinFisher threat using EnumWindows to set its callback function
The callback function declaration looks like this:
BOOL CALLBACK EnumWindowsProc(
_In_ HWND hwnd,
_In_ LPARAM lParam);
The hwnd value is the handle of the window, while lParam is a user-defined argument (it’s passed by the user to the callback function). Malware can use the GetWindowText API with this handle (hwnd) to get the window title and scan it against a predefined list of keywords.
It’s more complicated to modify window titles or classes than actually set breakpoints on these APIs and track the callback function to bypass them. There are plugins for popular tools, such as OllyDbg and IDA, that can help rename their title window to avoid detection (such as OllyAdvanced), which you can also use as a solution.
Now we know how behavioral analysis tools can be detected, let’s learn about sandbox and VM detection.
Detecting sandboxes and VMs
Malware authors know that if their malware sample is running on a VM, then it’s probably being analyzed by a reverse engineer or it’s probably running under the analysis of an automated tool such as a sandbox. There are multiple ways in which malware authors can detect VMs and sandboxes. Let’s go over some of them now.
Different output between VMs and real machines
Malware authors could use certain unique characteristics of some assembly instructions when executed on VMs. Some examples of these are listed as follows:
- CPUID hypervisor bit: The CPUID instruction returns information about the CPU and provides a leaf/ID of this information in eax. For leaf 0x01 (eax = 1), the CPUID instruction sets bit 31 to 1, indicating that the operating system is running inside a VM or a hypervisor.
- Virtualization brand: With the CPUID instruction, given eax = 0x40000000, it could return the name of the virtualization tool (if present) in the EBX, ECX, and EDX registers as if they comprised a single string. Examples of such name strings include VMwareVMware, Microsoft Hv, VBoxVBoxVBox, and XenVMMXenVMM.
- MMX registers: MMX registers are a set of registers that were introduced by Intel that help speed up graphics calculations. While rare, some virtualization tools don’t support them. Some malware or packers use them for unpacking in order to detect or avoid running on a VM.
- Hypervisor I/O port: The IN instruction, when executed on the VMware VM with a port argument set to 0x5658 (which stands for VX in ASCII, a VMware hypervisor port) and with the EAX value equal to 0x564D5868 (the VMXh magic value), will return the same magic value of VMXh in the EBX register, this way revealing the presence of the VM.
Detecting virtualization processes and services
Virtualization software commonly installs some tools on the guest machine to enable clipboard synchronization, drag and drop, mouse synchronization, and other useful features. These tools can be easily detected by scanning for these processes using the CreateToolhelp32Snapshot, Process32First, and Process32Next APIs. Some of these processes are listed as follows:
- VMware:
- vmacthlp.exe
- VMwareUser.exe
- VMwareService.exe
- VMwareTray.exe
- VirtualBox:
- VBoxService.exe
- VBoxTray.exe
The same approach can be used to search for particular files or directories on the filesystem.
Detecting virtualization through registry keys
There are multiple registry keys that can be used to detect virtualization environments. Some of them are related to the hard disk name (which is, usually, named after the virtualization software), the installed virtualization sync tools, or other settings in the virtualization process. Some of these registry entries are as follows:
HKEY_LOCAL_MACHINESOFTWAREVmware Inc.Vmware Tools
HKEY_LOCAL_MACHINESOFTWAREOracleVirtualBox Guest Additions
HKEY_LOCAL_MACHINEHARDWAREACPIDSDTVBOX
Detecting VMs using WMI
It’s not just registry values that reveal lots of information about the virtualization software—Windows-managed information, which is accessible using, for example, PowerShell, can also be used, as shown in the following screenshot:
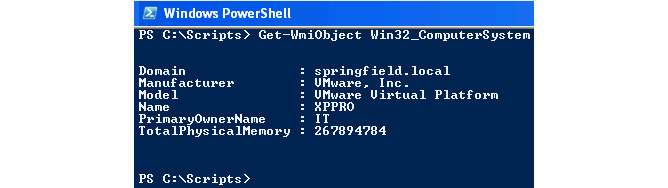
Figure 6.22 – The PowerShell command to detect VMWare
This information can be accessed through a WMI query, such as the following:
SELECT * FROM Win32_ComputerSystem WHERE Manufacturer LIKE "%VMware%" AND Model LIKE "%VMware Virtual Platform%"
For Microsoft Hyper-V, it would be as follows:
SELECT * FROM Win32_ComputerSystem WHERE Manufacturer LIKE "%Microsoft Corporation%" AND Model LIKE "%Virtual Machine%"
These techniques make it harder to hide the fact that this malware is running inside virtualization software and not on a real machine.
Other VM detection techniques
There are lots of other techniques that malware families can use to detect virtualized environments, such as the following:
- Named pipes and devices, for example, \.pipeVBoxTrayIPC
- Window titles or class names, such as VBoxTrayToolWndClass or VBoxTrayToolWnd
- The first part of the MAC address on their network adapter:
- 00:1C:14, 00:50:56, 00:05:69, 00:0C:29 – VMWare
- 08:00:27 – VirtualBox
- 00:03:FF – Hyper-V
The preceding list can be further expanded with many similar techniques and approaches for detecting a virtualized environment.
Detecting sandboxes using default settings
Sandboxes can also be easy to detect. They have lots of default settings that malware authors can use to identify them:
- The usernames could be default values, such as cuckoo or user.
- The filesystem could include the same decoy files and the same structure of the files (if not, then the same number of files). Even the name of the sample itself can always be the same, such as sample.exe.
These settings can be easily detected for commonly used sandboxes, without even looking at their known tools and processes.
Apart from that, sandboxes are commonly detected by the following characteristics:
- Too weak system hardware (mainly disk space and RAM)
- Unusual system settings (very low screen resolution or no software installed)
- No user interaction (lack of mouse moves or recent file modifications)
One more common way to evade sandboxes is to avoid performing malicious activities in their analysis time window. In many cases, sandboxes execute malware only for several seconds or minutes and then collect the necessary information before terminating the VM. Some malware families use APIs such as Sleep or perform long calculations to delay the execution for quite some time or run it after a machine restart. This trick can help malware evade sandboxes and ensure that they don’t collect important information, such as C&C domains or malware-persistence techniques.
These are some of the most common sandbox detection techniques. It is worth mentioning that malware developers keep inventing more and more novel approaches to achieve this goal, so staying on top of them requires constant learning and practice.
Summary
In this chapter, we covered many tricks that malware authors use to detect and evade reverse engineering, from detecting the debugger and its breakpoints to detecting VMs and sandboxes, as well as incorporating obfuscation and debugger-escaping techniques. You should now be able to analyze more advanced malware equipped with multiple anti-debugging or anti-VM tricks. Additionally, you will be able to analyze a highly obfuscated malware implementing lots of anti-disassembling tricks.
In Chapter 7, Understanding Kernel-Mode Rootkits, we are going to enter the operating system’s core. We are going to cover the kernel mode and learn how each API call and operation works internally in the Windows operating system, as well as how rootkits can hook each of these steps to hide malicious activity from antivirus products and the user’s eyes.