
When debugging applications, we are often interested in the scope at given times while our code is running. Some of the tools given to debug applications are actually session debugging modules. We saw the modules, ServiceNow classes as application debugging, along with others, in the session debugging section. These are:
- Debug business rules
- Debug business rules (details)
- Debug security
- Debug scopes
Business rules and security can be useful whether we are in an application or not, but the scope is very important for application coding. To show how debugging the scope works, we can create a test application, and a business rule for that application, in the application scope.
Once the application and the business rule have been created, we need to click the debug scopes and debug business rules modules in the session debugging. As an example, we can see this when updating an incident in the session debug logging.
We can see this in Figure 9.11:
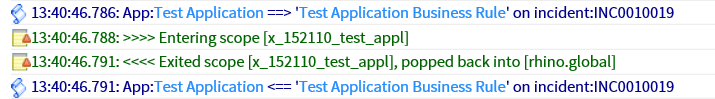
We can see in the logging that, as we enter the business rule from our test application, we also enter the scope of our test application. Once the business rule has completed executing, we revert back to the global scope.
As we saw in Chapter 5, Introduction to Server-Side Scripting, when we debug using GlideSystem in an application, we need to remember that gs.log will not work. For debugging in an application, we need to use four scoped application logging levels.
To recap, these scoped application logging levels are:
- Error
- Warn
- Info
- Debug
These logging levels and their levels of verbosity are helpful to log messages to the system logs when checking values during a script.
We can also enable session debugging for a particular application. This can be enabled from the application page for the related links. Scripts from the application will generate logs to the system log if they use the GlideSystem logging method.
We can see this in Figure 9.12:
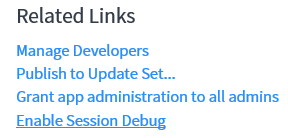
To enable session debugging, the Related Links needs to be clicked. The related link will change and show as disable session debug while the debugging is active. It can be selected again to disable session debugging.