
Chapter 5
Managing Management Packs
Up to this point you have put in place the management server, database, and agents. You have configured them so that they are ready to monitor each of your servers. Global settings are in place, and specialized settings for unique systems have been configured. Now you need to tell the agents what they are supposed to start looking for and how they are to react when certain criteria arise.
In the past, monitoring meant that you would check a service periodically to see if it was running. When it failed, you could be notified by the operating system, or you could have it automatically restart. Windows Server 2000 and later versions have the ability to restart services or even force the operating system to reboot if a critical service is not running. That type of monitoring gives you limited control over your systems.
Watching for a service to be in a running or failed state is rudimentary and reactive. To move toward proactive management, you must watch how the services and systems are running, looking at the health of each to determine whether problems are starting to arise. Operations Manager takes monitoring to the proactive side by looking at each of the services and the components that make up that service, watching to see how they are running. When services and applications can be monitored for their health, you have the ability to recognize which systems are starting to have problems, and you can rectify the situation before you have a serious issue.
Management packs let you fine-tune your monitoring. If you take a look at a management pack, you will find several rules that can be used to start collecting information about a managed system. However, some of the settings are turned off so that you don’t have too much information being collected. “Noisy” rules can quickly fill up your database with unnecessary information and consume network bandwidth as well as system resources.
In this chapter, you will learn to:
- Identify management pack formats
- Work with discovery rules
- Create groups based on discovery
- Create monitors
- Create rules
Understanding Monitoring Capabilities
Operations Manager provides two monitoring options: agentless monitoring and agent-managed monitoring. In an agentless scenario, the management server is responsible for checking on a server to see how it is performing. Using this method, you can watch some of the processes and services, but you are limited by what you can collect. Also, without having an agent on a system, you cannot monitor systems that reside on the far side of a firewall. Doing so would mean that you would have to open up too many ports in your firewall to allow RPC communication to slide through. Doing so would negate the firewall’s effectiveness.
Agent-managed monitoring is the more effective method. Agents running on each system have the ability to look at more parts of the system. The agent is able to parse through your event log files, view application log files, dig into the Windows Management Instrumentation (WMI) database, and monitor services at their lowest level. Using the agent, you can monitor nearly every aspect of the servers and workstations in your organization.
Now you are probably wondering why you would ever want to perform agentless management. Honestly, in most scenarios you won’t. But there are times when you may have to. Some companies are still supporting servers running nonsupported operating systems, such as Windows NT 4 and Windows 2000. Even though the support life cycle has officially ended for NT 4 and Windows 2000, some administrators are still stuck supporting those servers for reasons beyond their control. Sometimes it may be a budgeting issue; other times it may be a critical business application that is not supported on another platform. And many times, getting rid of some of these older systems is easier said than done.
Another instance in which you may need to perform agentless management is when you cannot install the agent because of hardware limitations. You should always test installing the agent on a nonproduction system to make sure there are no conflicts when it runs in conjunction with other software. If the problem is not software compatibility but hardware limitations, you can perform agentless monitoring until you improve your hardware to support running the agent.
No matter which type of monitoring you end up using, the monitoring criteria come from the management packs installed on the management server. If the management server is the heart of your monitoring solution, then the management pack is the lifeblood. Without the management packs, the agents and management servers cannot do their job. You could still install agents, but they would not be monitoring much, except for a base level included with the default management packs.
Identifying Management Pack Requirements
If you were to simply install Operations Manager and configure the settings necessary to install the agent on the systems you would like to monitor and then do nothing else, you’d find that Operations Manager would start monitoring the Operations Manager agents on those systems. By default, a core set of management packs is installed and made available as soon as the software is installed. You will notice that you do not get every management pack available. This ensures you will go out and download the latest version of the available management packs. You must choose exactly which management packs will be used in your environment, going so far as deciding which ones will be installed in each of your management groups. It only makes sense that you do not want to import the Exchange management packs into your management group if they will not be used. At the same time, you want to make sure that you install only the management packs that are necessary, because the discovery rules that are configured for each management pack will still reach out and try to determine whether systems are available for it to monitor.
When you are importing the management packs, make sure that you know all of the management packs that are required, as well as the parent management packs that they rely on. The management pack import wizard will check for such dependencies. Usually you will have documentation that ships with the management pack that will inform you of the requirements. Make sure you read the management pack guides and follow any instructions that are included.
Current Management Packs Available
Management packs come in several flavors. You can pick the ones you like the best and ignore the rest. In other words, you can install the management packs that you need to use in order to support the applications, servers, and hardware in your organization—you don’t have to install every management pack that is available. If fact, you really don’t want to. The more management packs you install, the more space you take up in the database and the more cluttered your reporting solution becomes. Determine which applications, servers, and hardware you would like to monitor and then obtain the management packs to support them.
A number of vendors are supplying management packs for their products. In a number of cases, third-party management pack builders and community members are creating management packs to monitor different products, and many of them are free. Microsoft’s philosophy is that they will ship a management pack for every server product they release within a certain time after its release. In some cases the management packs are finished at the same time the product ships.
As we mentioned, Microsoft has determined that all of their server products, such as Exchange, SQL Server, and SharePoint, as well as their workstation operating systems will have a management pack available after they are released. Exchange Server 2007/2010, System Center Configuration Manager 2007/2012, SQL Server 2005/2008/2012, and many others are supported. Other vendors are also supplying management packs for their products so that you can monitor them using a single solution.
You can find the management packs that are currently available by going to the System Center Marketplace for Operations Manager, shown in Figure 5.1, at http://systemcenter.pinpoint.microsoft.com/en-US/applications/search/operations-manager-d11
Figure 5.1 Microsoft’s System Center Marketplace management pack search site
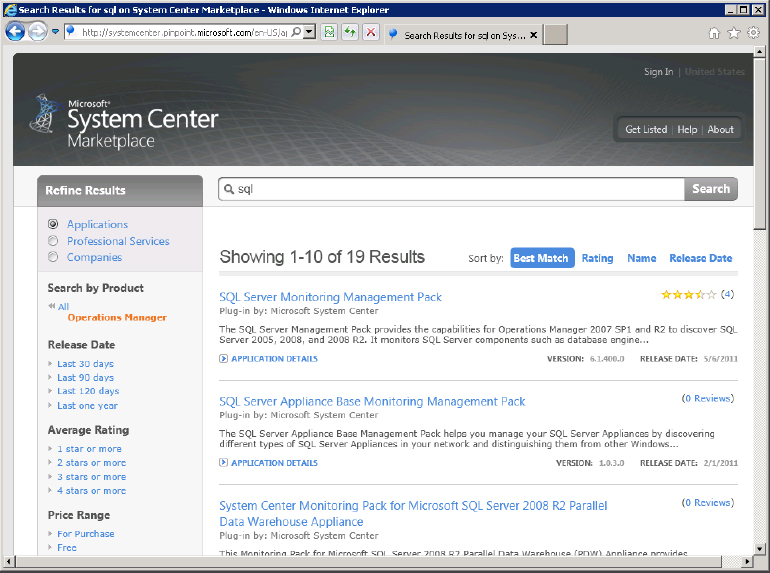
Here you are able to search for management packs or view a complete listing. Using this website, you can determine whether the application that you plan to implement currently has management packs supported by Operations Manager. Many vendors realize that organizations may be making decisions based on an end-to-end solution that includes support for monitoring using their monitoring solution. This marketplace does not contain a listing of each and every management pack out there, as external parties will have to submit their management pack solutions to this list.
Requirements for Management Pack Monitoring
Implementing a management pack involves importing the management pack and all of the parent management packs. Management packs within Operations Manager take advantage of inheriting settings from other management packs so that not much duplication occurs. Another advantage is that the management packs can be smaller, more compact units, or they can be created to alter the initial settings of a parent management pack.
The base management packs that have been made available for Operations Manager are made up of several elements. In some cases, the elements are not configured to be used in the Operations Console; instead, the elements are defined within the base management pack, only to be used by other management packs that inherit the settings. These are, for instance, library management packs, which contain definitions of what will be monitored, like Windows Server or SQL Database. These are first defined and discovered, and in the next step monitors and rules will be defined that target these for monitoring. They can also be defined only once and used in the monitoring management packs. In an increasing number of cases, these management packs are split between library management packs and monitoring management packs, where the monitoring management pack depends on the library.
One case in point is the SQL Server management pack. When you decide to import the SQL Server 2008 management pack, you will find that you need to import not only the Microsoft SQL Server 2008 Discovery and Microsoft SQL Server 2008 Monitoring management packs, but also the SQL Server Core Library management pack. Common elements are defined within the library that can be used with SQL Server 2005 as well as SQL Server 2008 management packs. Unique configuration details are then defined within the monitoring management packs for the two separate products.
In Figure 5.2, a number of the management packs that are installed in the management group are shown. The management packs that are installed by default are there to monitor Operations Manager or to support other management packs.
Figure 5.2 Management packs included with the installation
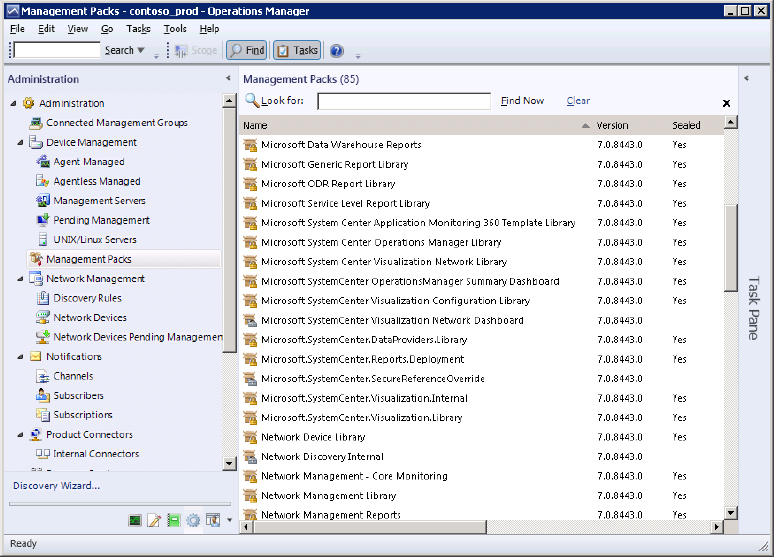
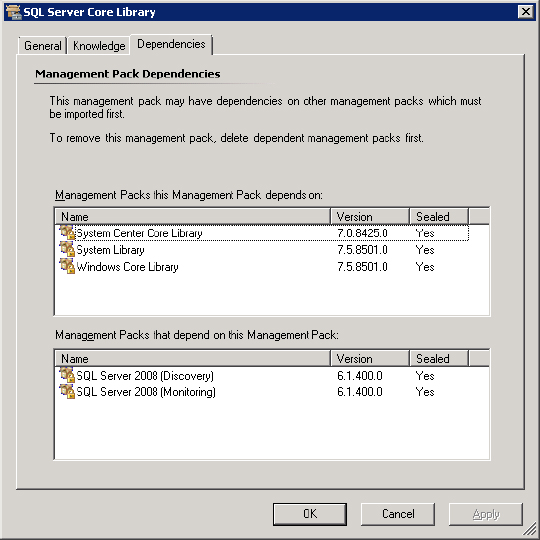
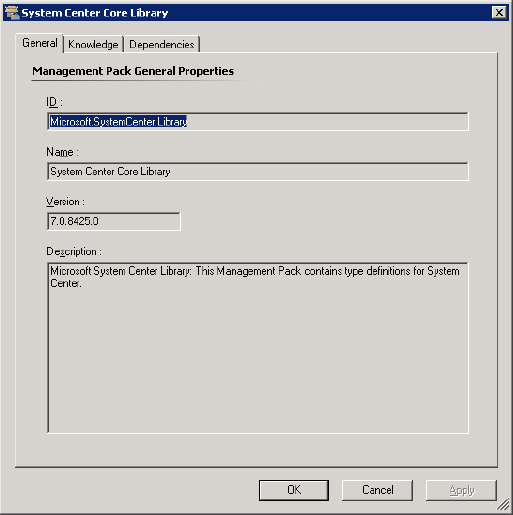
Most of these base management packs are called libraries because they contain the initial building blocks for most of the other management packs that you will use. As with the SQL example earlier, you will find that the Windows core library is included in this collection of management packs. Once defined, the object setting within these libraries will not have to be redefined in other management packs. Instead, the settings can simply be referenced from these libraries and the monitoring criteria can be set. If you open the properties of a management pack and select the Dependencies tab, these references become clear. In Figure 5.3, the properties of the SQL Server Core Library are shown. You can see that this management pack depends on some of the other core libraries, such as the Windows Core Library, and that the SQL Server 2008 Discovery and Monitoring management packs depend on this management pack.
Figure 5.3 Management pack dependencies
Exploring Management Packs
Management packs have matured since their introduction in Microsoft Operations Manager 2000. Originally, management packs were a set of instructions that controlled how the agent would perform on a client. In Operations Manager 2007 and higher, management packs are now XML-based files. This makes the management pack easy to work with, as well as standardized in the same format that Microsoft is using for many of its applications and servers. If you have worked with other applications that take advantage of XML, you should have no problem bringing that knowledge to Operations Manager.
When using XML files, you need to have a definition, or schema, for the configuration files. The schema defines how the system uses the entries within the XML files. Every management pack is written based on the same schema definitions. Typically you do not need to worry about directly editing a management pack, so it is not vitally important that you learn how to work with XML files, unless you want to author management packs or delve into deeper troubleshooting.
We have alluded to the fact that developers are creating management packs for their own products. Usually they will take the time to optimize their product on systems of their own. They then build the management pack so that the settings contained within are already configured to what they feel are the optimal settings. They will then take the process one step further and seal the management pack so that you cannot directly change the settings. If you try to “open” a sealed management pack, you will find that it does not look anything like an XML file. Sealing the management pack in this manner protects the management pack from direct editing and makes it possible for other management packs to reference the items inside it. But don’t worry; you can make changes to the management group so that the agents actually work the way you want them to by using overrides. This is something that we will discuss later.
Discovery
Discovery is the process of finding systems, services, and objects to monitor. Think of a discovery as a means of determining what will be monitored. Every management pack has discovery rules defined that, once imported, will seek out the object types the discovery method identifies. Back in Chapter 4, “Installing and Configuring Agents,” you performed one form of discovery to find systems on which you installed agents. When you started the Discovery Wizard, you provided information on which systems you wanted to locate in order to install the agent. Once you completed the entries, the wizard located the systems based on the criteria you provided. This is not the only type of discovery that you have available to you, though. You can find many other objects that you may want to monitor.
Prepackaged management packs will already have discovery methods defined. The authors of the management packs know what type of objects they are monitoring in your network. Of course, they won’t know exactly what objects exist in your network, but they do know what they would like to monitor. The discovery rules that they have defined will query and probe managed agents in search of the objects. Once discovered, the objects are registered as objects of a certain class. In a number of cases, these objects of the same class are automatically added to predefined groups, such as Windows Server 2003 Computers. These groups are then used to organize the objects so that monitoring methods and overrides can be assigned to them more easily. For more information, see the next section, “Groups.”
When a management pack author creates a discovery rule, the target for the rule needs to be chosen. The author has to know what type of object they are going to monitor and how it exposes itself. This exposure is commonly referred to as a class. Operations Manager is not selective about the methods that can be used to discover object attributes. You could parse a system’s Registry to find a specific key, or you could perform a WMI query to find objects. In general, attribute discoveries will be done through Registry searches and WMI queries against the system. However, some other methods exist that belong to the custom management pack authoring realm, such as script-based discoveries.
The authors of the management packs know the best way to discover the objects, but you may run into a scenario where you discover objects that you do not want to monitor. When a management pack is sealed, you will not be able to directly modify the discovery rule so that you can limit the discovered objects. You can always create an override that will limit the objects that are discovered. This way, you still have control over the monitored objects in your network. For more information, see the section “Overrides” later in this chapter.
If you feel the need to create a new group based on an attribute that is not defined within a management pack, you can create your own rule by using the Create Attribute Wizard. This wizard is available in the Operations Console; in the Authoring view, open the Management Pack Objects, and right-click Attributes in the left pane. Then select Create A New Attribute from the context menu.
As with most wizards, you need to supply a name for the item you are creating—in this case, the attribute. Most administrators simply supply the name here and move on. You have the option to supply a description as well. Take the time to further identify what the attribute is and why you are discovering it. At a later time, when you or another administrator is reviewing the attributes, the few moments you take to further identify the information could make this process easier.
After you click Next, you are presented with the Choose A Discovery Method page, which allows you to choose the type of discovery that you will use. As you can see in Figure 5.4, you have the options available to you that were discussed a few paragraphs back. After you select the type of discovery you are planning to use, choose the management pack that will host the discovery method for this attribute. If you are working with a management pack that you created, or if the attribute you are discovering is for a management pack that is unsealed, you will be able to select the management pack from the list and move on. However, if the management pack is sealed, you will not be able to modify it, which means you will not be able to save the new attribute discovery in the management pack.
Figure 5.4 Selecting the discovery type from the Choose A Discovery Method page

Sealed management packs introduce another challenge, then. You will have to identify an unsealed management pack where you will save the attribute discovery, or you could create a new management pack just for this occasion. Of course, just as with anything else, you should plan your attack. You don’t want to have excess management packs lying around just because you wanted to create a new attribute discovery or an override. Think about and plan what you would like to do in your management group. If you decide to create a new management pack, instead of selecting a management pack from the pull-down menu, you can click the New button.
After you have decided which discovery type and management pack you are going to use, define how the discovery is going to work. This is where the wizard deviates depending on the discovery method you use; if you are searching the Registry, you must specify the Registry location and data that you are going to use. If you are performing a search with WMI, you must supply the WMI query and data that you are searching for.
Once you fill in your criteria and click Finish, you will have an attribute ready for discovery of all instances of a class, such as a database or an application.
Groups
In Operations Manager, you can organize discovered objects into groups. If you have just imported a management pack that is used to monitor a storage area network (SAN), the discovery methods included in the management pack will probably be configured to monitor several objects, including physical drives and logical drives. After the discovery process is complete, the objects will be added to the defined groups according to their discovered attributes by using dynamic group membership rules.
The criteria that are used to populate groups can be anything from a list of names to identify the objects, to information that is unique to the object that is defined from the attributes of the classes found during discoveries. As discoveries find objects, groups are populated based on their configurations. As with discoveries, developers of the management packs have to work in generalities because they do not know the inner workings of every company. They create the groups that they believe will be useful for a majority of the companies that will use their management pack and which are useful to aid monitoring, reporting, and views. For more specific groups—those that are tailored to your own environment—you will have to create your own groups to use.
Once configured, groups can be quite useful. Since they identify unique object types, you can specify who will be able to monitor and manipulate the objects in the group. You can also control the views in the Administrator console by using groups. As such, you can take control of your monitoring solution and assign access at a granular level. Take, for instance, a scenario where you want to allow a user to be able to view and monitor specific databases in your SQL Server infrastructure. You can create a group that identifies the databases by name, and then assign permissions for the user to be able to view and monitor them. You can then create a specialized view that only displays information pertaining to the objects in the group. This way, you can isolate the data that you want the operator to view, keeping them out of data they do not need to view. Also these groups can be used for sending out notifications to a systems admin for a limited number of systems.
Creating Groups
If the groups included in a management pack do not meet your needs, you will have to create your own. The process is not difficult; a wizard is available to step you through. You must decide what the group will be used for. As mentioned, a group can be created to organize systems or objects. Once you decide what you want to organize and monitor, start the Create Group Wizard: in the Operations Console, select the Authoring view and right-click Groups in the Authoring pane. Then select Create A New Group.
First, enter the group name and a description that will help you remember what the group is used for. Next select the destination management pack, or click the New button to create one.
When the Choose Members From A List page appears, you need to make a choice. The page that you are looking at, as shown in Figure 5.5, is used if you want to explicitly add objects to the group. One of the most popular uses for this page is to add computers by name. You could just as easily add databases by name. If you have decided to add objects to the group in this manner, click the Add/Remove Objects button to specify the objects.
Figure 5.5 Explicitly adding objects

The Object Selection dialog box that appears presents you with search criteria that you will use to find the objects. The Search For list contains object types that you can use to identify the objects. If you are planning on adding computers by their name, select the Windows Computer object type, as shown in Figure 5.6. At this point, you could go on and view a list of all the computers in your domain, but you may have too many to go through. If you have a naming scheme that you use for your systems, enter a portion of the computer name that is used for the group that you would like to add. Enter the text in the Filter By Part Of Name text box and then click Search.
Figure 5.6 Adding objects explicitly

After the query has run, you are presented with a results screen that allows you to select the appropriate objects. Select those that meet your needs, click the Add button, and then click Next. The only problem with this method is that the group membership is static in nature. If you want to add or remove objects from the group, you have to manually add or remove them. Allowing the system to dynamically control the group membership is usually the more efficient method of controlling the group. To do so, you have to create the group based on attributes.
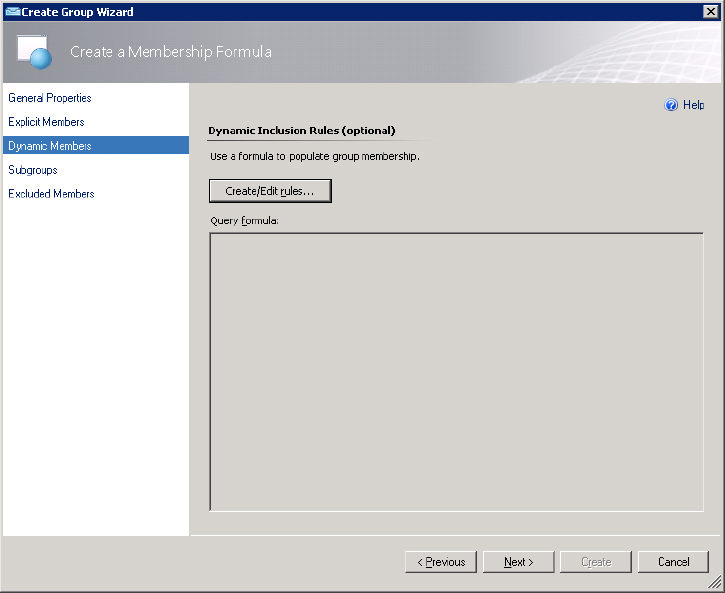
If you plan to create a group based on an attribute, you have to move past the Choose Members From A List page and work with the Create A Membership Formula page, shown in Figure 5.7. When you click the Create/Edit Rules button, you are presented with a query builder. The query builder is handy if you are not proficient at writing your own queries. The attributes that you can use are included in the list of object types on this page. When you created an attribute discovery method in the Discovery area, you chose a class that the attribute was related to. Now you are targeting the attribute at a specific class. You can select an attribute from the list, or if you have created your own attribute, click Add and select your attribute from the list of attributes.
Figure 5.7 Create A Membership Formula wizard page
The operators that are available from the query builder let you fine-tune your query. You can use the standard Is Equal and Does Not Equal and Matches Wildcard operators as well as some less common operators such as Does Not Match Wildcard and Matches Regular Expression. Using the Insert button, you can add additional expressions, as well as create AND and OR groups to control the order of precedence for query evaluation. When you create the groups, you are creating a list of expressions that are evaluated together. For instance, if you enter three expressions in an AND group, all of the expressions have to evaluate to true for it to be processed.
As Figure 5.8 shows, as you are building your query you will see just a few of the classes that are available for you to choose to populate the group. When you select a class and click Add, an AND group is created in the query window. When you go back to the classes and add another, an AND group is created so that the two AND groups are evaluated. When both of the AND groups evaluate to true, the expression becomes true. In Figure 5.9, we have selected the Windows Computer class and chosen the attribute for Organizational Unit AND from the SQL Computers class, the Display Name attribute. The settings we have specified allow us to create a group that includes all the SQL servers in the Development OU. A practical use for this is that you might want to override certain thresholds for SQL servers in development, because they will probably be testing with those machines and you might otherwise get lots of alerts.
Figure 5.8 Choosing classes for the group query
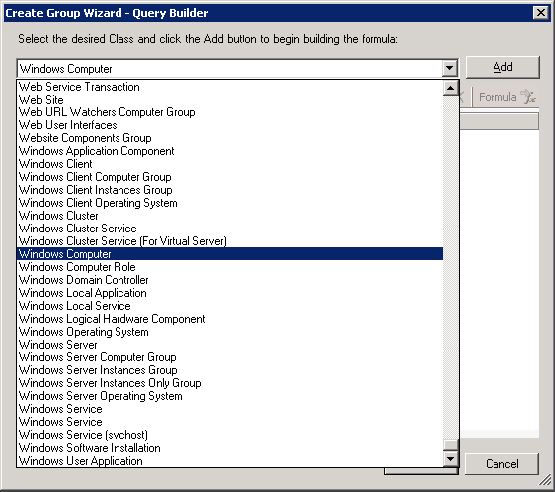
Figure 5.9 Creating the query

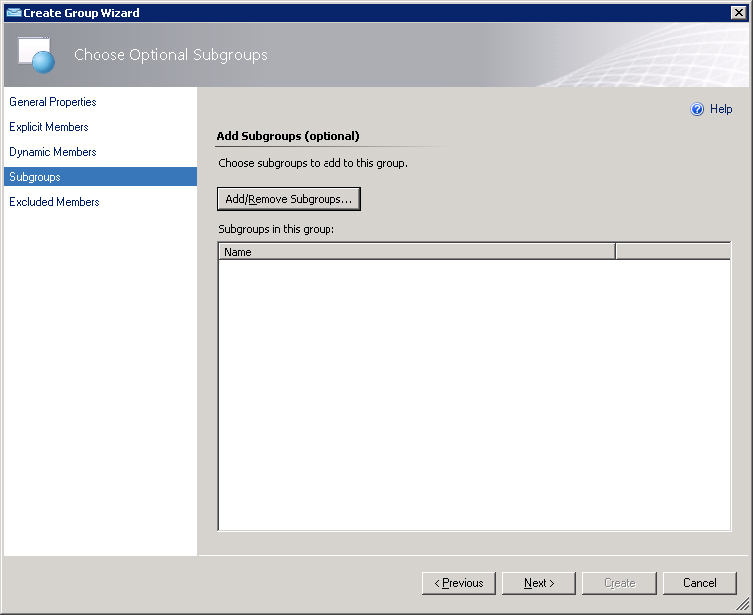
Once your query is completed, click the Formula button to view the completed query statement. Click Next and you will be presented with the Add Subgroups page. Here you can create groups that have their own distinct membership but are related to the parent group. For instance, you could have a group of operators who are responsible for monitoring all the Exchange public folders, and then create subgroups and assign other operators the ability to monitor a subset of those public folders. The only caveat here is that the group that you will configure as a subgroup must already exist. You can search for the group names by clicking Add/Remove Subgroups, as shown in Figure 5.10.
Figure 5.10 Adding subgroups
The final page of the wizard allows you to exclude specific objects from the group membership. This is helpful when you are using dynamic group membership and there are objects that you want to explicitly exclude from being part of this group. The method for adding excluded objects to the list is identical to the one for adding subgroups. Once you have them added, click Finish to complete the wizard and your group will be created and populated.
Monitors
Monitors are used to determine the health of objects that you plan on monitoring. Several monitor types are available, each providing you with a means of extracting information about an object and determining how that object is functioning. Depending on what type of monitor you are working with, you could determine the health of an object, which can alter the health view of other monitors. You can also create alerts when a monitor determines that an object is in a warning or error state.
The important thing about monitors is that they have a health concept in which there is a determination whether something is healthy or not, and it should have a definition for both of those states. For instance, a monitor can say that if a Windows Service is running it is healthy and if it is not running it is unhealthy. You will see that the monitor changes to red or green depending on the state, and in many cases an alert is generated to alert you of this state change. Because a monitor also knows when the situation is solved (the Windows service is started again in our example), the state returns to green and the alert is automatically closed. This means that monitors tend to reflect the current state of affairs and not just something that may have happened in the past and may not be the case anymore. This is one of the things in which they differ from rules, which are discussed later in this chapter.
In this chapter we have split up the monitors into rollup monitors and unit monitors. The rollup monitors are meant to be the connection between child monitors (which monitor for a certain threshold or event) and the health hierarchy. Let’s take an oversimplified example: say a unit monitor finds a website to be unavailable. A rollup monitor might say that this means the health state must be rolled up to say that the web services on that machine have a problem. A subsequent rollup monitor might say that this means that the server has a problem because of this.
Unit monitors check for a certain condition, such as an event log entry or a Windows service in a stopped state. Or they watch a performance counter. We have separated the unit monitors in this chapter into unit monitors and performance monitors.
In this chapter we will give an overview of some of the most common monitors. There are more available to you to work with.
Rollup Monitors
The fundamental change in monitoring is what sets Operations Manager apart from its counterparts. As we have mentioned several times throughout this book, moving from server monitoring to service monitoring allows administrators to determine how a service and its supporting services are functioning. Two of the most important tools in Operations Manager’s arsenal are the aggregate rollup monitor and the dependency rollup monitor. These monitors work with all the monitor types to create a monitoring chain, which can be seen in any health explorer view.
Aggregate Rollup Monitors
Let’s start with an example involving Windows services. Supporting services act as dependencies to related services in the chain. For instance, one Windows service for SQL might depend on another service in order to run. This is a dependency. When a dependency service starts having problems, the monitor that is watching the service is changed to the appropriate state. The change does not stop there, however. All the monitors further up the chain also take on the state of the affected service if so configured. In this way, you can see that there is a problem with the service due to issues with another service. Of course, you do have the option of not aggregating the health state of the monitor, in which case the chain will be affected only to the degree that you specify. In this health chain or hierarchy, we have parent monitors and child monitors. The health state of the child monitors rolls up to the parent monitors. The parent monitors are the rollup monitors.
In the past, when a server was being monitored, only services and applications residing on that server would be monitored. If the server did not have a problem but a dependency service on another server was having an issue, the person responsible for the unaffected server would not see anything wrong. Rare is the case anymore when a server can work as a stand-alone unit. E-mail servers rely on networking services and underlying infrastructure to run correctly. Database servers use web-based front ends for users to access data. Domain controllers rely on DNS servers. For instance, if you are running Exchange, you must make sure that DNS is available. You also need to have domain controllers configured as Global Catalogs. In previous versions of Operations Manager, you could have a DNS server fail but the technicians responsible for managing the Exchange servers may not have realized there was an issue.
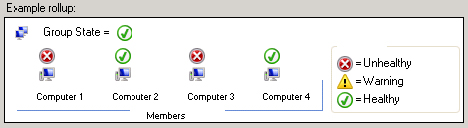
Aggregate rollup monitors can be configured so that they show a worst- or best-case state of the service or application being monitored. When you configure a monitor as best-case, you are essentially saying that you want the monitor to appear in the state of the service or system that is functioning the best, which Microsoft shows in their graphic seen in the Health Rollup Policy configuration page (Figure 5.11). You would typically use a best-case state when you want to make sure you have at least one service still providing functionality. Such is the case when you have three SMTP servers in a network load-balanced scenario. You could configure a monitor that shows an operator that the service is still available even though one of the SMTP servers may have gone offline.
Figure 5.11 Best-case rollup policy
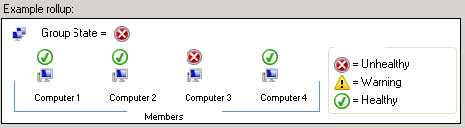
As you can imagine, the worst-case state is the polar opposite of the best-case state. When you configure a monitor to show worst-case state, whenever a single child monitor goes into a warning or error state, that state is propagated up the hierarchy, which Microsoft shows in their graphic seen in the Health Rollup Policy configuration page (see Figure 5.12). In the case of the SMTP service that we mentioned earlier, if you are using the worst-case state, the operator would see a problem as soon as one of the SMTP servers failed or had a problem. For some monitors, you can decide whether you are a glass-half-full or glass-half-empty kind of person. Although most people want to see if there is any problem at all, you may want to devise different viewing strategies for different groups in your organization. Some may need to see that there is a problem as soon as a child monitor detects one, whereas others don’t have to see that there is a problem until the service is completely down.
Figure 5.12 Worst-case rollup policy
If you are working under an SLA that specifies the availability of a service, you may find that showing a best-case state is the way to go. Most high-availability solutions provide for some type of redundancy or failover. Consider a network load-balanced web service that provides access to an e-commerce site. The web servers that provide access to the website will all offer the same functionality to the customers who are visiting the site. If one of the web servers fails, the customer requests would then simply be redirected to the other web servers in the network load-balanced cluster. Access to the website would not be affected.
A positive state for the service would appear in the Operators Console as well as in all the reports that could be generated from the database. As long as one web server was still providing access to the website, the SLA would be intact. Of course, other criteria are usually included in an SLA, but you get the picture.
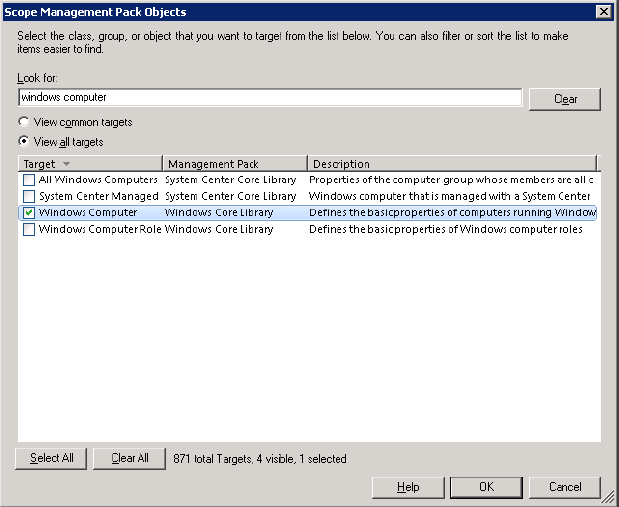
To create an aggregate rollup monitor, begin by opening the Operators Console and choosing the Authoring view. In this view, navigate through the Authoring pane until you reach the monitors. To do so, select Authoring ⇒ Management Pack Objects ⇒ Monitors. Since several object types can be monitored, you will have to generalize the view. As the list of monitors is long and a long list of targets is shown, you will first scope the view for simplicity sake and target Windows Computer. These examples are just examples and you will probably target other classes when you create your own monitors; also, you will use other scoping of the console or none at all once you are familiar with the processes and where to find things. For now, you will use a scoped view and a specific target throughout the chapter to keep things simple. At the top of the Operators Console, click the Scope button. When the Scope Management Pack Objects By Target(s) dialog box appears, as shown in Figure 5.13, type Windows Computer in the Look For text box. Select the Windows Computer check box and then click OK. Scoping the view to Windows Computer is used here purely as an example to target the next few unit monitor examples against. When creating monitors and rules, always first think about what will be used as the target.
Figure 5.13 Scoping by Windows Computer
Now the view should show only the Windows Computer object type. Once you expand the Windows Computer object type, follow these steps:
Figure 5.14 Aggregate rollup General Properties
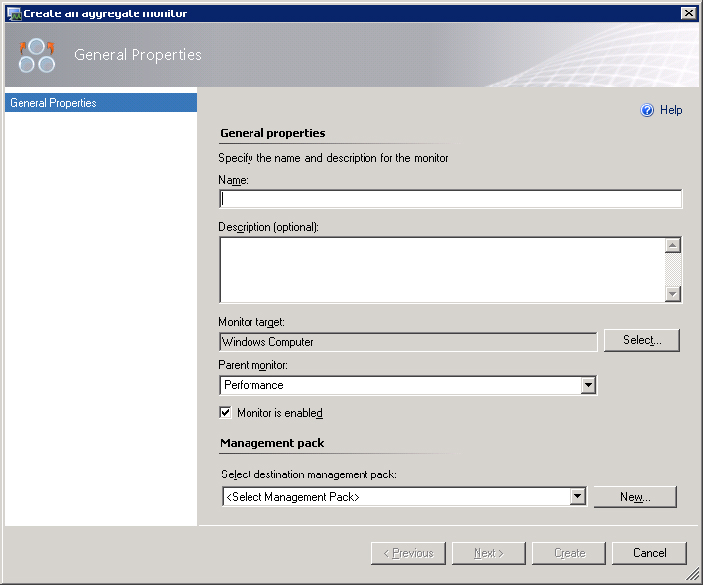
Figure 5.15 Configuring alerts for the aggregate rollup monitors

Dependency Rollup Monitor
At first glance, you might think the dependency rollup monitor is the same thing as an aggregate rollup monitor, but there is a difference. Whereas the aggregate rollup monitor relies on child monitors for services in a solution, a dependency rollup monitor can change the health state for a dependency that would otherwise not be included in an aggregate rollup monitor chain. Exchange is a good example of this. In an Exchange solution, you have several services that need to run in order for the Exchange solution to appear healthy. You have network services that have to run in order for Exchange to function. For instance, DNS has to be functioning for the Exchange servers to locate their Global Catalog servers as well as each other. SMTP servers are responsible for sending e-mail messages between each of the Exchange servers as well as foreign mail systems on the Internet.
If one of the SMTP servers running on an Exchange server fails, the aggregate rollup monitors propagate the health state up the chain. However, to show the Windows server in the same state, you have to use a dependency monitor. Without the dependency monitor, you would see each of the servers in a healthy state and only the Exchange services having a problem. To identify which server is having the problem, use the dependency rollup monitor. In some instances you need to look only at a specific level, such as the Exchange role, and not roll everything up to the server level. The whole server is not necessarily down if one of its functions, roles, or services is down.
As with the aggregate rollup monitor, you can change the health state of the dependency rollup monitor so that it reflects the health state of the dependency according to your needs. You have the same two options that were available from the aggregate rollup monitor: Worst State Of Any Monitor and Best State Of Any Monitor. In addition, a third option is available: Worst State Of The Specified Percentage Of Members In Good Health State (see Figure 5.16). This third state allows you to fine-tune the monitor’s health; for example, you could have six SMTP servers and the system could be shown as healthy as long as three are still functioning properly. In this case, you could specify that 50 percent of the systems have to show in a healthy state for the monitor to show as healthy. As soon as the fourth system in a group of six has a problem, the monitor would show in a warning or error state.
Figure 5.16 Worst state of percentage of members
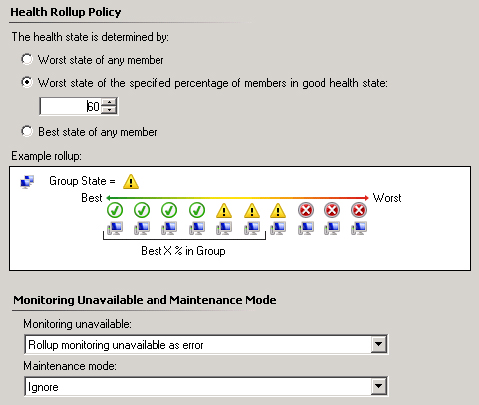
In addition to the health state rollup, the dependency rollup monitor allows you to change the state of the monitor whenever monitoring becomes unavailable or if the system is placed in maintenance mode so that you can perform scheduled maintenance. For either of these settings, you can configure the health to Error, Warning, or Ignore. Of course, Ignore leaves the state as healthy.
To create a dependency rollup monitor, open the Operators Console and choose the Authoring view. In this view, navigate through the Authoring pane until you reach the monitors. To do so, select Authoring ⇒ Management Pack Objects ⇒ Monitors. Since several object types can be monitored, you can generalize the view. At the top of the Operators Console, click the Scope button. When the Scope Management Pack Objects By Target(s) dialog box appears, as shown in Figure 5.13, type Windows Computer in the Look For text box. Select the Windows Computer check box and then click OK.
Now the view should show only the Windows Computer object type. Once you expand the Windows Computer object type, follow these steps:
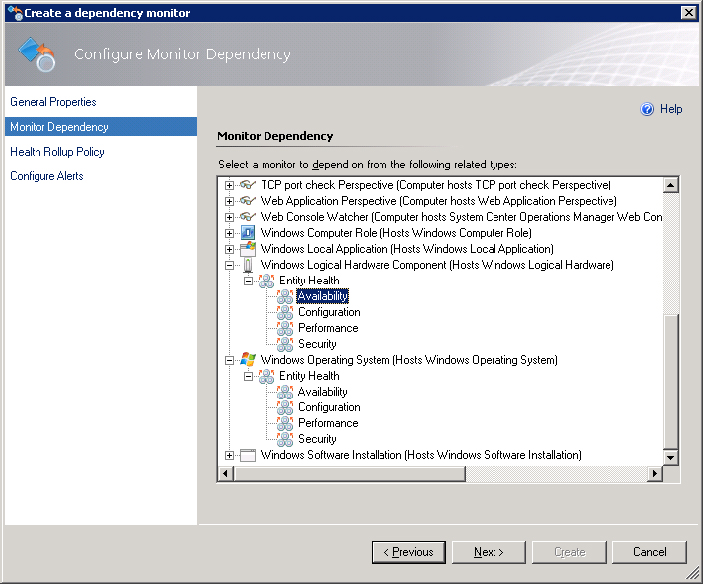
Figure 5.17 Choosing the monitor dependency
Unit Monitors
As discussed earlier, unit monitors do all the health state monitoring. Some call them the workhorses of monitoring. In our discussion of the various kinds of unit monitors, we have split the performance monitors into their own section. In this section we will first discuss the other types of unit monitors. These unit monitors are meant to monitor discrete events or services so that you can detect when you have an issue arising. A selection of these kinds of unit monitors will be discussed in this section. Several more monitors are available through the Operations Manager console and even more when you are using management pack authoring tools.
Simple Windows Event Unit Monitor
A simple Windows event unit monitor keeps an eye on event logs, watching for an event that matches a query you have built. If you decide that you want to be notified whenever event ID 9036 appears in the system log, you can create that notification here. There are three types of simple Windows event unit monitors:
To create a simple Windows event unit monitor, open the Operators Console and select the Authoring view. In this view, navigate through the Authoring pane until you reach the monitors. To do so, expand Authoring ⇒ Management Pack Objects ⇒ Monitors. Since several object types can be monitored, you can generalize the view. At the top of the Operators Console, click the Scope button. When the Scope Management Pack Objects By Target(s) dialog box appears, as seen in Figure 5.13, type Windows Computer in the Look For text box. Select the Windows Computer check box and then click OK. Just to reiterate, we are using Windows Computer as an example to target our monitors. In normal circumstances it is more likely that you’d select another target depending on your monitoring needs.
Now the view should show only the Windows Computer object type. Once you expand the Windows Computer object type, follow these steps:
Figure 5.18 Selecting Windows Event Reset
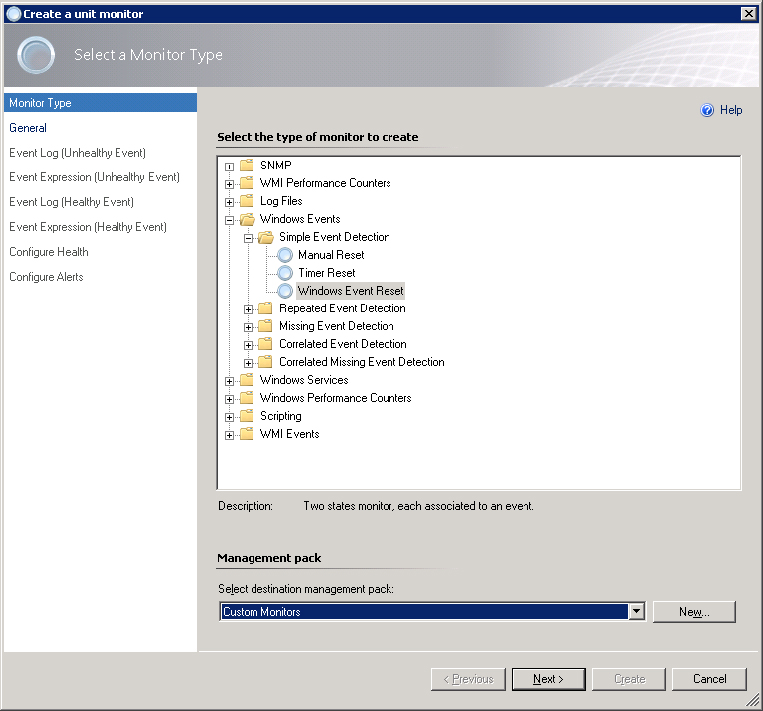
Figure 5.19 Choosing the monitor target

Figure 5.20 Building the expression

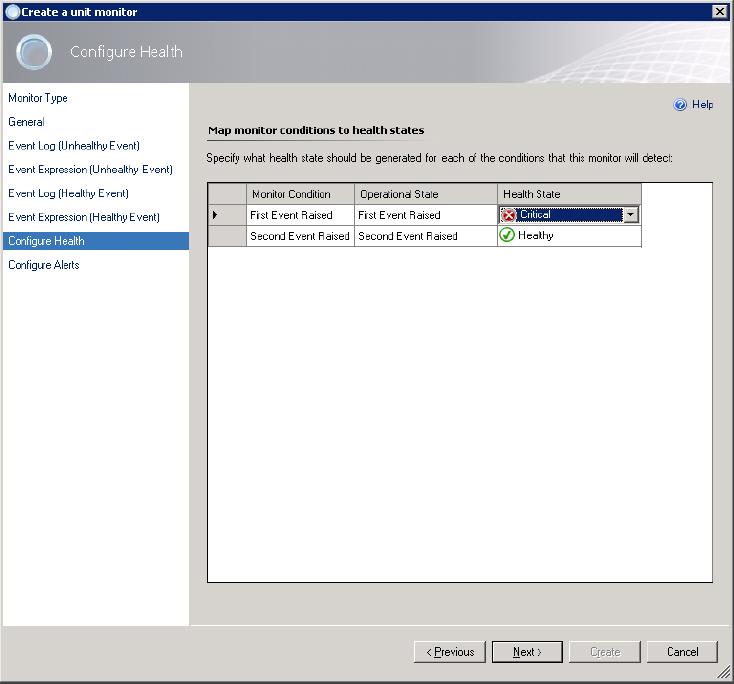
Figure 5.21 Configuring the health states
Next to Simple Event Detection are Repeated Event Detection and Missing Event Detection. Repeated Event Detection is useful if you want to check for multiple occurrences of the same event in a limited amount of time. However, in some cases you would want to check for a missing event—for instance, when you are expecting events from scheduled tasks or some kind of heartbeat messages from an application. That is where Missing Event Detection is used. Both these options have the same three types of monitors: Manual Reset, Timer Reset, and Windows Event Reset.
Correlated Windows Event Unit Monitor
Correlated Windows event unit monitors are an interesting monitor type. Whereas simple Windows event unit monitors wait for an event to occur, the correlated Windows event unit monitor will not change the health state unless a second event also occurs. This is because there are times when an event is not a critical event unless a second related event also appears. When you create this type of unit monitor, you need to actually configure three events: one to make the monitor take notice, a second to change the state, and a third to reset the state back to healthy.
The first event is configured as a simple monitor that initiates a timer. The timer settings determine how long the monitor will wait for the second event. The second event has to occur during the timer settings. Make sure that you know the time it takes for the second event to occur. If you set the timer too short and the second event occurs outside the parameters, you will not see a state change. If the timer is set too long, you could possibly encounter phantom state changes that don’t reflect a true problem. One thing to note is that the second event does not have to occur in the same event log as the first event.
Just like the simple Windows event unit monitor that is configured as a Windows event reset type, the third event in the correlated monitor watches for another event that reports the system is running nominally. Here are the correlations you can define:
Figure 5.22 Monitoring for the occurrence of A and then three B events in a specified time frame
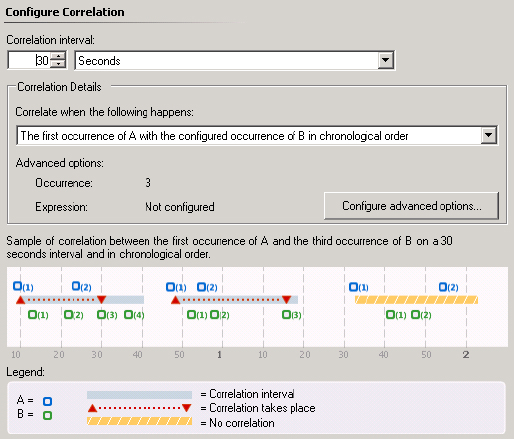
Figure 5.23 Monitoring for the occurrence of three A or B events in a specified time frame
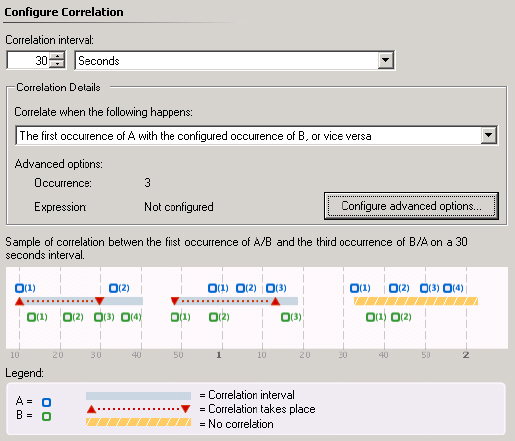
Figure 5.24 Monitoring for three occurrences from Log B since the last occurrence from Log A

Figure 5.25 Monitoring for three occurrences from Log A or Log B since the last occurrence from the other log

Figure 5.26 Monitoring for two events to occur from Log B and then resetting the timer whenever an event from Log A appears

It’s also possible to create a Correlated Missing Event Detection monitor—for instance, if you want to be alerted when a scheduled backup starts but does not finish within a certain time.
To create a correlated Windows event unit monitor, open the Operators Console and select the Authoring view. In this view, navigate through the Authoring pane until you reach the monitors. To do so, expand Authoring ⇒ Management Pack Objects ⇒ Monitors. Since several object types can be monitored, you can generalize the view. At the top of the Operators Console, click the Scope button. When the Scope Management Pack Objects By Target(s) dialog box appears, as shown in Figure 5.13, type Windows Computer in the Look For text box. Select the Windows Computer check box and then click OK.
Now the view should show only the Windows Computer object type. Once you expand the Windows Computer object type, follow these steps:
Figure 5.27 Configuring the correlated events

Windows Services Unit Monitor
Windows services unit monitors constantly watch a service running on a computer and change the state of the object when the service is found to be not running. Although many of the services running on Windows systems can report some health information to monitors, it can be helpful to watch for a failed service in this manner.
In Operations Manager there is also a Windows Service Management Pack Template, which gives you the ability to set up monitoring for a Windows service state and also define its processor and memory usage. This template also makes use of the Windows services unit monitor.
To create a Windows services unit monitor, open the Operators Console and select the Authoring view. In this view, navigate through the Authoring pane until you reach the monitors. To do so, expand Authoring ⇒ Management Pack Objects ⇒ Monitors. Since several object types can be monitored, you can generalize the view. At the top of the Operators Console, click the Scope button. When the Scope Management Pack Objects By Target(s) dialog box appears, as shown in Figure 5.13, type Windows Computer in the Look For text box. Select the Windows Computer check box and then click OK.
Now the view should show only the Windows Computer object type. Once you expand the Windows Computer object type, follow these steps:
Figure 5.28 Choosing the appropriate service to monitor
SNMP Probe-Based Unit Monitor
Simple Network Management Protocol (SNMP) is used in many organizations to monitor and control devices, which includes network devices such as routers and switches as well as computers. SNMP has been around for a long time, providing an efficient monitoring solution that many administrators trust. Part of its efficiency is due to the fact that SNMP does not have many commands that it relies on. SNMP clients use simple rules to watch for a monitored object to fall outside of the parameters set by the administrator, and then will send in a “trap.” This means there are two ways to work with SNMP in monitoring. The first is that you can probe (query) a device using SNMP for what you want to know, and the second way is to wait for a device to send out an SNMP trap to the monitoring system. This section talks about probe-based monitoring, but it is possible to create trap-based SNMP monitors as well using Operations Manager.
SNMP is based on a set of standards and has a governing body that controls the identifiers for all of the monitored objects. Each of the objects is assigned an identifier, known as an object identifier (OID). A collection of OIDs make up the Managed Information Base (MIB) for monitored solutions. MIBs exist for many of the Windows servers and services as well as managed network devices. Each company that wants to have their solution monitored using SNMP submits a request to have their OIDs ratified and accepted as a standard.
If you would like to read a more detailed description of SNMP, check out:
http://msdn2.microsoft.com/en-us/library/aa379100.aspx
That quick summary of SNMP was meant to give you a rudimentary understanding of how SNMP works. As you create and work with SNMP probe-based unit monitors, you will find that you will have to identify the OID of the object you want to monitor. This unit monitor queries the object and receives responses, which you can then use to set the health of the object. With the SNMP probe-based monitor, you have the opportunity to set two different probes. The first probe monitors for the object to go into an unhealthy state, at which time it sets the health to Warning or Error. The second probe you define is used to set the health back to the success state.
SNMP-based network device monitoring has improved significantly with System Center 2012 Operations Manager and offers a lot of possibilities over and above the simple SNMP probe discussed in this section. To read more about Operations Manager’s network monitoring capabilities, refer to Chapter 8, “Network Monitoring.”
To create an SNMP probe-based unit monitor, open the Operators Console and select the Authoring view. In this view, navigate through the Authoring pane until you reach the monitors. To do so, expand Authoring ⇒ Management Pack Objects ⇒ Monitors. Since several object types can be monitored, you can generalize the view. At the top of the Operators Console, click the Scope button. When the Scope Management Pack Objects By Target(s) dialog box appears, as shown in Figure 5.13, click the View All Targets radio button and type SNMP Agent in the Look For text box. Select the SNMP Agent check box and then click OK.
Now the view should show only the SNMP Agent object type. Once you expand the SNMP Agent object type, follow these steps:
Performance Monitors
Threshold monitors are used to keep an eye on the performance of an object. Anything that you could add into a performance log can be monitored using a threshold monitor. That means that any counter can be proactively monitored by Operations Manager, and an action can be taken if the counter falls out of the criteria you have selected. If you want to know when processor utilization peaks over 90 percent, or when excessive page faults occur, threshold monitors can let you know. Operations Manager offers two types of threshold monitors: static and self-tuning.
Static Threshold Monitor
Static threshold monitors are used to make sure that an object does not fall outside of safe parameters. Of course, you have to know which limits you are watching for. Some are well documented; others you will have to glean from a baseline of your system. Once you have determined what the peak value is, you can create a static threshold monitor. During the interval that you set, the agent will watch for the system to exceed the threshold, and an alert or health state can be modified.
Single thresholds come in four flavors. When deciding which one you would like to use, determine what type of monitoring you are trying to accomplish. Each threshold type has its place in your monitored solutions; use the one that will provide the best method of monitoring.
Self-Tuning Threshold Monitor
Chapter 11, “Optimizing Your Environment,” has a complete section devoted to self-tuning threshold monitors. To have a better look at how these monitors function, check out that chapter. We are only going to provide a brief description of these monitors here because they round out this topic.
Self-tuning threshold monitors take samples of object counters and learn the normal operating parameters of your systems. This means that you do not have to perform the same baseline analysis of your systems as you do with other threshold monitors. The self-tuning threshold monitor performs its own baseline analysis and then starts monitoring for behavior discrepancies. The baseline that is created includes the standard operating behavior of your organization.
Since most systems take on a different load level at different times of the day, a standard threshold monitor will not be as effective. You would have to perform a baseline, and then decide the out-of-range values that you want to use for the threshold values. The value that you use has to be high or low enough that peak activity will not trip the monitor. At the same time, it has to be set at a level that abnormal activity will still be detected.
The self-tuning threshold monitor detects abnormal behavior during each of the phases of your operation. The database of samples that are collected determines what the typical operating parameters of the counter are at specific times of the day. The operating parameters at 8:00 a.m. are probably different than those at 12:00 p.m. The database will contain the baseline for the time period, and if the current sample falls outside that baseline, the monitor’s state will change.
When you create a self-tuning threshold, you have the option of configuring a two- or three-state monitor. Both these types of monitors have three areas that you can define: the area in the baseline, the area above the baseline, and the area below the baseline. These areas are then used to define where the healthy, warning, and error states are. In a two-state monitor, you define whether you want the error or warning state to be defined above or below the baseline. In a three-state monitor, you define whether the error state is above or below the baseline, just as with the two-state, but since the baseline is considered healthy, the remaining area is considered the warning level.
Note that you will have to create a baseline for each instance of the counter you are monitoring. For example, if you have a dual-processor system, each processor is considered an instance. You must configure the monitor to watch each processor individually. You cannot select the All Instances option to have both processors monitored as a single entity. This is because the monitor creates baselines on each instance and cannot alert on a combined view.
Using Rules
We have been discussing monitors up to this point, and for good reason—monitors allow you to view the health of objects to make sure that those objects are working as desired. Monitors can raise alerts based on the health of the object, and you can use them to verify the health of the entire service path. Rules can also be used to raise alerts based on how an object is functioning, but they do not allow you to monitor the health of the object.
If you have an object for which you do not need to view health information but you still want to monitor the status of that object, rules work very well. You must decide whether the object is part of an end-to-end service monitoring solution. Monitors can be used as either parent or child monitors in an end-to-end monitoring solution, but rules cannot. If the object you are planning to monitor is a stand-alone object, you could use a rule to monitor it.
There are several rules types that you can use when monitoring objects: alert-generating, collection-based, performance, and SNMP rules. For some of these, you can set criteria that you want to use for the rules.
Each of the rule types can be created in the Operations Console by selecting the Authoring view. After expanding the Management Pack Objects node and right-clicking Rules, select Create A New Rule from the context menu. The Create Rule Wizard starts and presents the Select A Rule Type page. Here, you will start creating each of the various rules.
NT Event Log–Based Rule
An NT event log–based rule is used to parse an event log and discover an event based on the criteria that you enter in the wizard. Using this rule, you can detect when a specific event occurs on a system and take immediate action on it. Since many of the events are well documented and there are solutions already devised, you can provide your operations staff with exact instructions to follow to alleviate the problem.
Figure 5.29 Choosing the NT event log rule

NT Event Log Event Collection Rule
The event log collection rule gathers the events that match the settings you specify in the rule. Once collected, they appear in the Event View for the agent-managed system.
Windows Performance Collection Rule
As with the event collection rules, the performance collection rule gathers the specified object performance data and stores it in the database. Once stored, the performance data can be viewed from reports or the Performance view. This collection rule is only meant to collect data and not to alert on it.
Figure 5.30 Performance Object, Counter, and Instance page
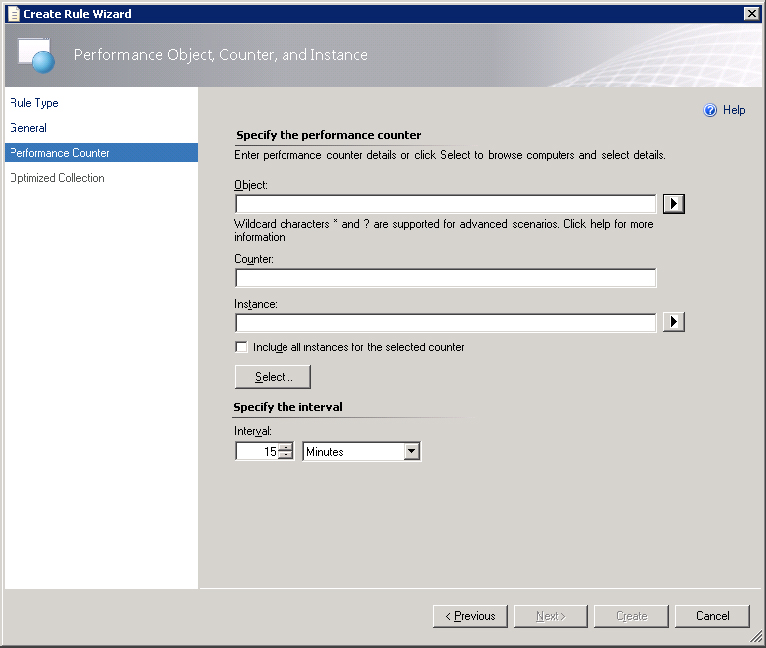
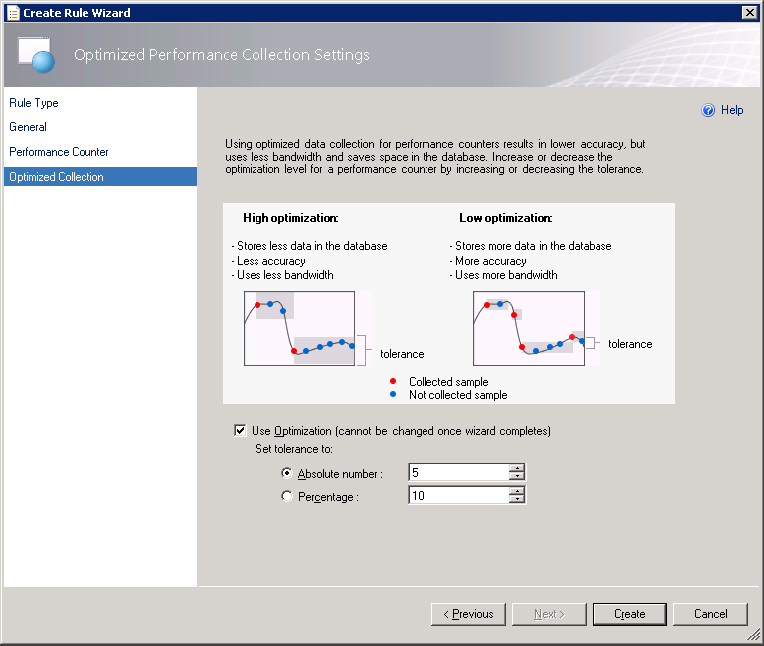
Figure 5.31 Optimization settings
WMI Performance Collection Rule
Whereas the Windows performance rule collects performance counter data as it is occurring, the WMI performance collection rule gathers the performance data that is collected through WMI. This allows you to pull data out of WMI that is not traditionally considered performance data and treat it as performance data.
Figure 5.32 Configuring the WMI namespace

Probe-Based Event Collection Rule
When no other rule will do, the probe-based collection rule will handle the job. The other rule types are already defined as to what the scope of the rule is, but the probe-based rule allows you to define how the rule will collect data and access the data.
Probe-Based Performance Collection Rule
Whereas the probe-based event collection rule will collect data from nearly any type of source file that you need, the probe-based performance collection rule can gather performance data from nearly any type of performance counter that is stored in the WMI. So if you have a product or service that stores any type of performance information in the WMI, you can gather that data using this rule.
Management Pack Templates
One of the powerful features of Operations Manager is its management pack templates. The template is a set of configuration pages that ultimately instructs Operations Manager what monitoring to create based on built-in template knowledge provided by the template author. Management pack templates allow you to save time creating monitoring, such as rules, monitors, views, discoveries, and so forth.
The default list of management pack templates is shown in Figure 5.33. This list of templates is available from the Authoring pane ⇒ Management Pack Templates node.
Figure 5.33 Management pack templates
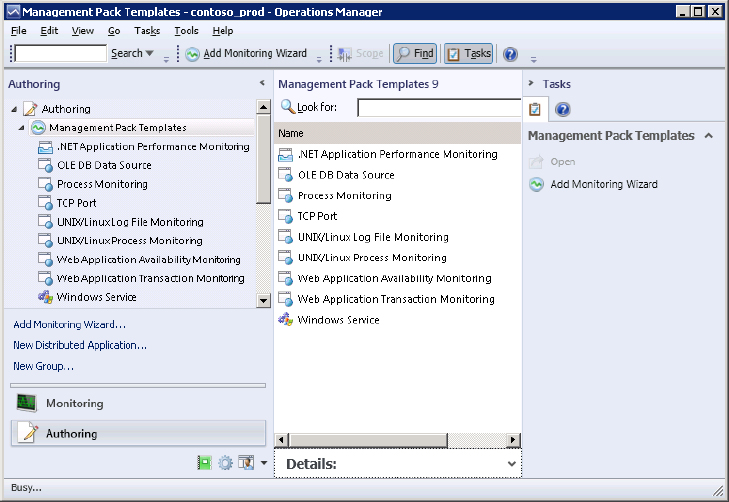
The following list describes the default available management pack templates:
Figure 5.34 OLE DB Build Connection String selector

Figure 5.35 UNIX/Linux Log File Monitoring

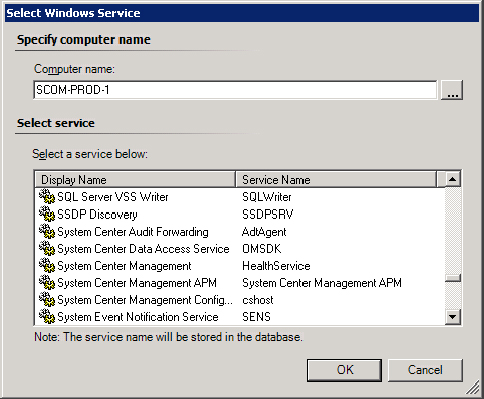
Figure 5.36 Windows Service Monitoring options

Overrides
An override in Operations Manager is used to alter the way monitoring works—for instance, by turning monitors and rules on or off, changing thresholds, or altering whether a monitor creates an alert. Overrides have been available throughout the various iterations of Operations Manager. Many organizations that had implemented a strict change management philosophy placed restrictions on the changes that could be made to a management pack’s settings without first going through a complete change management review. To implement a quick fix to silence a noisy management pack setting and restore a little order for the service desk, you can use overrides. The override effectively changes the way the setting works, but it won’t change the original structure of the underlying management pack. Instead, the override targets a specific rule or monitor and prevents it from acting on specific agent-managed systems.
Sealed management packs cannot be directly altered. Of course, that means administrators no longer have the option to modify the settings in the management pack—not directly at least. If you right-click on a sealed management pack setting in the Administration pane, and then click Properties to open the Properties page, as shown in Figure 5.37, you will notice that there are no configuration options that directly affect the way the setting functions. To allow an administrator to change the setting, an override has to be used.
Figure 5.37 The Properties page for a sealed management pack
In essence, an override is a means of making sure that a setting in the management pack works effectively in the network. Depending on what type of setting you are attempting to override, you will find options in the override criteria that allow you to modify the settings parameters. In Figure 5.38, an override is being configured for a setting in the Windows Server 2008 management pack. Notice that the management pack settings that can be changed through the overrides are shown in the override window.
Figure 5.38 Override options

The settings that are displayed are controlled by the provider of the management pack. If they don’t want you to see something, they don’t have to make it available. Usually the settings that are available are those that directly affect the functioning of the management pack. In the DNS Client Service Health setting shown in Figure 5.38, notice that the only settings available are the options to turn the alert on or off and the alerting options. Using the pull-down menu, you can specify that the monitor is disabled or that an alert coming from this monitor has a lower severity. Thus, you can suppress some of the rules that you do not find pertinent.
Since overrides are so important to optimizing the way your Operations Manager infrastructure runs, we have provided more information about them in Chapter 11.
Removing Management Packs
As your organization changes, you may find yourself no longer having to monitor certain services. Or you may no longer be responsible for monitoring something as other divisions become accountable for the service. If that is the case, you can remove a management pack from your management group. Removing a management pack removes the management pack and all associated views from the Operations Console; it also allows the data that had been collected and stored in the database to be deleted.
Removing the management pack is as easy as selecting the Delete option from the context menu. Keep in mind that most management packs rely on parent management packs to obtain some of their settings. Do some investigating to make sure you understand the relationship between the management packs you are using. Especially make sure that a management pack you are removing is not required by any other management pack. This will become apparent when opening the properties of a management pack as you saw earlier in Figure 5.3. If that is the case, first remove the dependent management packs.
To remove a management pack: