
Chapter 8
Network Monitoring
The Network Monitoring feature for System Center 2012 Operations Manager was one of the most hyped and eagerly awaited components of the newly released product, and it definitely lives up to expectations!
This chapter explores the various features that accompany Operations Manager’s network monitoring. We will explain network discovery and how you can manage your network devices once you have discovered them. Collecting data on your network devices (or any component in your environment) is one thing, but it’s what you do with that data after it has been collected that is most important. We also discuss the various reporting options related to network monitoring that are available to you. Once you have a handle on these options, we will delve into the tasks, groups, and dashboards that combine to give you a powerful insight into your network device environment. Finally, we will discuss common troubleshooting issues and their solutions, which will help you to become proficient with this aspect of Operations Manager.
In this chapter, you will learn to:
- Explore network monitoring
- Discover network devices
- Manage network monitoring
- Use network monitoring dashboards
- Troubleshoot network monitoring issues
Exploring Operations Manager Network Monitoring
Having a holistic view of all the components across the IT estate that you are responsible for is essential when you need to quickly identify critical service and application failures. The Network Monitoring feature of Operations Manager delivers this transparency and allows you to identify issues that originate at the physical network layer—which forms a crucial piece of your business service. This functionality, combined with the typical Operations Manager application and operating system monitoring, provides the full solution to managing your IT as a Service (ITaaS).
Let’s look at an example. In the Operations Manager console, you receive an alert telling you that a critical Windows server is unavailable. With Operations Manager network monitoring configured, you would also see an alert informing you that a physical network device port is offline. When you view the Network Vicinity Dashboard for the Windows server, you see that the unavailable server is connected to the offline port on the network device. This overall picture of your environment then expedites problem resolution because you can focus quickly on the actual network port that is offline as opposed to the “false positive” alert that the Windows server is at fault.
In this section we explore in detail the various components of the Network Monitoring feature of Operations Manager. Understanding these features will give you the full picture of the power and benefits that network device monitoring can bring you.
With the 2012 release of Operations Manager, you now have the following at your disposal:
- Multivendor support
- Multidevice support
- Multiprotocol support
- Resource pools
- Network dashboards
- Network reports
Multivendor Support
Operations Manager lets you discover and monitor a wide range of vendor network devices. It monitors any network device that supports the Simple Network Management Protocol, or SNMP (multiprotocol support is discussed later in this chapter in more detail) and also provides extended monitoring for devices that implement the management information base (MIB) RFC 2863 and MIB-II RFC 1213 standards.
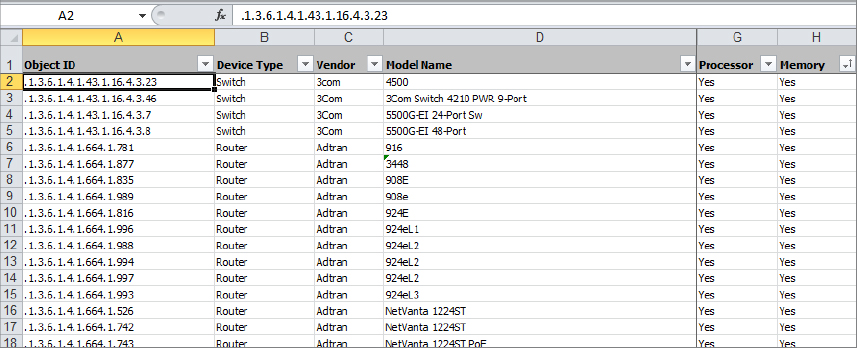
Microsoft has published an Excel spreadsheet with a list of network devices that support the extended monitoring capability of Operations Manager. As of this writing the list contains more than 800 devices, based on Object ID (OID), device type, vendor, model name, and whether or not the processor and memory were monitored as part of the extended monitoring function. Figure 8.1 shows the Excel spreadsheet and a sample of devices in the list. You can download the entire list here:
Figure 8.1 Certified device list for Operations Manager
www.microsoft.com/download/en/details.aspx?displaylang=en&id=26831
If you find that the device you are looking for is not listed in the spreadsheet, don’t worry, because Microsoft plans to update the list in future Operations Manager Cumulative Updates (CUs). On the spreadsheet you can see what level of monitoring you can expect from your device. The level of information that you are going to see is dependent on the MIB that Microsoft has used in the discovery. If your device is on the list, then it will be “certified,” which means that some level of detailed monitoring will take place that can include information on the processor, memory, and chassis.
If your device is not on the list, it will be added as a “generic” network device, and the interface that it was discovered on will simply perform an availability poll to give a health status back to the console. This is the same basic level of monitoring available out of the box from Operations Manager 2007 and is essentially an “up or down” scenario with no deep information on the device components.
Multidevice Support
Operations Manager can monitor physical network routers and switches, including the interfaces and ports on those devices. Virtual local area networks (VLANs) and Hot Standby Router Protocol (HSRP) groups in which discovered network devices participate are also monitored. Firewalls and load balancers are fully supported for discovery and monitoring too.
As you learned in Chapter 1, “Overview of Operations Management,” Microsoft has designed the System Center 2012 suite to fully integrate into the private cloud model. For this reason, it is important that Operations Manager be able to discover and monitor components like load balancers to enable you to monitor the fabric that supports cloud-based applications.
Multiprotocol Support
Operations Manager can discover and monitor network devices that use three different versions of SNMP: SNMP v1, v2c, and v3. Along with the standard support for Internet Protocol Version 4 (IPv4) network devices, Operations Manager now provides Internet Protocol Version 6 (IPv6) discovery when running recursive discoveries.
Resource Pools
When two or more management servers are added to an Operations Manager management group, these management servers become part of a resource pool, and all monitoring data is distributed to each member of the pool.
So, how does this apply to monitoring of your network devices? In Operations Manager 2007 the best practice was to perform all network monitoring on a separate management server. If that management server went down (or if the health service just stopped), you lost your network health. With resource pools, you can add management servers to a pool and assign your network devices to be monitored by the pool. If one management server in that pool fails, another one will automatically take over the monitoring.
When you use resource pools, not only are you able to select the management servers that will be involved in network monitoring, but you also are able to omit other management servers. This granularity leaves the power in your hands to decide which management servers perform network monitoring and which ones don’t, even if they are already members of another resource pool.
Dashboards and Reports
Out of the box, Operations Manager provides you with a number of new dashboards specifically designed for network monitoring. These dashboards display data on instance details, average response times, vicinity views, and average availability. The dashboard views allow you to quickly understand your network on a number of levels and enable you to look at a holistic map of devices such as switches, routers, servers, and also the Windows Server devices that are physically connected to them.
Network Monitoring reports focus on the interfaces, memory, and CPU of your devices. There are three interface reports that cover traffic volume, packet analysis, and error packet analysis. The other two reports cover CPU and memory utilization. We discuss Network Monitoring dashboards and reporting in greater detail a little later in this chapter.
Understanding Network Device Discovery
Before you can manage and monitor your network devices, you need to first get them discovered and available through the Operations console. This section will discuss the different concepts and requirements of Operations Manager network device discovery.
Discovery Rules
To enable network device discovery, you have to create discovery rules within the Operations Manager console. When you create a discovery rule, you need to assign a specific management server or gateway server to run that particular rule. This is because only one discovery rule can be run per management server or gateway server. You might need to design the placement of your management servers to operate on different network segments to ensure that they can communicate with the network devices that they will be discovering.
You can choose to run the discovery rules automatically on a schedule or just run them on demand manually when you need to. A discovery rule can be configured to run either as an explicit discovery or as a recursive discovery:
Any combination of SNMP v1, v2, and v3 devices can be discovered by a single discovery rule. However, SNMP v3 devices can only be discovered by explicit discovery or by being explicitly specified in a recursive discovery rule.
With a recursive discovery, if you specify an SNMP v3 device, then only that device will be discovered but not any other devices that are connected to it. Likewise, if you specify an SNMP v1 or SNMP v2 device within a recursive discovery, then the rule will only discover SNMP v1 and v2 devices and not SNMP v3 ones.
RunAs Accounts
During any type of discovery in Operations Manager, credentials are required to ensure that the relevant access and security policies are being adhered to. In the Network Monitoring feature, these credentials are managed through RunAs accounts that supply the community string (for SNMP v1 and v2 devices) or access credentials (SNMP v3) so as to perform the security negotiation between the Operations Manager management server and the network device. The SNMP community string value is another term for a password that will be used to carry out the security negotiation.
The RunAs account community string (for SNMP v1 and v2) can be configured on the network device as either a read-only or read-write string to enable a granular security model throughout your network monitoring.
For SNMP v3 network devices, you must configure a unique RunAs account with the following credentials:
RunAs Profiles
When you first install Operations Manager, two new RunAs profiles are automatically created that are used for network monitoring. These profiles are defined as:
The RunAs accounts that you create or specify for network device discovery are automatically associated with the appropriate SNMP Monitoring RunAs profile.
Discovery Phases
There are three phases of Operations Manager network discovery. These phases take into account the initial discovery, the validation of data returned, and then the network interface correlation. Each running phase is displayed in the status of the discovery rule within the Operations Manager console:
When the three phases have completed and discovery is finished, the resource pool that you have specified in the discovery rule configuration begins monitoring of the discovered network devices.
- The device type is Host and the vendor is Microsoft
- The sysDescription field contains Microsoft
- The sysOid starts with .1.3.6.1.4.1.311.1.1.3.1
- The sysOid contains 1.3.6.1.4.1.199.1.1.3.11
Configuring Network Device Discovery
The discovery process is the most important administrative effort required to implement network monitoring. This section will walk you through the steps required to configure network device discovery for your environment.
Before you begin your network device discovery, make sure that you have configured all firewalls between your network devices and Operations Manager management servers (including the Windows Firewall on the management server itself) to allow SNMP (UDP) and ICMP bidirectional communication along with ports 161 and 162.
The following steps walk you through the process of adding network devices to your Operations Manager environment:
Figure 8.2 Computer and Device Management Wizard
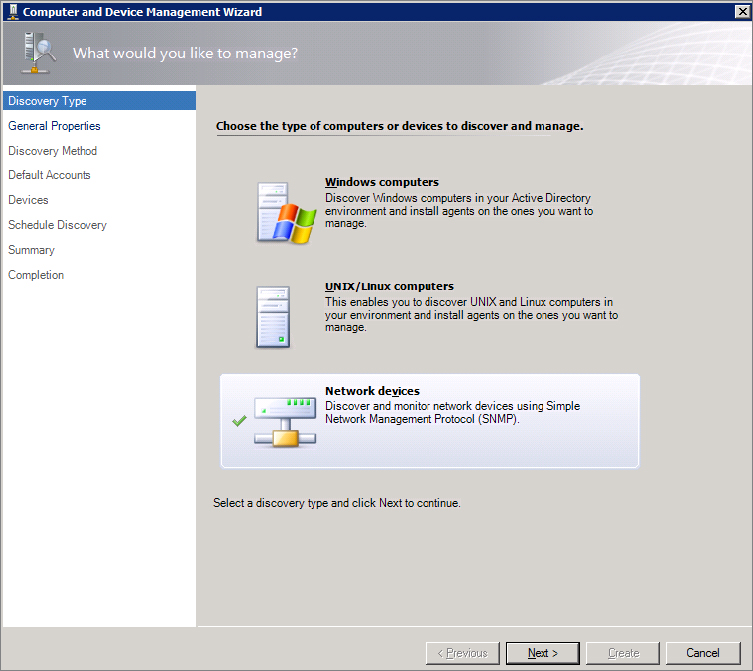
Figure 8.3 Network Devices Discovery Wizard, General Properties

- 2,000 network devices (25,000 monitored ports approximately) managed by two resource pools
- 1,000 network devices (12,500 monitored ports approximately) managed by a resource pool that has three or more management servers
- 500 network devices (6,250 monitored ports approximately) managed by a resource pool that has two or more gateway servers
Figure 8.4 Choosing a discovery type
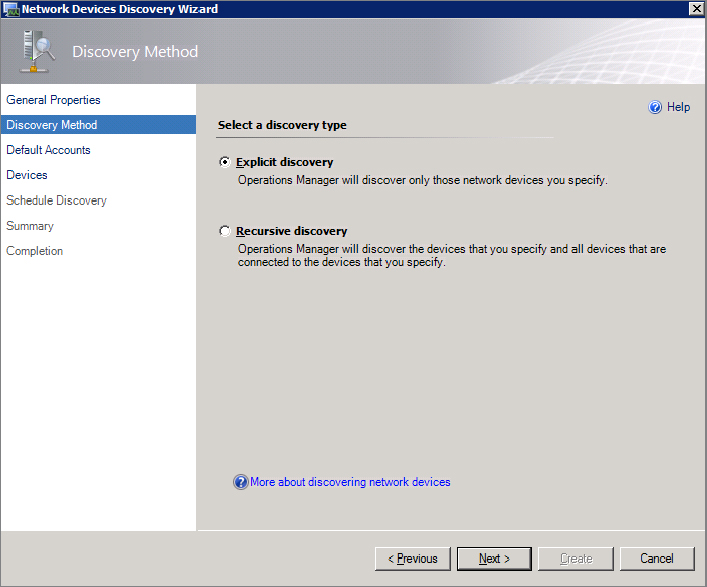
Figure 8.5 Using multiple RunAs accounts

Figure 8.6 Specifying devices to discover

Figure 8.7 Add Filter dialog box
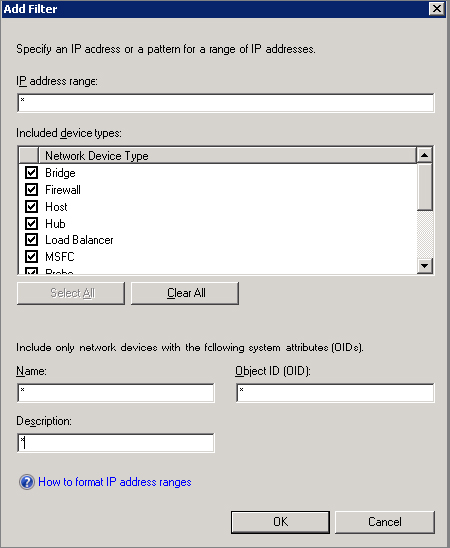
Figure 8.8 Scheduling the network discovery
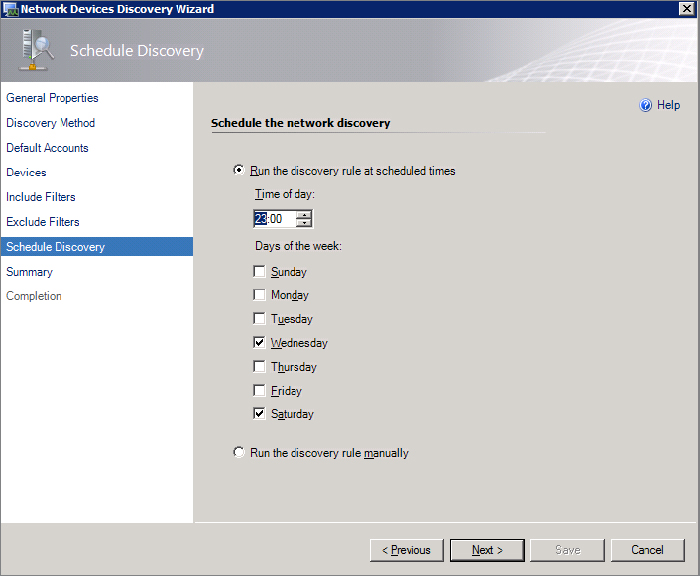
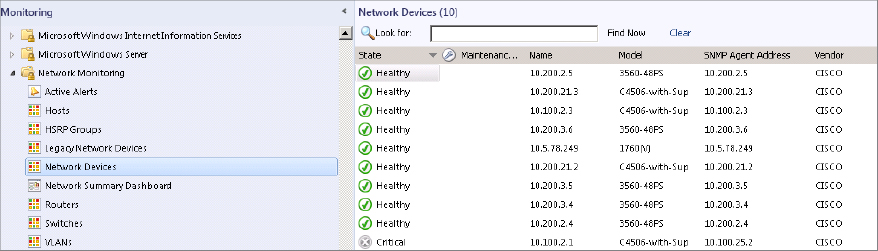
Figure 8.9 Network Devices view
- Right-click the failed device from within the Network Devices Pending Management view and then click Submit Rediscovery.
- Rerun the discovery rule again by right-clicking the rule and selecting the Run option from Administration pane ⇒ Network Management ⇒ Discovery Rules.
Network Device Descriptions
The name that the device is displayed as cannot be changed afterward. If you have a large number of network devices or are even planning the deployment of any new devices into your network, you should spend some time mapping out and configuring the device names and locations so that when you view them within Operations Manager, they have a meaningful description to you.
So, how does Operations Manager choose the name to display for your device? It uses a naming algorithm where it attempts DNS resolution from the following sources, and the first one of them to succeed becomes the name of the device:
What Exactly Gets Discovered?
The discovery that you have just created adds a new discovery rule into the Network Management view of the Administration tab. You know that this discovery rule runs and discovers your device, but what exactly gets discovered on these devices? Well, the answer is that it depends on the manufacturer and model of the network device. On some devices, Operations Manager will discover the memory, DIMMs, processors, ports, temperature sensors, and power supplies. On other devices, it may only discover the interface. As we covered earlier on in this chapter, devices that are listed in the Excel spreadsheet published by Microsoft are certified for extended Operations Manager network monitoring. It’s these types of devices that provide the most detail.
Viewing a Certified Network Device
When you have discovered your network device, from the Operations Manager console browse to the Monitoring tab, expand the Network Monitoring folder, click the Network Devices view, and select your network device. Click the Diagram View link from the Tasks pane on the right side of the screen; this will show a view of the device and all of its components that have been discovered. Figure 8.10 shows a typical diagram view of a certified network device.
Figure 8.10 Network device diagram view

Managing Network Monitoring
Once a device has been discovered, you have a number of methods of viewing it and seeing how it’s performing. As with other objects in Operations Manager, you can take a basic diagram view and look at the device to get a much deeper view of all the child components beneath it. The diagram view is possibly the best place to start managing network monitoring for your device. From inside the diagram, it’s easy to put any of the device components into Maintenance Mode, navigate to different views, and run tasks and reports.
The diagram view gives you granular access to other views such as the alert and performance views and allows you the flexibility to alternate child component management as you wish directly from a central location.
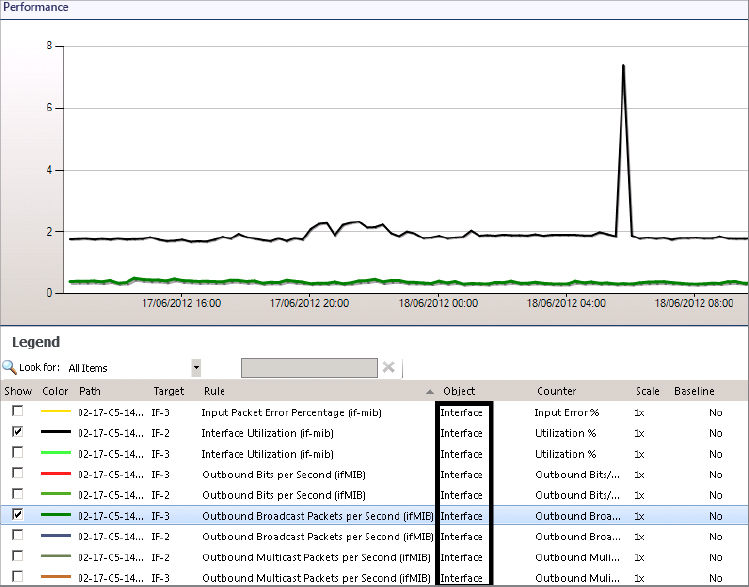
To demonstrate this type of network device management, the following steps will guide you through the process of viewing specific interface performance counters from inside a diagram of the parent (top-level) network device.
Figure 8.11 Opening a network device diagram view
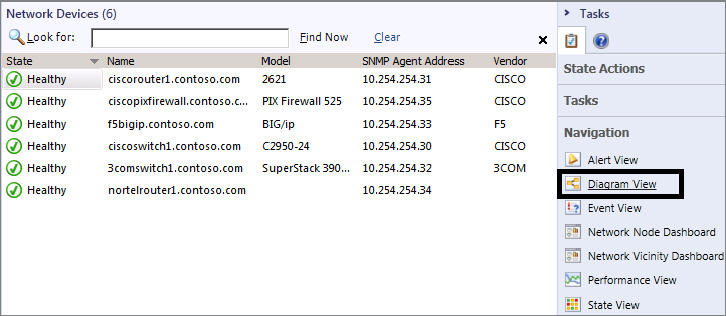
Figure 8.12 Opening a top-level performance view
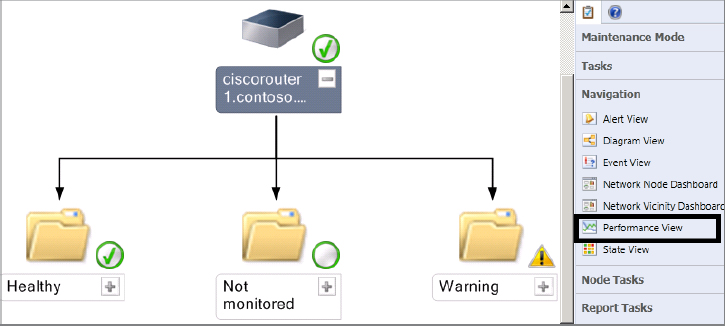
Figure 8.13 Network device performance rules
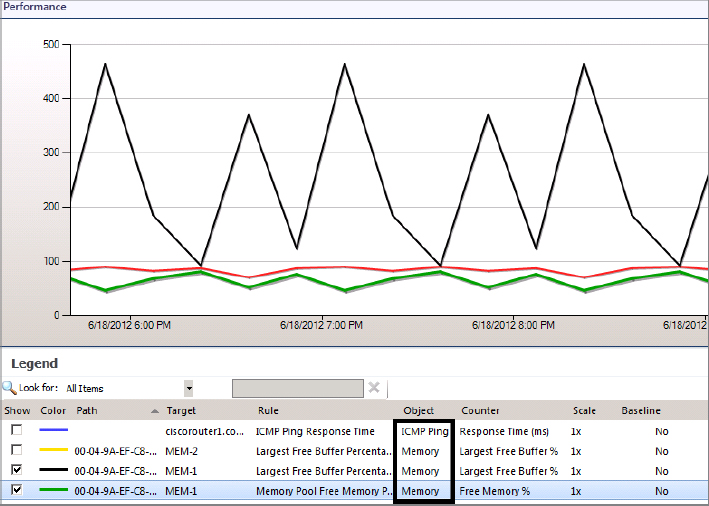
Figure 8.14 Network interface performance view
Reporting on Your Network Devices
With the addition of network monitoring to Operations Manager, you’re probably wondering, “How can I report on the state of a network device?” Aside from the standard availability reports on the devices, you get three new reports to look at the interface and two new reports to look at the device.
Port-Based Reports
- Interface Error Packet Analysis
- Interface Packet Analysis
- Interface Traffic Volume
Device-Based Reports
- Memory Utilization
- Processor Utilization
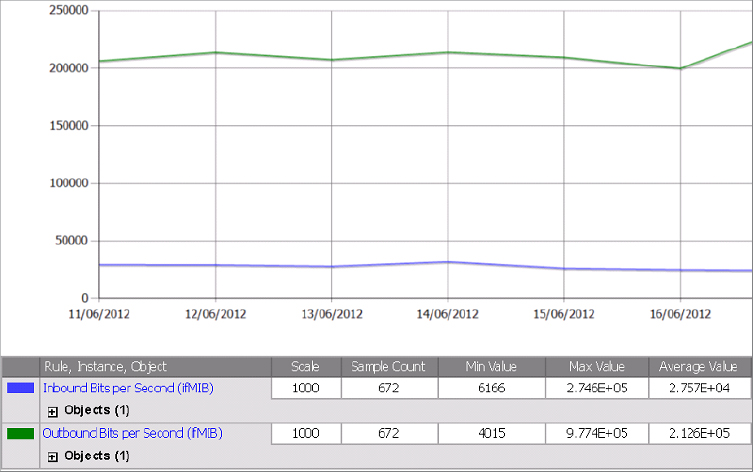
Let’s have a look at the third report in the list—Interface Traffic Volume. The following steps describe what you need to do to run this report against an interface on your network:
Figure 8.15 Interface Report Parameter page
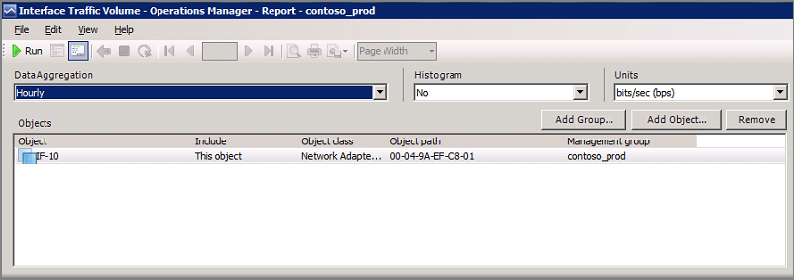
Figure 8.16 Interface Traffic Volume report
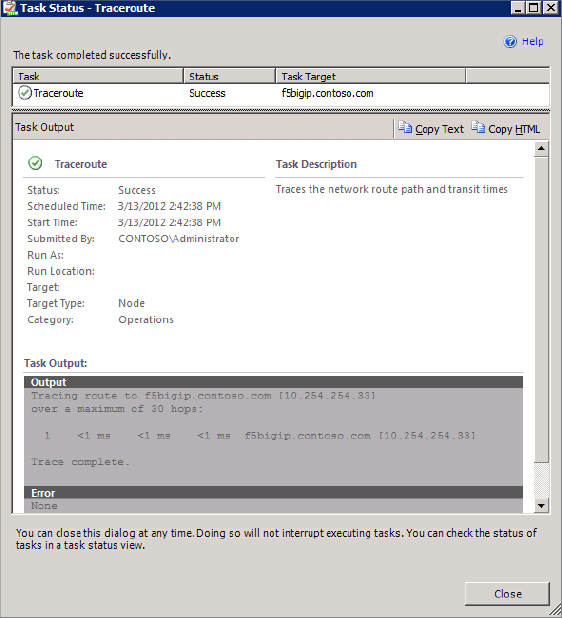
Running Tasks
A key feature of Operations Manager is the customized tasks that come built in with each management pack. These tasks are specific to the alert or object that you are looking at within the different console views. Network Monitoring is no different, and there are a number of tasks that you can use when managing your network devices. The Network Monitoring tasks are as follows:
Figure 8.17 Ping task output
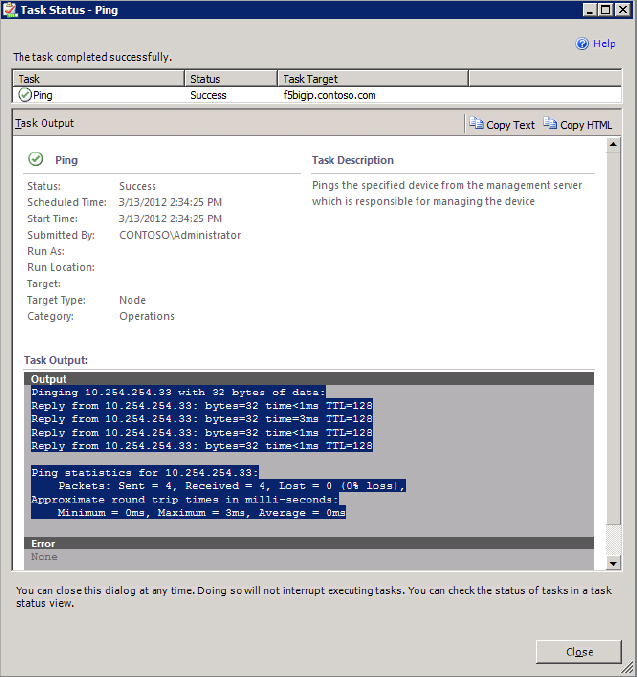
Figure 8.18 SNMP GET output
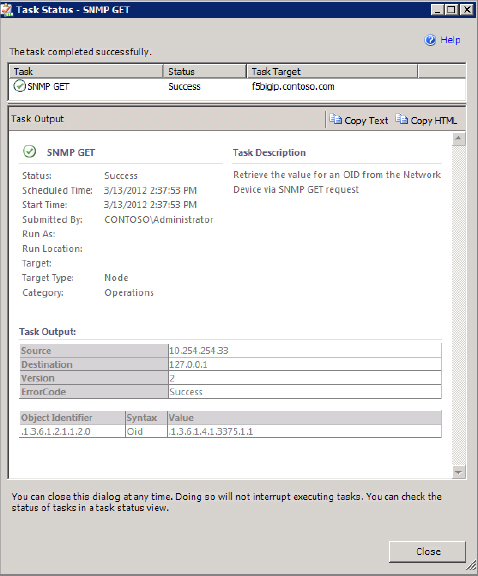
Figure 8.19 SNMP Walk task
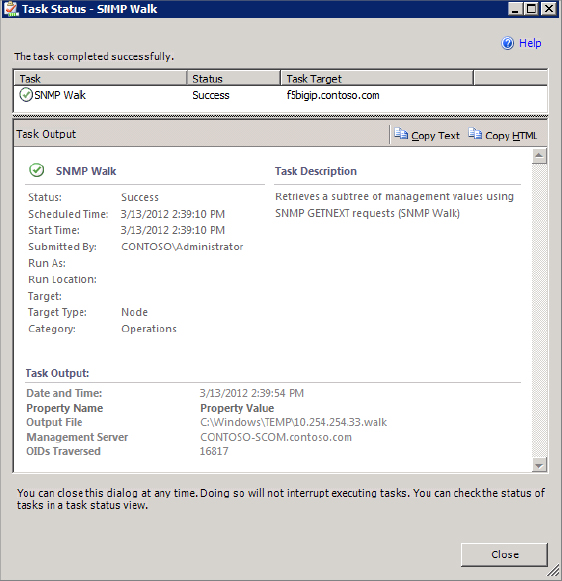
Figure 8.20 SNMP Walk output file

Figure 8.21 Traceroute output dialog box
There are two additional network monitoring tasks that are worth knowing about, and to run these tasks, you need to select a network interface within one of the dashboard or alert views. If you change from the device top level and go directly to the port, you get a different selection of tasks than the previous list. Specifically, these tasks are:
Using Network Monitoring Groups
Now that you are managing the network device in Operations Manager, it’s time to focus on one of the main points of interest for a lot of people: the interface that their server is connected to. It may come as a surprise to you to learn that the default monitoring status for an interface that is connected to a computer is not monitored! Only ports that connect to other network devices are monitored.
This is the best approach, especially when you consider core switches that can contain hundreds of interfaces and VLANs. Monitoring every interface by default would create an unnecessary number of false alerts. For ports that connect network devices together, they are automatically added into a special group that is configured for interface monitoring. Figure 8.22 shows the groups that Operations Manager uses to deal with interface monitoring. If you want to access these groups, browse to the Authoring tab from within the Operations Manager console and select the Groups view.
Figure 8.22 Network monitoring groups
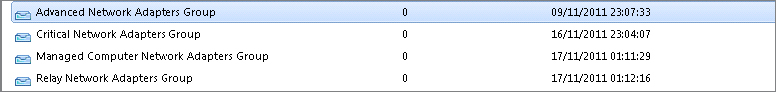
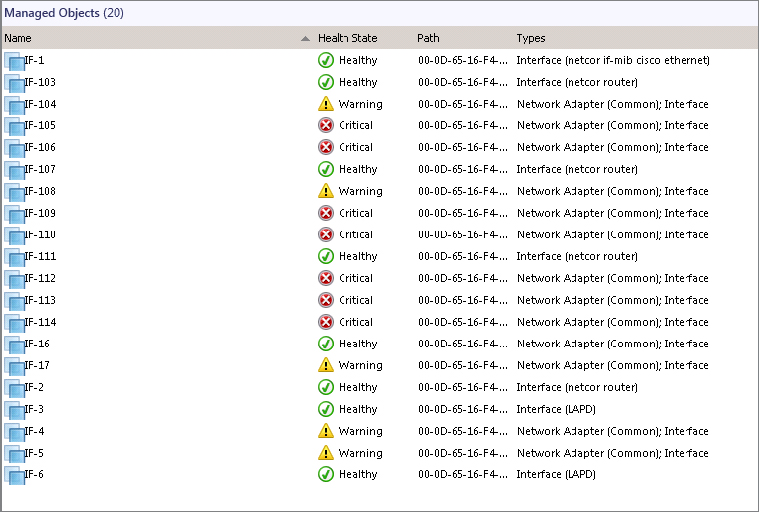
Figure 8.23 Critical interface group members
Server Interface Discovery (Interface Stitching)
When an interface is discovered on a network device—particularly on a switch—Operations Manager will try to ascertain whether there is a server connected to that interface. If a server is connected on that interface, a connection between the two will be made. For this to happen, you obviously have to have discovered both the server and the network device, and for that to be possible, you need to have management packs such as the Windows Server Core OS deployed. If you wanted to show the relationship between the switch and clients like Windows 7, you would also have to have the Windows Client management pack imported and configured. This functionality is known as interface stitching.
The management packs required for interface stitching to take place are:
- Microsoft.Windows.Server.NetworkDiscovery
- Microsoft.Windows.Client.NetworkDiscovery
- Windows Server 2003 Operating System
- Windows Server 2008 Operating System
- Windows 7 Client Operating Systems
- Windows Vista Client Operating Systems
Of course, if you only want to discover servers, you don’t need any of the client management packs. The two Network Discovery management packs are installed by default when you first deploy Operations Manager.
When a server has been stitched to an interface on a network device the server will be displayed on the Network Vicinity dashboard once you select the Show Computers check box. As shown in Figure 8.24, when you highlight the green link between the device and the server and right-click to display the Health Explorer, the Health Explorer’s Availability view will tell you what network interface your server is connected to. In Figure 8.25, you can see the specific port being displayed in the Health Explorer.
Figure 8.24 Network segment link
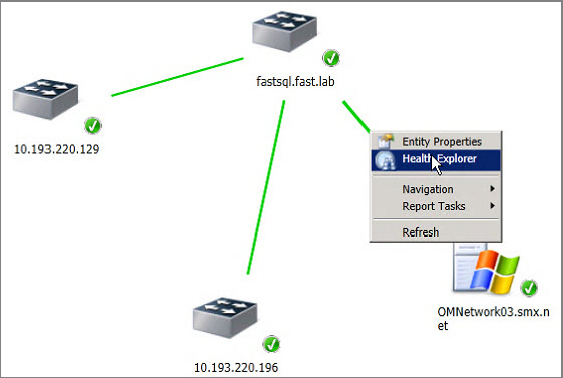
Figure 8.25 Interface stitching

As you learned earlier in this chapter, when a device is being discovered a number of phases run, each going deeper into the device to see what can be discovered. On the third phase, the postprocessing phase, Operations Manager tries to associate the interfaces on a device with the network cards on servers. In the Operations Manager folder in the monitoring pane, the discovery will log two events in connection with the server discovery.
The connection itself is an aggregate of the two endpoints; therefore, you may still see the server unavailable if the switch goes down. There is no root cause correlation as such. This means that if you have a number of servers connected to the switch and the switch goes down, you are still going to be alerted by the many management packs you have loaded on the servers. You will, however, have the opportunity to do some fast route cost analysis via the network state views.
Network Monitoring Dashboards
One of the great out-of-the-box advances in network monitoring is the addition of four new dashboards. Table 8.1 shows the types of dashboards and their descriptions.
Table 8.1: Network Monitoring dashboards
| Dashboard name | Dashboard description |
| Network Summary | Shows the overall health of the network with slowest response, highest CPU, and highest utilization views |
| Network Node | Shows the health of a specific device on the network |
| Network Interface | Displays statistics on individual network interfaces |
| Network Vicinity | Shows a device and all of its interconnected neighbors; has an option to scale out to view Windows computers that are connected to a particular network device |
Let’s start with the Network Summary dashboard. As Figure 8.26 shows, the Network Summary is a seven-pane dashboard that includes all your interfaces by default. You navigate to this dashboard from the Network Monitoring folder in the Monitoring area. This dashboard will be of most interest to the network admins because it’s focused on the performance and throughput of the device. It includes views on the slowest response times, highest CPU, interface utilization, send/receive errors, and so forth.
Figure 8.26 Network Summary dashboard

On the Network Summary dashboard, if you select a node you can then navigate to the Network Node or Network Vicinity dashboard. From any interface you can navigate to the Network Interface dashboard and three specific interface reports, including Interface Traffic Volume.
The Network Node dashboard includes a vicinity view along with availability, response times, processor usage, and details about your instance. As you can track the availability of the device over the last 30 days, it’s a great place to look if one of your applications has had reduced availability over the last month.
In Figure 8.27, the Network Vicinity dashboard contains the same view from the Network Node dashboard but larger. This dashboard view is great when you are looking at large and complex network environments including the servers attached.
Figure 8.27 Network Vicinity view

Figure 8.28 shows the Network Interface view, and you can see the Interface Dashboard focuses on a specific interface and drills into details like the number of bits sent and received, packets sent and received, and utilization. Also from this dashboard it is possible to access interface-specific reports.
Figure 8.28 Network Interface view

Network Vicinity Dashboard Limitations
The Network Vicinity dashboard is one of the best dashboards to come out of this new release of Operations Manager, but there are a few limitations that you need to be aware of. Some of these will be addressed in a later service pack or cumulative update release.
Troubleshooting Network Monitoring
Discovering your network devices and their components in the first place forms the basis of the most common problems that you are likely to encounter when working with Operations Manager network monitoring. This section will discuss some options on how to troubleshoot these types of issues and will help you to get your network devices monitored by the Operations Manager management servers.
Network Device Discovery Problems
The Operations Manager TechNet forums frequently have questions from people requesting assistance when they are unable to discover and add a network device. Once you get the devices into Operations Manager, however, the battle is over, so here are some troubleshooting tips to assist with the network discovery process:
- Are there any firewalls between your management pool and your devices? The firewalls have to allow SNMP (UDP) and ICMP bidirectional communication on both ports 161 and 162 for discovery to work. Try to run a ping command to the device and see if you get a reply back from it, if a ping doesn’t work; it’s possible that a firewall is blocking communication to it.
- A network device may need to have its access control list (ACL) changed to allow the management servers to connect to it. This is a security feature that most enterprise vendors have written into the firmware on their network devices that basically controls the IP addresses on a network that can communicate over SNMP with it. Check with your network administrator or the device vendor for further information on modifying the ACLs on your device and ensure your Operations Manager servers are allowed, at a minimum, read-only SNMP access.
- Many network device discovery problems are related to a simple typing error when entering the SNMP community string to enable monitoring of the device. A good tip is always to write out the community string in Notepad or your word processor and copy it straight from there into the RunAs account that you are using for the discovery. That way, you can be sure that you are entering the correct community string every time.
- Sometimes device discovery will fail if you have specified an incorrect SNMP version when carrying out the initial discovery. As you learned earlier, Operations Manager supports three versions of SNMP—v1, v2, and v3. If you are unsure of the SNMP version that your device supports, try the same rule with different versions until you communicate with the one that works.
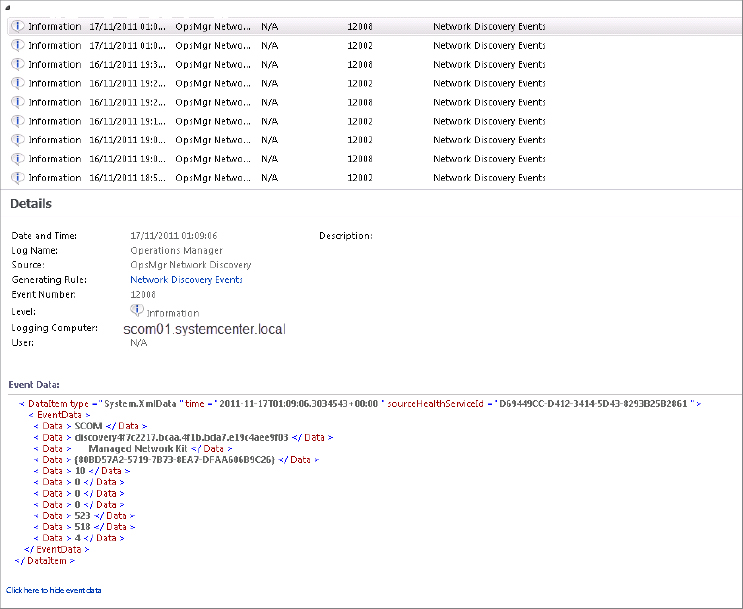
- Use the Operations Manager event logs to get more information on the problem. When a discovery rule has been configured, it’s possible to track the events that are created in Operations Manager through the Windows Event Viewer so as to track what is happening during the network discovery process. There are two events of interest when troubleshooting discovery problems: Event IDs 12002 and 12008. They are both information-based events. In Figure 8.29 you can see these types of events being raised, some event data on the logging computer, and also the discovery rule that has been used to discover the event.
Figure 8.29 Network discovery events
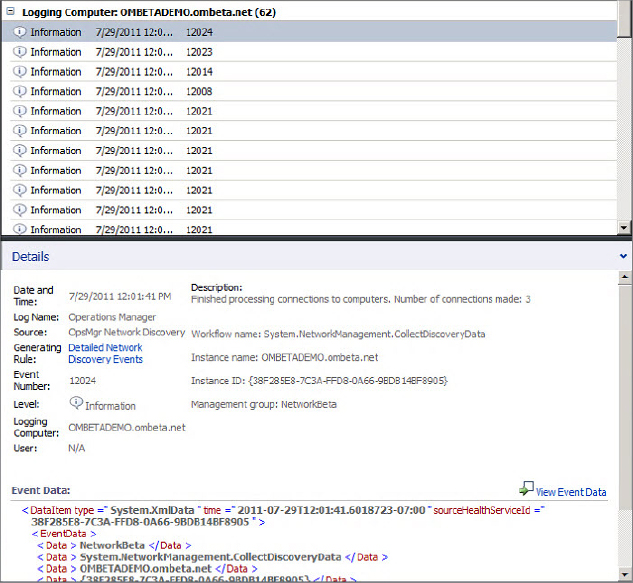
 Two other events of interest are Event IDs 12023 and 12024. The first 12023 event signals that the discovery has entered the device discovery phase. The 12024 event signifies that the device discovery process has finished. When the discovery has finished, the description of the event will tell you how many connections to computers it has made. In Figure 8.30 you can see that Operations Manager has processed and connected three computers to the network device.
Figure 8.30 Port stitching events
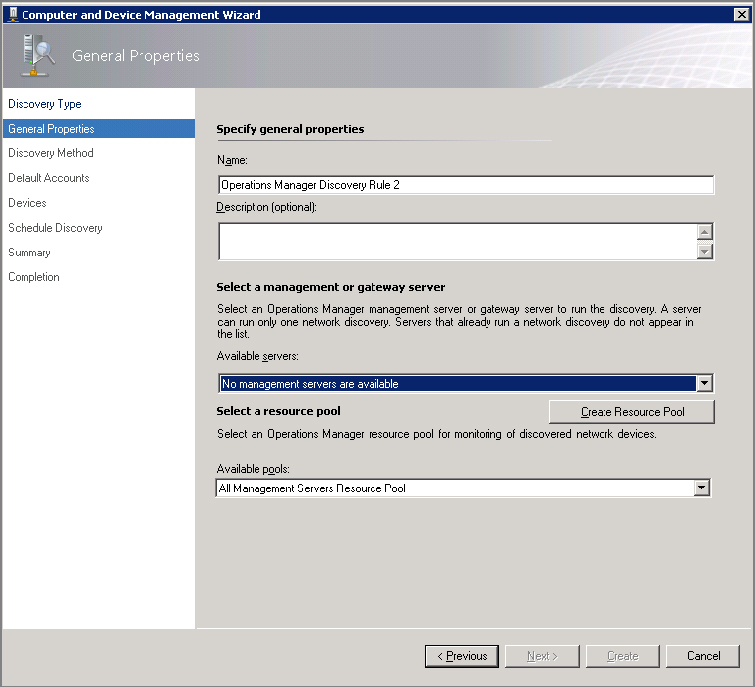
- Each management server or gateway server can run only one discovery rule. If you try to create a new rule and do not have additional management servers to run this rule against, you will see a message stating “No management servers are available.” This restriction is shown in Figure 8.31.
Figure 8.31 Network discovery rule issue
Device Components Not Discovered
Consider this: You configure and run your discovery rule, and all is going well. Your device should get discovered relatively quickly and be ready to view and manage from within the Operations Manager console. When you go to the console to manage your device, you open a diagram view of the device expecting to see a number of components such as Processor, Memory, Interfaces, and so on, but find that it has only discovered a single interface and nothing else!
The reason for this is quite simple and is related to the fact that the particular device is not certified for use in Operations Manager and isn’t listed on the Excel spreadsheet discussed earlier in this chapter. As a result and due to no extended monitoring functionality, you will only be able to discover a minimum configuration for the device using SNMP.