
Chapter 11
Optimizing Your Environment
Nothing runs well if it isn’t tuned. This fact holds true for anything you can think of, from guitars to air conditioners. Operations Manager 2012 requires tuning as well, but we’ll use the fancier term optimizing in this chapter. The goal of optimization is to ensure Operations Manager runs reliably, without any security problems, and at the highest performance possible. Those three goals might seem unattainable, but you can achieve all three to an extent. In some respects, optimization is also a balancing act—you must consider the needs of everyone working with Operations Manager when optimizing the system to ensure it meets all of the requirements but still interacts properly with the administrators who use it.
Part of optimizing a setup is maintenance. Just as you don’t tune your guitar or electronics just once, you can’t tune Operations Manager just once and expect it to continue performing well. Maintenance tells you about the health of Operations Manager and helps you know when you need to perform additional tuning. In short, optimization is a mix of tuning and maintenance applied in such a way that it places minimum stress on the system as a whole. Much of the maintenance you perform is during off-peak times to reduce the impact of the maintenance on the system.
In this chapter, you’ll learn how to:
- View management pack optimization as an opportunity
- Optimize rules to improve reliability, security, and performance
- Configure self-tuning thresholds to make monitoring more efficient
Optimizing Management Packs
Once you install System Center 2012 Operations Manager, you will have access to a list of predefined management packs created by Microsoft. Most eager administrators will go ahead and import every single management pack that is available to them. It’s understandable; if the management pack is there, there must be a reason for it. However, there is no reason to import a SQL Server 2005 management pack if you only have SQL Server 2008 R2 in your network. Do not make that mistake! The first rule of optimization is to use the minimum required services to achieve your goal. When it comes to Operations Manager, you want to ensure only the management packs that your environment needs are imported. Moreover, these management packs should be tuned prior to being imported into your production environment.
You still need to tune the management packs that you import. The fact that you imported the SQL Server 2008 R2 management pack to monitor your database servers does not mean that your servers will be monitored according to your needs. The management packs you receive contain settings that are more on the order of a guideline than an absolute requirement. In fact, the management packs are tuned to meet the needs of the average system, an elusive beast that doesn’t really exist.
The first step in optimizing a management pack is locating settings that don’t quite match your system setup and changing them. You don’t have to change every setting—just those that don’t meet your needs. Of course, that means spending some time looking at the settings, which isn’t always easy to do given the time constraints of most administrators. Even so, it’s important to at least try to look for targets of opportunity in the tuning scheme. Every management pack released by Microsoft has a management pack guide. Make sure you download and study the guide. It contains important information about the settings used in the management pack and will allow you to identify which settings can be tuned for your environment.
Other than using the System Center 2012 Operations Manager console to view settings for management packs, there are three important tools that every Operations Manager administrator should have: MPViewer, OverrideExplorer, and Proxy Settings. These tools are free and can be downloaded here:
http://blogs.msdn.com/b/dmuscett/archive/2012/02/19/boris-s-tools-updated.aspx
MPViewer allows you to view settings from any given management pack and export those settings to Excel. Once in Excel you can manipulate the data for easier viewing. OverrideExplorer works in a similar way, allowing you to list existing overrides and exporting them to Excel. Proxy Settings can be used to list all servers and their specific agent settings.
Most management packs available cannot be directly changed. The developer who created the management pack probably sealed it, making it impossible to change from the Operations Manager console. However, if you want to, you can use MPViewer to unseal the management pack and make changes to it. Although possible, we do not recommend that you do so. Instead of unsealing a management pack, you should create overrides to change the behavior of different objects in the management pack. These overrides, along with any new objects that you create, must be saved in their own management pack when dealing with sealed management packs. For unsealed management packs, you can create the override on the management pack itself, or in a new management pack. We prefer, and recommend, the use of a new management pack for all overrides. This gives you better control of your environment and maintains your overrides in case the original management pack is updated. Your new, customized management pack provides the means to store the settings for later use on another system or as a way to back up the changes you’ve made. The following sections describe both requirements.
Identifying Useful Settings
Management packs include hundreds, sometimes thousands, of settings. Going through all of these settings one at a time probably isn’t the best way to find the settings you need to change. A useful setting is one that can help the management pack perform better. For example, when a management pack samples the status of workstations on your network too often, it wastes server resources and slows everything down. You can use the Performance console to monitor the various Operations Manager features and locate items that are consuming many server resources.
It is also important to monitor the amount of space used by objects in the Operations database. Kevin Holman wrote a detailed blog entry with a list of important queries you can use to verify space consumed by object, total database size, and number of alerts generated daily, among other useful management data. His blog entry can be found here:
It’s also possible to use the OpsMgr Connector object on the workstation to determine how the setup is affecting the workstation and therefore the server as a whole. After viewing how Operations Manager is working on the systems, you can decide which areas are consuming too many resources and then look for settings to make Operations Manager work more efficiently.
Once you have a basic area of concern to consider, open the Monitoring tab. Look in the Operations Manager folder for areas of interest. For example, you might want to look in the MonitoringOperations ManagerAgent DetailsAgent Performance folder shown in Figure 11.1 to see how the agent is performing when you have a problem in that area. You might find that the Health Service object is consuming a lot of processing cycles and want to create a rule override to control it.
Figure 11.1 Use monitoring tools to check the performance of the management packs.

Performance monitoring isn’t your only tool in gauging the usefulness of the management packs you have installed. You can use Task Manager to verify processes that are running on the server and the agent, Process Monitor to gather more details on these processes, and Event Viewer to verify errors and warnings from different applications running on the server and the agents.
For example, you should use the Event Viewer console to check the various event logs—not just the one associated with Operations Manager. Innocuous warnings might point to a need for additional monitoring. For example, you might find that systems with a particular CD drive tend to fail regularly, so adding a rule to monitor the CD drive activity is a good idea. Of course, you won’t know about this issue until you check the event log or the CD actually fails (CDs often don’t fail immediately—the event log will simply say it couldn’t read the CD at a given time and then the CD will work again for a while).
The event logs don’t always have all the answers you need, however. You should also include your maintenance logs and discussions you encounter online as resource information for finding settings that need a tweak in Operations Manager. It’s important to know what the management pack does as part of this research. For example, you might have installed the Microsoft SQL Server management pack. To understand the information that the management pack is providing, you can look in the MonitoringMicrosoft SQL ServerHealth MonitoringAgent Health or Database Engine Health folder shown in Figure 11.2. Notice that you can detect the state of SQL Server 2008, along with any alerts that have occurred, making it easier to determine whether you need additional monitoring of this application.
Figure 11.2 Monitoring the activity of management packs can give you clues about which settings to change.

Customizing Management Packs
Once you have a list of issues for Operations Manager, you’ll want to implement them in some way. The management packs you receive from third-party vendors are normally sealed. A sealed management pack contains a host of settings that you can’t change, which would seem to defeat the whole purpose of looking for settings to change.
Management packs are sealed for two reasons: to protect intellectual property and to ensure that the management pack does not cause any issues inserted by changes to the existing objects. Take the SQL management pack, for example. Microsoft’s engineers used their ample knowledge of the product, along with issues encountered by customers and the internal IT team at Microsoft, to create this management pack. If the management pack is not sealed, someone can make changes to it, perhaps necessary changes for their environment, that would not work well in other environments. Now this changed management pack could be made publicly available and wreak havoc for other Operations Manager customers.
However, you can use overrides to customize sealed management packs. For example, you can disable a rule found in the sealed management pack and create your own version of the same rule (see the “Optimizing Rules” section later in this chapter for additional details on creating rule overrides). You can create overrides for the following:
- Monitors
- Object discoveries
- Rules
Overrides can be used to simply disable one of these objects, or change the way they behave based on overridable parameters. These parameters are created in the management pack and used in one or more objects in the management pack. Make sure you know which rules and monitors use a given parameter before overriding it. If overridable parameters are not created, you will not be able to override the settings of an object. All you can do is disable the given object.
You can place the overrides in a new management pack. Having the new rules in a custom management pack places all of them in one location where you can easily find and modify them. And it is a common recommendation to create a management pack to host your customizations for each sealed management pack you import. Avoid creating your custom objects and overrides in the default management pack. It is better to have a separate management pack for management purposes. That way, you can easily find all overrides or custom objects for a given management pack.
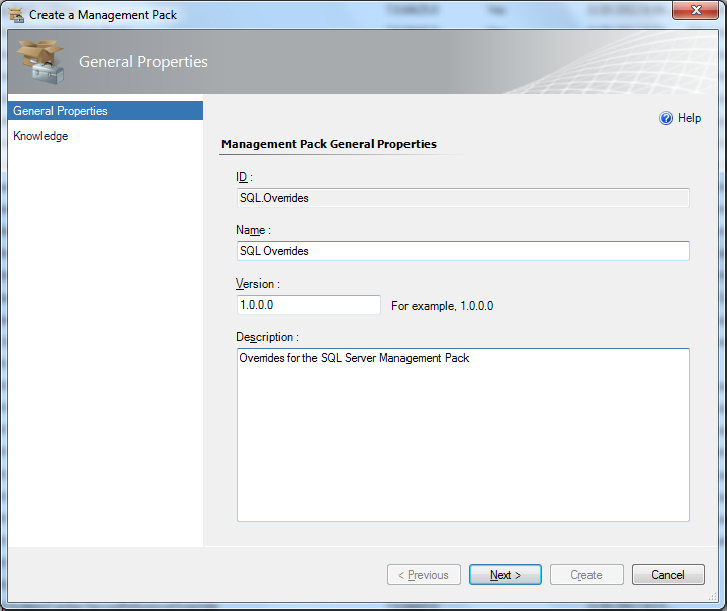
Using a custom management pack makes it considerably easier to move the custom monitors, object discoveries, and rules around. It also makes it easy to create a backup of your custom settings (see the “Backing Up Management Packs” section of Chapter 12, “Backup, Restore, and Disaster Recovery,” for details). Consequently, creating a custom management pack not only makes the changes clearer, but also helps you preserve the work you’ve done when disaster strikes. The following steps describe how to create a custom management pack:
Figure 11.3 Define the identifying information for your management pack.
Optimizing Rules
Most management packs you install create rules, monitors, and discovery objects. These objects control how the management pack affects the Operations Manager setup—how Operations Manager scans the systems on your network for adverse changes. The rules appear in the AuthoringManagement Pack ObjectsRules folder, as shown in Figure 11.4.
Figure 11.4 Management pack rules change the way Operations Manager interacts with systems on the network.

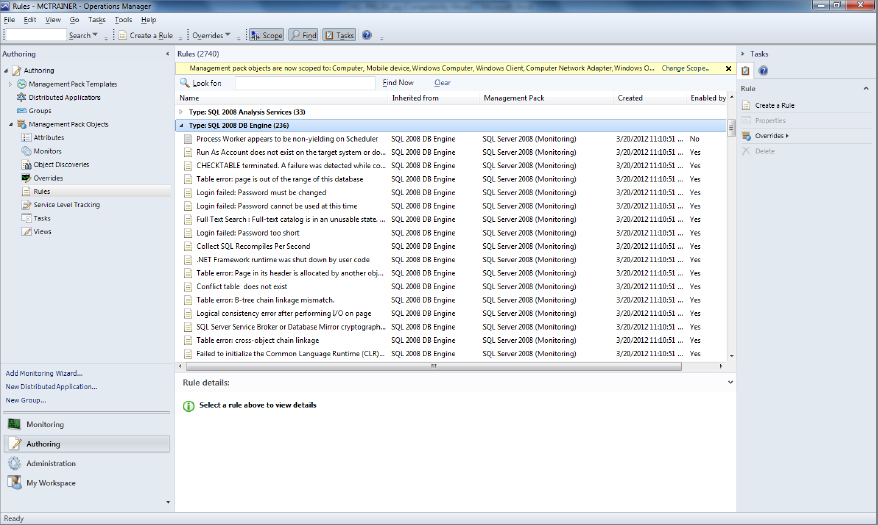
The Rules pane contains entries grouped by type. Types are defined in management packs. When you open a particular type, you see the individual rules, such as those shown for SQL 2008 Database Engine in Figure 11.5. Double-click a rule so that you can open it for optimization purposes.
Figure 11.5 SQL 2008 Database Engine rules
The following sections describe some of the ways in which you can optimize rules and monitors (see the “Exploring Management Packs” section in Chapter 5 for additional information on working with rules and rule groups). You’ll discover techniques for modifying existing rules and monitors and creating new ones. In addition, you’ll discover the nuances of self-tuning threshold monitors and optimizing performance counters used in rules and monitors.
Modifying Existing Rules
As previously discussed, there are two types of management packs: sealed and nonsealed.
Sealed Rules
Sealed rules normally come from vendors. You can only enable or disable a sealed rule, or change its knowledge base and alert settings. You can certainly see the settings, but you can’t modify the information on them.
To add an entry to this tab, click Edit. If you have the proper support installed, Operations Manager will start a copy of Word on your machine. You’ll see a blank knowledge article. When you finish making your comments, click Save in Word and then close the Word document. At this point, you’ll see the knowledge article you created in the Company Knowledge tab. Click Save to save the article.
You’ll eventually find that some of these sealed rules don’t work as anticipated. For example, you might find that a vendor samples data from your network too often or hasn’t taken a configuration issue on your system into account. Consequently, the inflexibility of a sealed rule can be a problem. An override provides a means of telling Operations Manager not to use a particular rule with an object. You can also override parameters to make the rule work better with your system.
The Overrides tab, shown in Figure 11.6, provides the means of overriding certain aspects of the rule. You can choose to disable the rule completely for some objects, or you can choose to override a parameter. Disabling the rule means that Operations Manager won’t use it at all. Overriding a parameter means that Operations Manager uses the value you supply, rather than the default value.
Figure 11.6 Define overrides for your rule using the options on the Overrides tab.
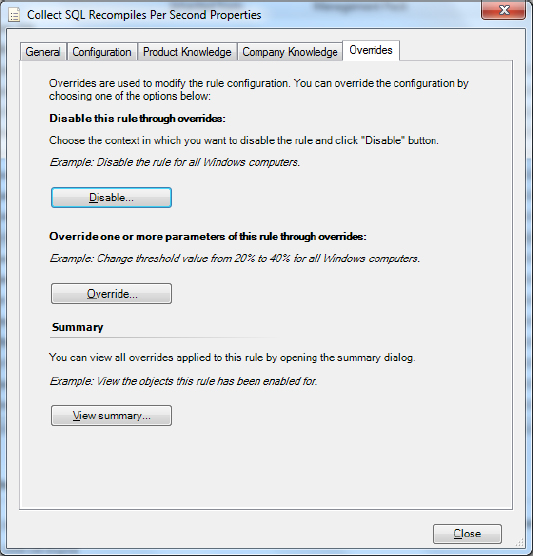
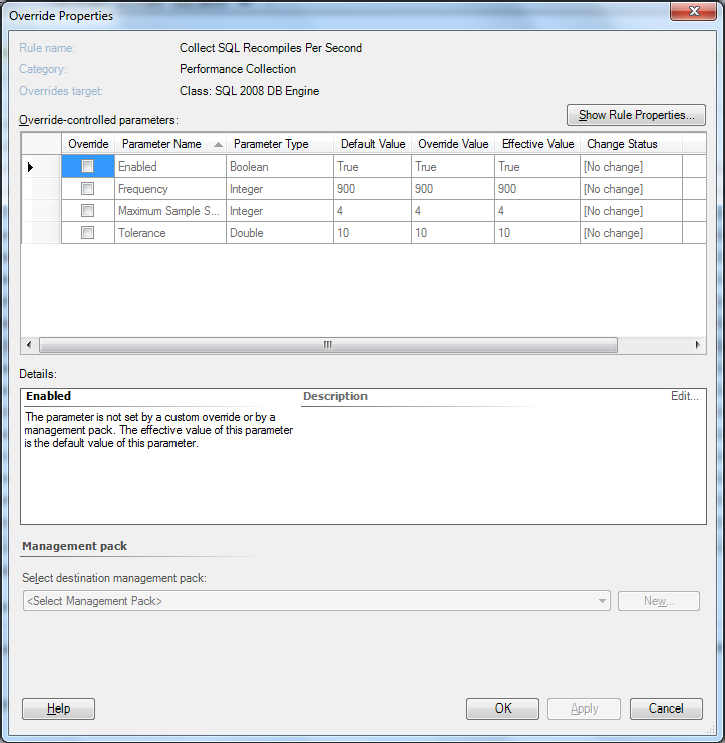
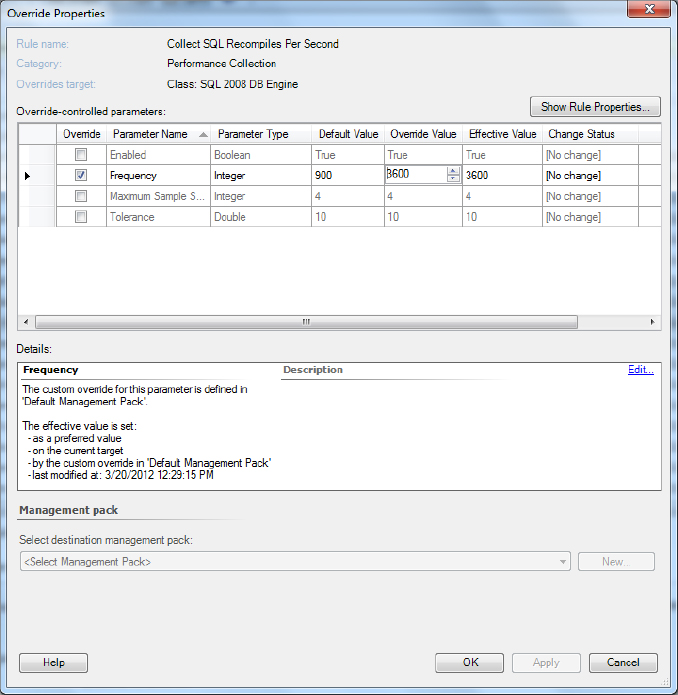
Imagine that you are using the Collect SQL Recompiles Per Second Rule. By default, this rule sends data to the management server every 900 seconds. In your environment, there may not be that many recompiles. And you do not want to make a connection every 15 minutes. An override can be used to change that. To create an override, follow these steps:
Figure 11.7 Define overrides for your rule using the options in the Overrides Properties dialog box.
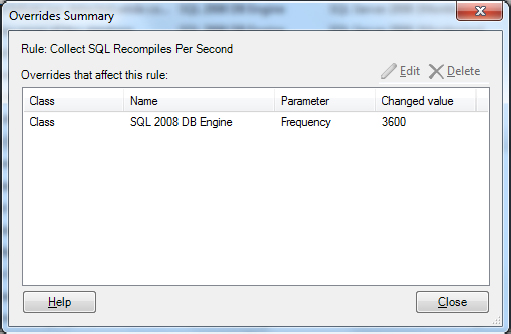
When you finish making changes to the overrides, you can right-click the rule and click View Summary to see the results, as shown in Figure 11.8. You can choose to view the overrides for the rule as a whole or just for the currently selected object.
Figure 11.8 Use the Overrides Summary dialog box to edit and delete overrides you created earlier.
When you disable a rule or override a parameter, you have a choice of what to disable or override. Clicking Disable or Override displays a menu of options that includes the following:
- The current object as a whole. (For example, when you choose the Computer object, Operations Manager disables or overrides the rule for all computers.)
- A particular group.
- A specific object of the current type (for example, a specific computer on the network).
- All objects of another type (such as Computer).
After you make a selection, Operations Manager displays a list of appropriate objects. You select the object you want to modify and click OK. At this point, you’ll see the Override Properties dialog box shown in Figure 11.9 when working with a parameter override. Check the parameter you want to override, choose the override value, and then click OK. When disabling a rule, Operations Manager simply asks whether you’re sure you want to disable it. Click Yes to complete the process.
Figure 11.9 Choose the parameter you want to override and choose a new value for it.
After you complete the configuration process, you can click OK to save the changes. Make sure you test the new rule to ensure it works as anticipated. For example, if you’re working with a performance rule and you change the sampling interval to reduce the amount of work Operations Manager must perform, make sure that you’re still sampling the object often enough to obtain valid statistics for it. Otherwise, Operations Manager could see an error condition long after it’s time to fix it.
Customized Rules
When you work with an object that isn’t sealed, such as one that you’ve created yourself, you’ll see only four tabs instead of the five shown in Figure 11.6. The dialog box won’t include the Company Knowledge tab because you can modify the rule information using the Product Knowledge tab instead. The process for performing the edit is precisely the same as you use for the Company Knowledge tab.
The General tab contains the name of the rule and its description. Although Microsoft tries to tell you that the description is optional, providing a detailed description is always helpful because it makes the purpose of the rule clearer. Even though the person using the rule can get details on the Product Knowledge tab, sometimes all the person really needs is a good overview. The Description field can provide this overview for the user. The final entry on the General tab is the Rule Is Enabled option. Check this option when you want to make the rule active, and clear it when you want to disable the rule.
The Configuration tab, shown in Figure 11.10, helps you configure the rule. The dialog box contains two sections. The upper section, Data Sources, controls the rule input. When you click Edit, you’ll see the data source you provided when creating the rule, such as the performance counter information shown in Figure 11.11. The content of this dialog box changes according to the kind of data source you choose when creating the rule (see the “Creating New Rules” section later in this chapter for details). You can change the actual data collection information in this dialog box easily. However, you can’t change the optimization information shown on the Optimized Collection tab. To change the optimization information, you must create a new rule.
Figure 11.10 The Configuration tab makes it possible for you to change how the rule works.
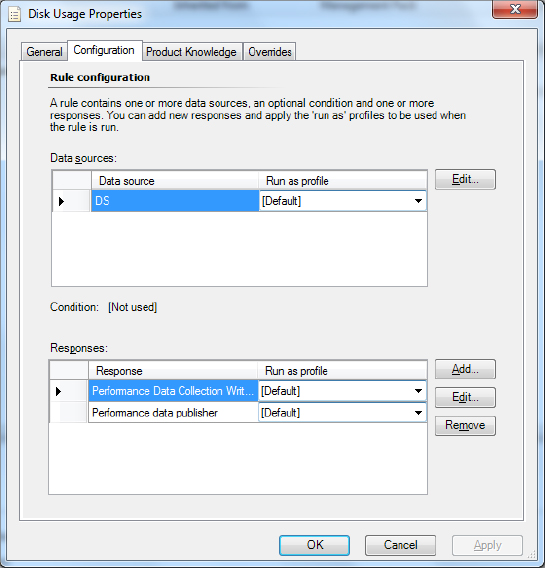
Figure 11.11 A data source dialog box changes according to the kind of data source the rule uses.

The lower section contains information on how the rule reacts to new input. You can add new responses, edit existing responses to match the requirements of your setup, and remove responses you don’t need.
When you click Add, Operations Manager displays a menu that asks whether you want to create a command or a script entry. In both cases, you’ll see a beginning dialog box where you type the name of the new response. It’s important to provide a descriptive response name so that others don’t have to figure out what you intend by the new entry. When you click OK, you’ll see either a Script (Figure 11.12) or a Configure Command Line Execution Settings (Figure 11.13) dialog box where you can provide the particulars for the new script or command. When working with a script, you provide a script name, timeout value, the actual script content, and any parameters the script requires. When working with a command, you simply provide the path, arguments, and working directory for the external executable program.
Figure 11.12 Create a new script to perform scripted tasks within Operations Manager.
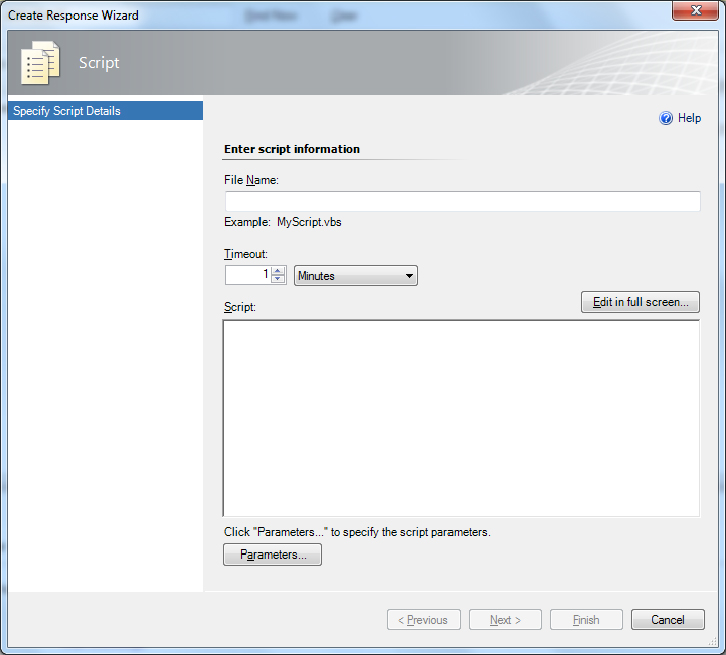
Figure 11.13 Create new command-line settings to tell Operations Manager which external application to use.

Editing an existing script or command is similar to creating a new response, except you don’t have to provide a script or command name. When you want to remove a script or command you no longer need, highlight the entry and click Remove.
Creating New Rules
The settings you get with a management pack are unlikely to fulfill every need. For example, you might have a problem segment on a network and want to check that segment regularly to ensure it’s still providing good throughput for the users. A management pack developer won’t know to include that rule because it’s particular to your installation. As you work with Operations Manager, you might find yourself wondering whether a particular management feature provides enough information. You can always add more information by defining your own rules. Creating new rules provides the means for overriding existing management pack functionality and makes the management pack work more as you expect it to.
Once you decide to create a new rule, you have to consider how to create it. Of course, one of the considerations is the kind of rule you want to create. The “Using Rules” section of Chapter 5 provides a complete description of the various rule types. However, here’s a quick list you can use for the example in this chapter:
- Event Based
- Generic CSV Test Log
- Generic Test Log
- NT Event Log
- SNMP Event
- SNMP Trap
- Syslog
- WMI Event
- Performance Based
- SNMP Performance
- WMI Performance
- Windows Performance
- Probe Based
- Script (Event)
- Script (Performance)
- Timed Commands
- Execute a Command
- Execute a Script
When you create a rule for optimization purposes, it’s important to consider the rule that it replaces. Make sure you record any information about the old rule before you begin creating the new one. The following steps describe how to create a rule to override an existing one:
Figure 11.14 Choose the type of rule you want to create for optimization purposes.
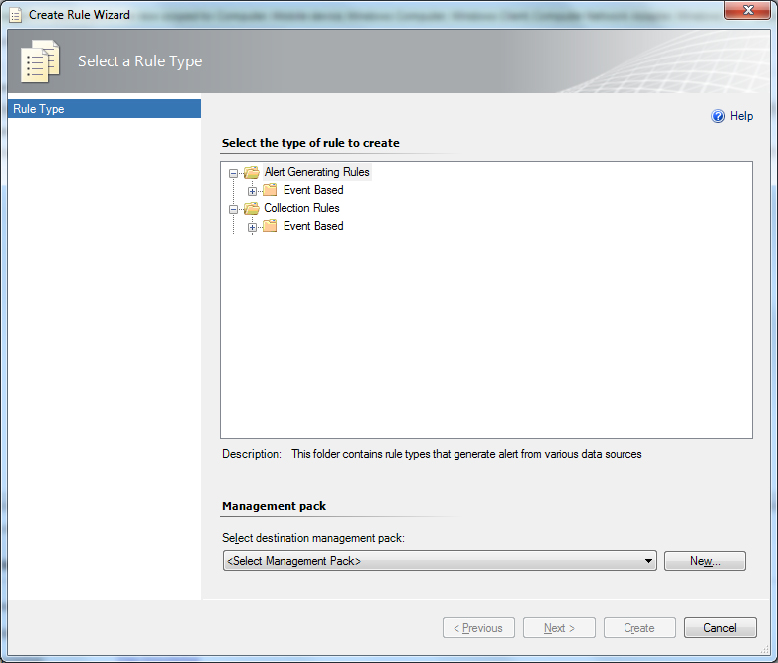
Figure 11.15 Provide a name, description, and rule target for the new rule.

Figure 11.16 Choose a target type for the rule.
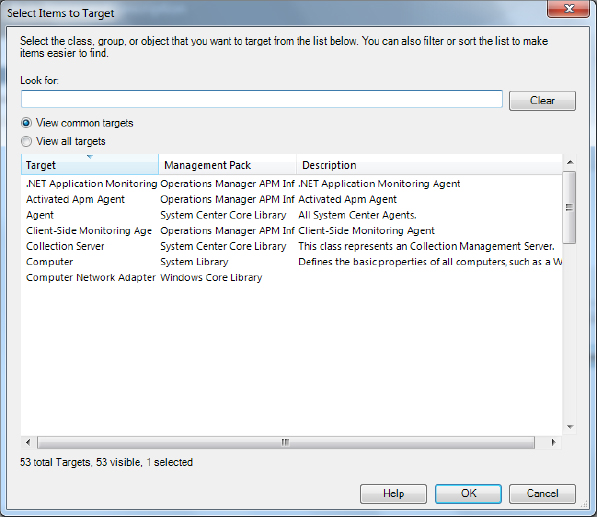
Figure 11.17 Choose an optimization setting for your rule to ensure it works as efficiently as possible.

Self-Tuning Thresholds
What is normal? Many people ask this question, yet no one can seem to answer it because there isn’t a correct answer. The question of normal depends on a significant number of factors. One system may have different normal operating characteristics even if it uses precisely the same hardware as another system. In the past, the lack of a definition for normal caused significant problems for administrators because a monitor set up for one machine probably wouldn’t work for another machine even when both machines were in their normal state.
Understanding Self-Tuning Thresholds
Self-tuning thresholds provide a way around the whole question of normal. The monitor you create goes through a learning process where it discovers what normal means in a specific situation. As the monitor continues tuning itself, the number of alerts the administrator sees decreases until alerts appear only when something is truly wrong with the system. Of course, you have to begin with a baseline threshold or the learning process would seem quite long indeed. Operations Manager automatically establishes a baseline for new monitors based on usage patterns and other data it acquires as it monitors the system.
A threshold can occur in a number of ways and the method of reacting to them varies according to the way you design the monitor. Monitors have to check for three conditions:
- The area above the baseline (a)
- The area within the baseline (w)
- The area below the baseline (b)
These three areas are important. For example, a CPU monitor may see the area above the baseline as anything over 90 percent. The area within the baseline may include everything from 10 percent to 89 percent. The area below the baseline may include everything 9 percent or less. The combination of these three areas defines the entire range of possible values, whether or not the device can achieve a particular value. Because monitoring situations vary, Operations Manager provides two different categories of self-tuning thresholds:
Viewing a Performance Baseline
To work with self-tuning thresholds, you need to know about performance baselines. You can create a performance baseline to monitor any object that Operations Manager supports. For example, you can track the amount of memory that the server uses on average. It’s often helpful to view the performance baseline of a particular object before you create a self-tuning threshold to monitor it. The following steps describe how to view a performance baseline:
Figure 11.18 Define a new performance view to see a performance baseline.
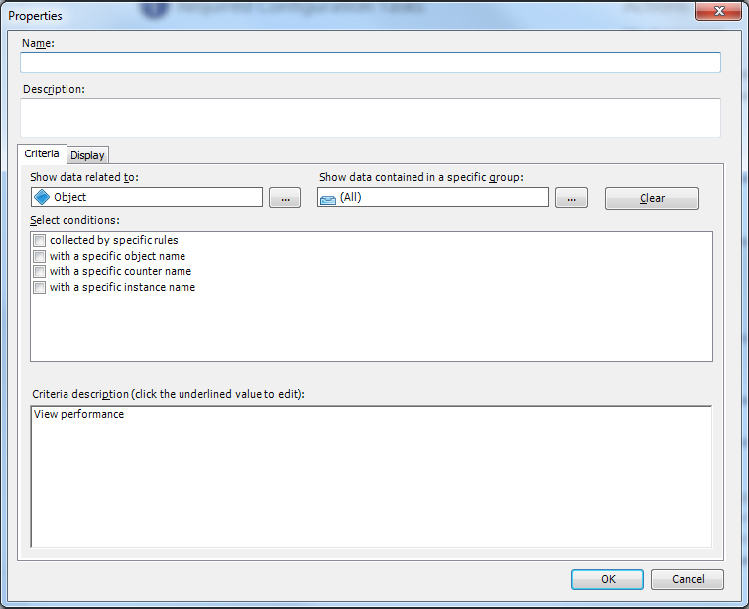
Figure 11.19 See the performance baseline for DB Total Free Space (MB).

Defining a Self-Tuning Threshold
You can define a self-tuning threshold for any monitoring need that doesn’t have a specific (static) range. It’s important to keep the learning nature of this kind of monitor in mind because the initial monitor may raise alerts when there really isn’t a problem. As the monitor learns the range of the object that it monitors, you’ll see fewer false alarms and considerably more true alerts. The following steps describe how to create a self-tuning threshold:
Figure 11.20 Choose a scope for the new monitor.
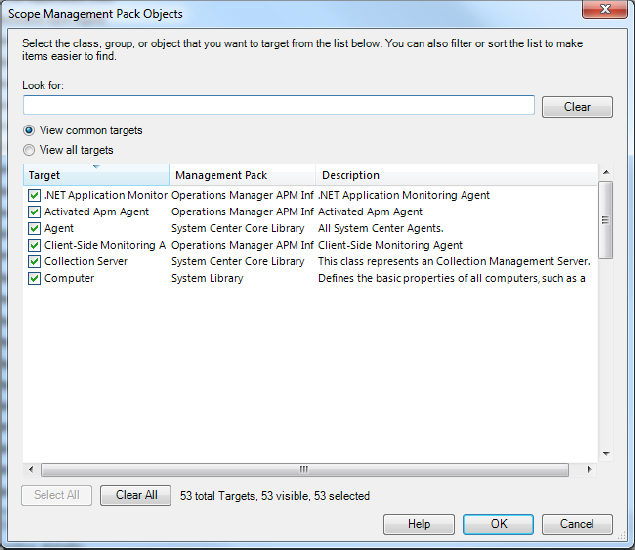
Figure 11.21 Verify that Operations Manager has selected the object you want to work with.
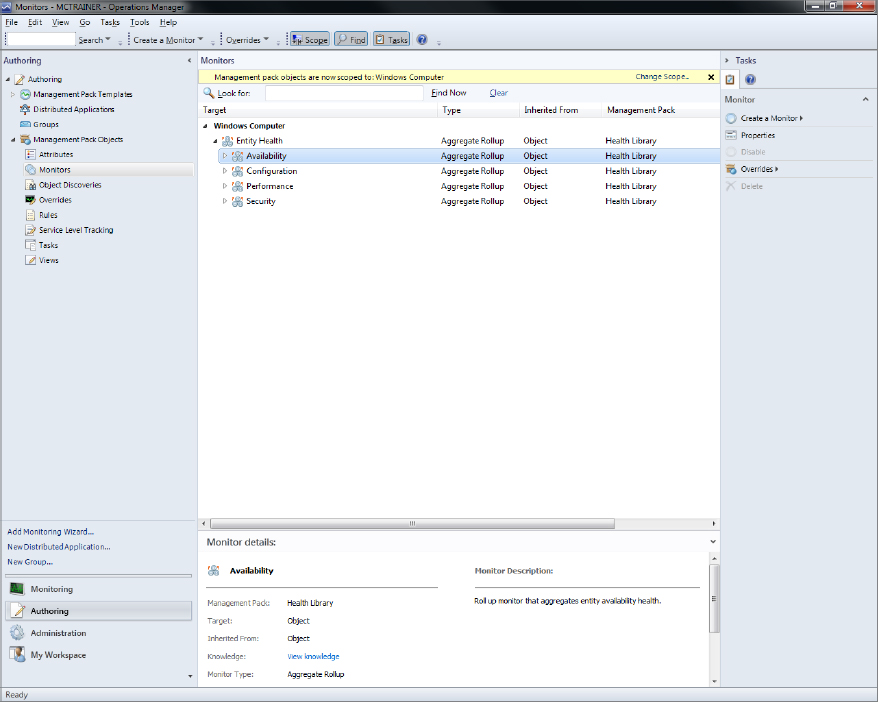
Figure 11.22 Choose the kind of monitor you want to create.
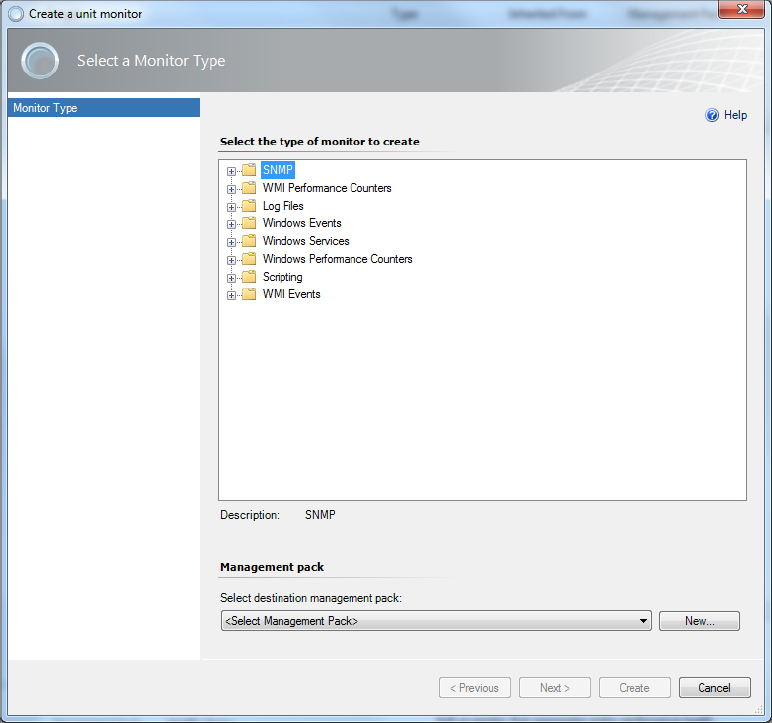
Figure 11.23 Provide a description of the self-tuning threshold that you want to create.
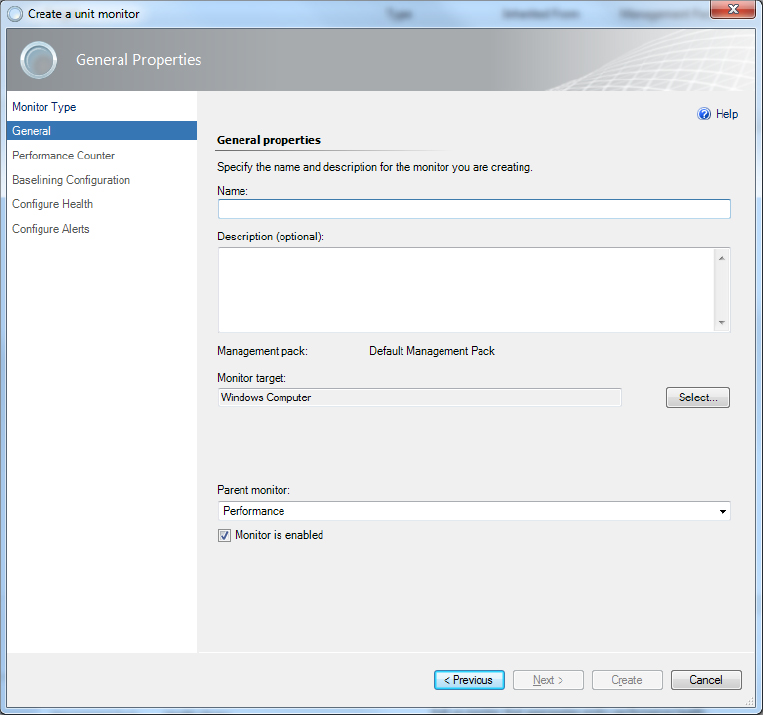
Figure 11.24 Choose the performance object, counter, and instance you want to monitor.

Figure 11.25 Use this dialog box to make performance information selection easier.

Figure 11.26 Set the information used to create a baseline configuration for the monitor.
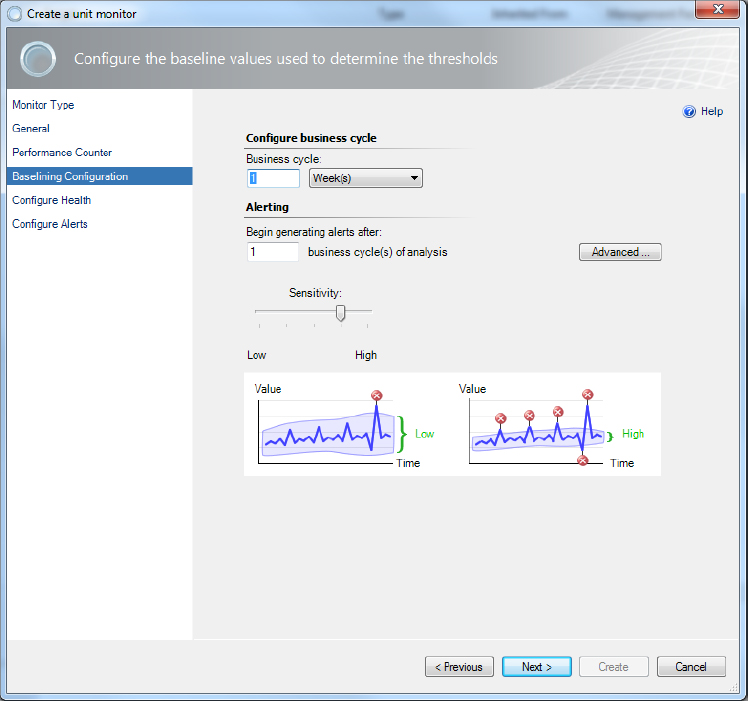
Figure 11.27 Set the limits that define the health of the monitor.
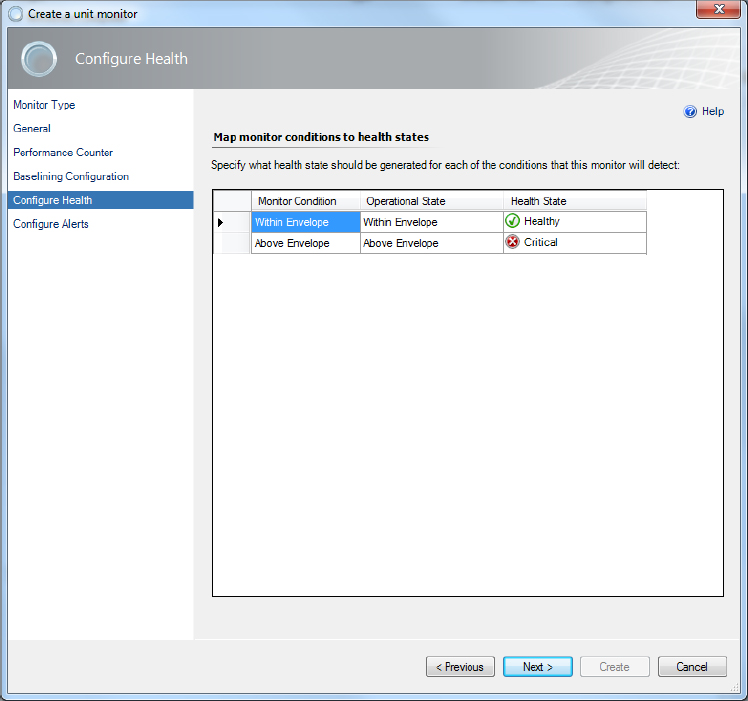
- Critical
- Warning
- Healthy
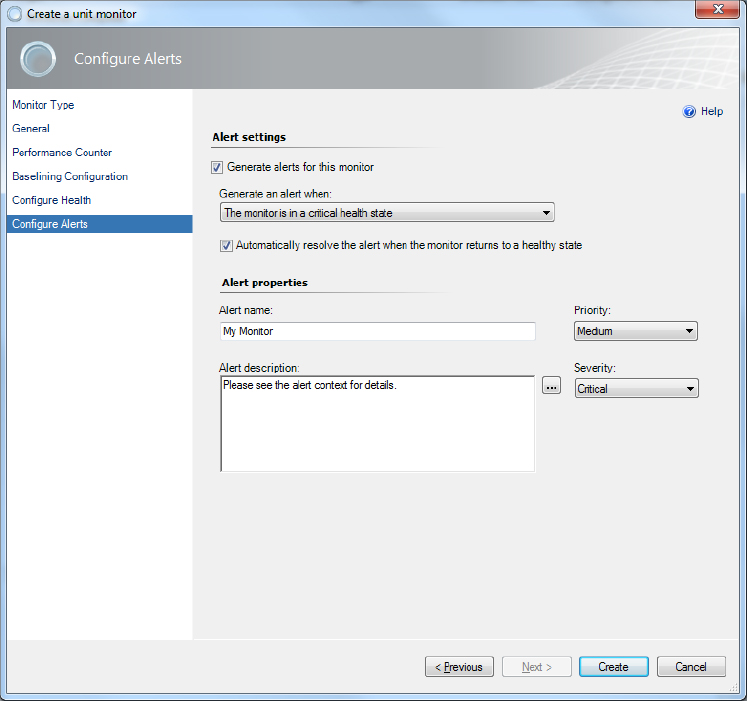
Figure 11.28 Create an alert for the self-tuning threshold when you need to know about critical conditions.
Optimized Performance Counters
Performance counters are simple in theory but can become quite a resource sink in practice. There isn’t anything magic about a performance counter; it simply counts something. The focus of a performance counter is an instance of a particular object, such as a core in a processor. The particular counter determines what the counter is counting. For example, it may count the number of user tasks performed per second. In many cases, you can also tell a counter to focus on one particular object only, rather than all the objects of a given type. For example, when working with a multiprocessor system, you can choose to count only the user tasks for the second processor, rather than all the processors in a system.
You can’t really change anything about a performance counter—a developer builds it into the code. However, you can change how you use the performance counter with Operations Manager. The two criteria for performance counter optimization are as follows: