Chapter 13
Monitoring VMware vSphere Performance
The monitoring of VMware vSphere should be a combination of proactive benchmarking and reactive alarm-based actions. vCenter Server provides both methods to help you keep tabs on each of the VMs and hosts as well as the hierarchical objects in the inventory. Using both methods ensures that you aren't caught unawares of performance issues or lack of capacity.
vCenter Server provides some extensive features, such as expanded performance views and charts, for monitoring your VMs and hosts, and it greatly expands the number and types of alarms available by default. Together, these features make it much easier to manage and monitor VMware vSphere performance.
Overview of Performance Monitoring
Monitoring performance is a key component of datacenter management. Fortunately, vCenter Server provides a number of ways to get insight into the behavior of the vSphere environment and the VMs running within that environment.
The first tool we'll explore is vCenter Server's alarms mechanism. Alarm definitions can be attached to just about any object within vCenter Server, and alarms offer an ideal way to proactively alert you or your datacenter staff about potential performance concerns or resource usage. We'll discuss alarms in detail in the section “Using Alarms.”
Another tool is the content area on the Summary tab of ESXi clusters, ESXi hosts, and VMs. The content area contains quick “at-a-glance” information on resource usage. This information can give you a quick barometer of performance, but for more detailed performance information, you'll have to dive deeper into the vCenter tools we'll discuss later in this chapter.
Additional tools that offer an at-a-glance performance summary are the Hosts tab and the VMs tab, found on vCenter Server objects, datacenter objects, cluster objects, and ESXi hosts. Figure 13.1 shows the VMs tab of a cluster object. This tab gives an overview of general performance and resource usage for all the VMs within the cluster. This information includes CPU utilization, guest memory usage, and storage space utilized. As with the Resources pane, this information can be useful, but it is quite limited. However, keep in mind that a quick trip here might help you isolate the one VM that could be causing performance issues for the ESXi host on which it is running.
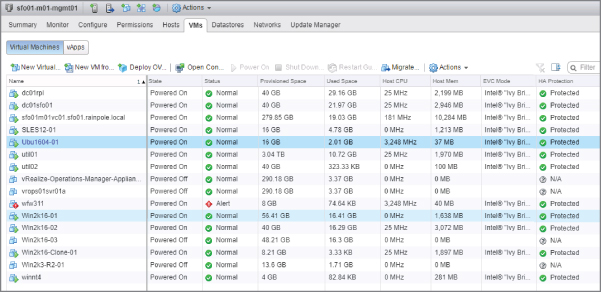
FIGURE 13.1 The VMs tab of a cluster object offers a quick look at VM CPU and memory usage.
For ESXi clusters, resource pools, and VMs, another tool you can use is the Resource Allocation tab. The Resource Allocation tab gives you a picture of how CPU, memory, and storage resources are being used for the entire pool. With this high-level method of looking at resource usage, you can analyze overall infrastructure utilization. This tab also provides an easy way of adjusting individual VMs or resource pool reservations, limits, and/or shares without editing each object independently.
vCenter Server offers a powerful, in-depth tool on the Performance tab that lets you create charts that depict the resource consumption over time for a given ESXi host or VM. The charts provide historical information and can be used for trend analysis. vCenter Server has many objects and counters that allow you to analyze the performance of a single VM or host for a selected interval. The Performance tab features powerful tools for isolating performance considerations, and we discuss them in greater detail in the section “Working with Performance Charts.”
VMware's esxtop gives you an in-depth view of all the counters available in vSphere to help isolate and identify problems in the hypervisor. esxtop runs from the shell of ESXi hosts directly. We'll take a look at esxtop later in this chapter in the section “Working with esxtop.”
Finally, we'll show you how to use the various tools that we've discussed to monitor the four major resources in a vSphere environment: CPU, memory, network, and storage.
Let's get started with a discussion of alarms.
Using Alarms
In addition to using the charts and high-level information tabs, you can create alarms for VMs, hosts, networks, and datastores based on predefined triggers provided with vCenter Server. Depending on the object, these alarms can monitor resource consumption or the state of the object and alert you when certain conditions have been met, such as high resource usage or even low resource usage. These alarms can then provide an action that informs you of the condition by email or Simple Network Management Protocol (SNMP) trap. An action can also automatically run a script or offer other means to correct the problem the VM or host is experiencing.
With each revision of vSphere, VMware continues to add to the number of built-in default alarms. As you can see in Figure 13.2, the alarms that come with vCenter Server are defined at the topmost object, the vCenter Server object.
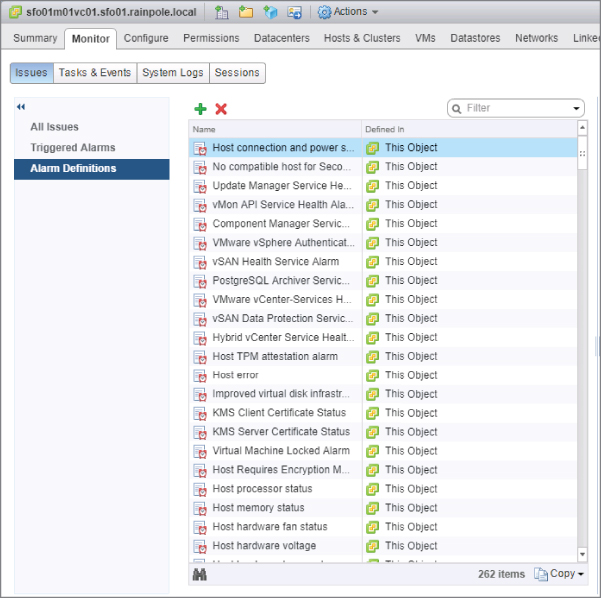
FIGURE 13.2 The default alarms for objects in vCenter Server are defined on the vCenter Server object itself.
These default alarms are usually generic in nature. Some of the predefined alarms alert you if any of the following situations occur:
- A host's storage status, CPU status, voltage, temperature, or power status changes.
- A cluster experiences a vSphere High Availability (HA) error.
- A datastore runs low on free disk space.
- A VM's CPU usage, memory usage, disk latency, or even fault tolerance status changes.
There are many more in addition to the small sampling of predefined alarms we've just described—VMware lets you create alarms on just about any object within vCenter Server. This greatly increases the ability of vCenter Server to proactively alert you to changes within the virtual environment before a problem develops.
Because the default alarms are at times too generic for your administrative needs, creating your own alarms is often necessary. Before showing you how to create an alarm, though, let's explore the concept of alarm scopes. Once we've discussed alarm scopes, we'll walk you through creating a few alarms.
Understanding Alarm Scopes
When you create alarms, one thing to keep in mind is the scope of the alarm. In Figure 13.2, you saw the default set of alarms available in vCenter Server. These alarms are defined at the vCenter Server object and thus have the greatest scope—they apply to all objects managed by that vCenter Server instance. It's also possible to create alarms at the datacenter level, the cluster level, the host level, or even the VM level. This allows you to create specific alarms that are limited in scope and are intended to meet specific monitoring needs.
When you define an alarm on an object, that alarm applies to all objects beneath that object in the vCenter Server hierarchy. The default set of alarms is defined at the vCenter Server object and therefore applies to all objects—datacenters, hosts, clusters, datastores, networks, and VMs—managed by that instance of vCenter Server. If you were to create an alarm on a resource pool, the alarm would apply only to VMs found in that resource pool. Similarly, if you were to create an alarm on a specific VM, that alarm would apply only to that specific VM.
Alarms are also associated with specific types of objects. For example, some alarms apply only to VMs, whereas other alarms apply only to ESXi hosts. You'll want to use this filtering mechanism to your advantage when creating alarms. If you needed to monitor a particular condition on all ESXi hosts, for instance, you could define a host alarm on the datacenter or vCenter Server object and it would apply to all ESXi hosts but not to any VMs.
Now you're ready to look at creating alarms.
Creating Alarms
As you've already learned, you can create many different types of alarms. These could be alarms that monitor resource consumption—such as how much CPU time a VM is consuming or how much RAM an ESXi host has allocated—or these alarms could monitor for specific events, such as when a specific distributed virtual port group is modified. In addition, you've learned that alarms can be created on a variety of objects within vCenter Server. Regardless of the type of alarm or the type of object to which that alarm is attached, the basic steps for creating an alarm are the same. In the following sections, we'll walk you through creating a few alarms so that you have the opportunity to see the options available to you.
CREATING A RESOURCE CONSUMPTION ALARM
First, let's create an alarm that monitors resource consumption. As discussed in Chapter 9, “Creating and Managing Virtual Machines,” vCenter Server supports VM snapshots. These snapshots capture a VM at a specific point in time, allowing you to roll back (or revert) to that state later. However, snapshots require additional disk space, and monitoring disk space usage by snapshots is an important task. In vSphere, vCenter Server lets you create an alarm that monitors VM snapshot space.
Before you create a custom alarm, though, ask yourself a few questions. First, is there an existing alarm that already handles this task for you? Browsing the list of predefined alarms available in vCenter Server shows that although some storage-related alarms are present, there is no alarm that monitors snapshot disk usage. Second, if you're going to create a new alarm, where is the appropriate place within vCenter Server to create that alarm? This refers to the earlier discussion of scope: on what object should you create this alarm so that it is properly scoped and will alert you only under the desired conditions? In this particular case, you'd want to be alerted to any snapshot space usage that exceeds your desired threshold, so a higher-level object such as the datacenter object or even the vCenter Server object would be the best place to create the alarm.
Perform the following steps to create an alarm that monitors VM snapshot disk space usage for all VMs in a datacenter:
- Launch the vSphere Web Client if it is not already running, and connect to a vCenter Server instance.
- Navigate to an inventory view or use the default Hosts And Clusters view.
- Right-click the datacenter object (you could also choose to select a vCenter Server, a cluster or a host object) and select Alarms ⇒New Alarm Definition.
- On the General tab in the Alarm Settings dialog box, enter an alarm name and alarm description.
- Select Virtual Machines from the Monitor drop-down list.
- Be sure that the radio button “Monitor for specific conditions or state, for example, CPU usage, power state” is selected along with the Enable This Alarm check box. Click Next to move on to the Triggers section.
- On the Triggers tab, click the add/plus button to add a new trigger.
- Add the trigger type and VM Snapshot Size (GB). For this alarm, you're interested in snapshot size only, but these other triggers are available:
- VM CPU Demand To Entitlement Ratio
- VM CPU Ready Time
- VM CPU Usage
- VM Disk Aborts
- VM Disk Resets
- VM Disk Usage
- VM Fault Tolerance Latency
- VM Heartbeat
- VM Max Total Disk Latency
- VM Memory Usage
- VM Network Usage
- VM Snapshot Size
- VM State
- VM Total Size on Disk
- Ensure that the Operator column is set to Is Above.
- Change the warning and critical conditions to 10 GB and 20 GB, respectively. Click Next to move to the Actions screen.
Figure 13.3 shows the Triggers section after changing the Warning and Critical values.
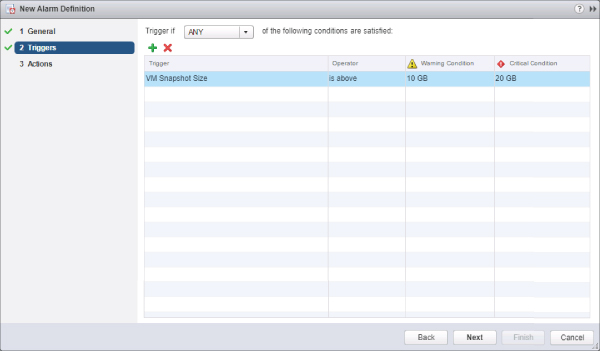
FIGURE 13.3 In the Triggers section, define the conditions that cause the alarm to activate.
- On the Actions tab, specify any additional actions that should be taken when the alarm is triggered.
The following actions are available:
- Send a notification email.
- Send a notification trap via SNMP.
- Change the power state on a VM.
- Migrate a VM.
If you leave the Actions tab empty, the alarm will alert you only within the vSphere Web Client. For now, leave the Actions tab empty.
- Click Finish to create the alarm.
The alarm is now created. To view the alarm you just created, select the datacenter object from the navigator on the left, and then click the Manage Alarm Definitions tab. You'll see your new alarm listed, as shown in Figure 13.4.
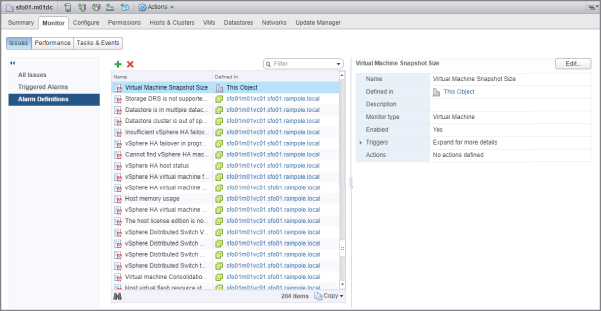
FIGURE 13.4 The Defined In column shows where an alarm was defined.
USING DURATION AND ACTION FREQUENCY WITH ALARMS
Let's create another alarm. This time you'll create an alarm that takes advantage of the parameters in the Triggers and Actions area. With the VM snapshot alarm, these parameters didn't make any sense; all you needed was just to be alerted when the snapshot exceeded a certain size. With other types of alarms, it may make sense to take advantage of these parameters.
Some triggers are simple state checks, like the VM State trigger, whereas with others you are able to specify a size, such as VM Snapshot Size. There is also a third type, which is a combination of size and time (or duration). Triggers such as VM Network Usage will activate only if the size is over (or under) the set threshold for a specified period of time.
As you may have noticed when creating the previous example alarm, alarms have two configurable states: Warning and Critical. When configuring alarm triggers, you can set the level for both warning and critical conditions; anything below these conditions is considered “Normal.” The transition between these conditions then “triggers” a set of “actions” that are configured on the Actions screen. You can set actions for both transition directions at both criticality levels:
- Normal → Warning
- Warning → Critical
- Critical → Warning
- Warning → Normal
The Repeat Actions Every parameter controls the period of time during which a triggered alarm is not reported again. Using the built-in VM CPU usage alarm as our example, the Frequency parameter is set, by default, to 5 minutes. This means that a VM whose CPU usage triggers the activation of the alarm won't get reported again—assuming the condition or state is still true—for 5 minutes.
With all this information in mind, let's walk through another example of creating an alarm. This time you'll use a trigger to take advantage of duration and action frequency.
Follows these steps to create an alarm that is triggered based on VM network usage:
- Launch the vSphere Web Client if it is not already running, and connect to a vCenter Server instance.
- Navigate to an inventory view, such as Hosts And Clusters or VMs And Templates.
- Select the datacenter object from the navigator on the left.
- Select the Monitor tab from the content area in the middle.
- Select the Alarm Definitions button just below the tab bar to show alarm definitions.
- Click the add/plus icon to create a new alarm.
- Supply an alarm name and description.
- Set the Monitor drop-down list to Virtual Machines.
- Select the radio button marked “Monitor for specific conditions or state, for example, CPU usage, power state” and click Next.
- On the Triggers screen of the Alarm Definition dialog box, click the plus/add icon to add a new trigger.
- Add a Trigger Of VM Network Usage (kbps) type.
- Set Condition to Is Above.
- Set the value of the Warning column to 500, and leave the Condition Length setting at 5 minutes.
- Set the value of the Alert column to 1000, and leave the Condition Length setting at 5 minutes.
- On the Actions tab, click the plus/add icon and add a “Send a notification email” action.
- For this newly created action, ensure that Normal Warning is set at Once and Warning Critical is set to Repeat.
- Set Repeat Actions Every to 15 minutes.
- Click Finish to create the alarm.
This alarm will now send email alerts if the VM network usage goes above 500 kbps for more than 5 minutes, but only once. If the VM network usage goes above 1,000 kbps for more than 5 minutes, an email will be sent again and then every 15 minutes advising you of this critical state until you set the alarm to green manually or the usage drops below 1,000 kbps.
Alarms can have more than just one trigger condition. The alarms you've created so far had only a single trigger condition. For an example of an alarm that has more than one trigger condition, look at the built-in alarm for monitoring host connection and power state. (Remember, all built-in alarms are defined at the vCenter Server level.) Figure 13.5 shows the two trigger conditions for this alarm. Note that ALL is selected in the Trigger If drop-down menu; it ensures that only powered-on hosts that are not responding will trigger the alarm.
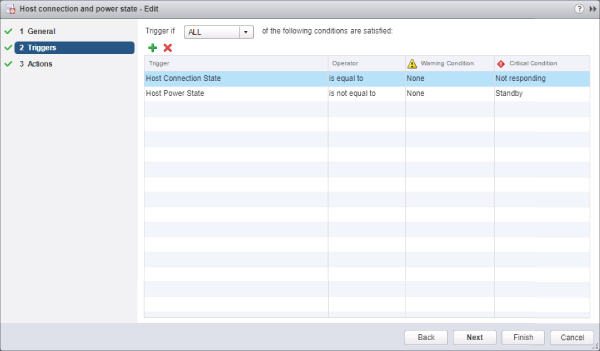
FIGURE 13.5 You can combine multiple triggers to create more complex alarms.
It might seem obvious, but it's important to note that you can have more than one alarm for an object.
As with any new alarm, testing its functionality is crucial to make sure you get the desired results. You might find that the thresholds you configured are not optimized for your environment and either are not activating the alarm when they should or are activating the alarm when they shouldn't. In these cases, edit the alarm to set the thresholds and conditions appropriately. Or if the alarm is no longer needed, right-click the alarm and choose Remove to delete it.
You'll be able to edit or delete alarms only if two conditions are met. First, the user account with which you've connected to vCenter Server must have the appropriate permissions granted for you to edit or delete alarms. Second, you must be editing or deleting the alarm from the object on which it was defined. Think back to the discussion on alarm scope and this makes sense. You can't delete an alarm from the datacenter object when that alarm was defined on the vCenter Server object. You must go to the object where the alarm was defined to edit or delete the alarm.
Now that you've seen some examples of creating alarms—and keep in mind that creating alarms for other objects within vCenter Server follows the same basic steps—let's take a look at managing alarms.
Managing Alarms
Several times so far in this chapter, we've directed you to the Alarm Definitions tab within the vSphere Web Client. Until now, you've been working with the definitions, looking at defined alarms. There is, however, another view to the alarms: the Triggered Alarms view. Figure 13.6 shows the Triggered Alarms view, which you access by selecting an object within the vCenter Web Client and then clicking the Monitor tab ⇒ Issues ⇒ Triggered Alarms.
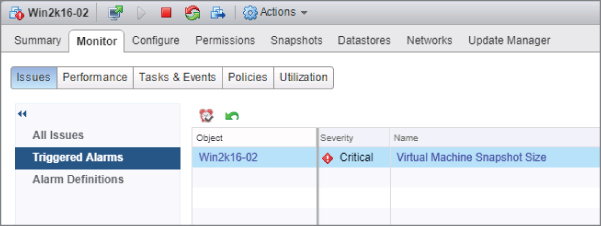
FIGURE 13.6 The Triggered Alarms view shows the alarms that vCenter Server has activated.
The Monitor ⇒ Issues ⇒ Triggered Alarms area shows all the activated alarms for the selected object and all child objects. In the right pane of the vSphere Web Client in the Global Alarm area, all alarms within vCenter are shown. In Figure 13.6, a Virtual Machine object is selected, so the Triggered Alarms view shows all activated alarms for this VM.
However, if only the VM had been selected, the Triggered Alarms view on the Alarms tab for that VM would show only the two activated alarms for that particular VM. This makes it easy to isolate the specific alarms you need to address.
After you are in Triggered Alarms view for a particular object, a few actions are available to you for each of the activated alarms. For alarms that monitor resource consumption (that is, the alarm definition uses the “Monitor for specific conditions or State, for example, CPU usage, power state” setting that's selected under Alarm Type on the General tab), you have the option to acknowledge the alarm. To acknowledge the alarm, right-click the alarm and select Acknowledge.
When an alarm is acknowledged, vCenter Server records the time the alarm was acknowledged and the user account that acknowledged the alarm. As long as the alarm condition persists, the alarm will remain in the Triggered Alarms view but is grayed out. When the alarm condition is resolved, the activated alarm disappears.
For an alarm that monitors events (this would be an alarm that has the option “Monitor for specific events occurring on this object, for example, VM powered on” selected under Alarm Type on the General tab), you can either acknowledge the alarm, as described previously, or reset the alarm status to green. Figure 13.7 illustrates this option.
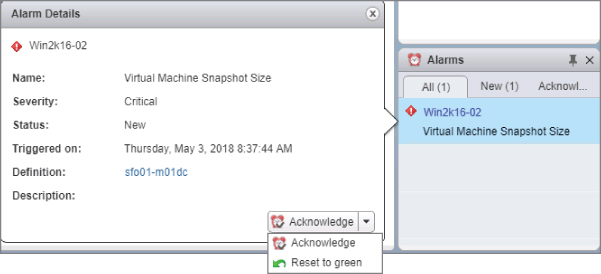
FIGURE 13.7 For event-based alarms, you also have the option to reset the alarm status to green.
Resetting an alarm to green removes the activated alarm from the Triggered Alarms view, even if the underlying event that activated the alarm hasn't been resolved. This behavior makes sense if you think about it. Alarms that monitor events are merely responding to an event being logged by vCenter Server; whether the underlying condition has been resolved is unknown. So, resetting the alarm to green just tells vCenter Server to act as if the condition has been resolved. Of course, if the event occurs again, the alarm will be triggered again.
Now that we've looked at alarms for proactive performance monitoring, let's move on to using vCenter Server's performance charts to view even more information about the behavior of VMs and ESXi hosts in your vSphere environment.
Working with Performance Charts
Alarms are a great tool for alerting you of specific conditions or events, but they don't provide the detailed information that you sometimes need, such as a resource being used that is still under a warning or critical state. This is where vCenter Server's performance charts come in. vCenter Server has many features for creating and analyzing charts. Without these charts, analyzing the performance of a VM would be nearly impossible. Installing agents inside a VM will not provide accurate details about the server's behavior or resource consumption because a VM is configured with virtual devices. Only the VMkernel knows the exact amount of resource consumption for any of those devices because it acts as the arbitrator between the virtual hardware and the physical hardware. In most virtual environments, the VM's virtual devices can outnumber the actual physical hardware devices, necessitating the complex sharing and scheduling abilities in the VMkernel.
By clicking the Monitor ⇒ Performance tab for a datacenter, cluster, host, or VM, you can learn a wealth of information. Before you use these charts to help analyze resource consumption, we need to talk about performance charts and legends. We'll start by covering the two layouts available in performance charts: the Overview layout and the Advanced layout.
Overview Layout
The Overview layout is the default view when you access the Monitor Performance tab. Figure 13.8 shows you the Overview layout of the Performance tab for an ESXi host. Note the scroll bars; there's a lot more information here than the vSphere Web Client can fit in a single screen.
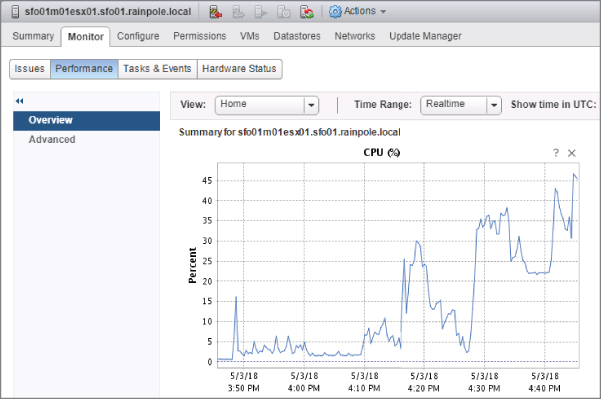
FIGURE 13.8 The Overview layout provides information on a range of performance counters.
At the top of the Overview layout are options to change the view and the time range. The contents of the View drop-down list change depending on the object you select in the vSphere Web Client. Table 13.1 lists the options available for each object.
TABLE 13.1: View options in the Overview area of the Performance tab
| SELECTED OBJECT | VIEW OPTIONS |
| Datacenter | Clusters, Storage |
| Cluster | Home, Resource Pools & Virtual Machines, Hosts |
| Resource pool | Home, Resource Pools & Virtual Machines |
| Host | Home, Virtual Machines |
| Virtual machine | Home, Storage |
Next to the View drop-down list is an option to change the time range for the data currently displayed in the various performance charts. This allows you to set the time range to real time, a day, a week, a month, a year, or a custom value. The Realtime time range setting displays the last hour of data and automatically refreshes every 20 seconds, whereas the other time range settings do not automatically refresh.
Below these controls are the performance charts. The layout and the charts that are included vary based on the object selected and the option chosen in the View drop-down list. Two examples are shown in Figure 13.9 and Figure 13.10. We encourage you to explore and find the layouts that work best for your environment and, more important, layouts that clearly show you the performance information you require.
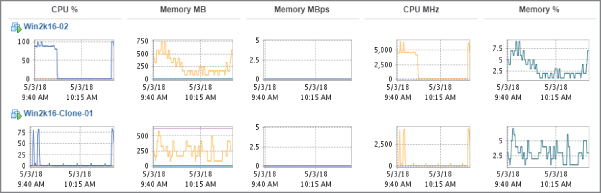
FIGURE 13.9 The Virtual Machines view of the Performance tab for an ESXi host in Overview layout offers both per-VM and summary information.
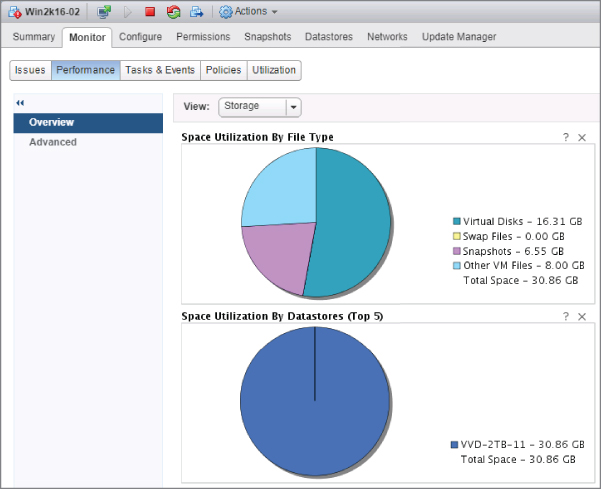
FIGURE 13.10 The Storage view of the Performance tab for a VM in Overview layout displays a breakdown of storage utilization.
The Overview layout works well if you need a broad overview of the performance data for a datacenter, cluster, resource pool, host, or VM. But what if you need more specific data in a more customizable format? The Advanced layout is the answer, as you'll see in the next section.
Advanced Layout
Although it's called the Advanced layout, to begin with it looks somewhat simpler than the Overview layout. There is only a single chart within this view, but don't let this fool you because a significant number of configuration options exist for this performance chart alone.
Figure 13.11 shows the Advanced layout of the Performance tab for a cluster of ESXi hosts. Here in the Advanced layout is where the real power of vCenter Server's performance charts is made available to you.
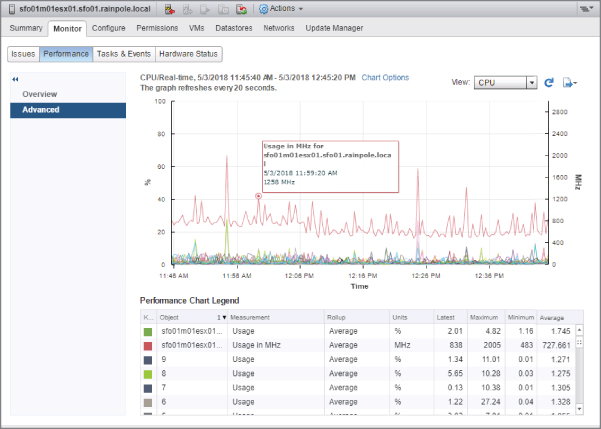
FIGURE 13.11 The Advanced layout of the Performance tab provides extensive controls for viewing performance data.
At the right of the Advanced layout, you'll find a View drop-down list to quickly switch chart settings, followed by buttons that you click to refresh or export the chart. The Refresh button refreshes the data, whereas the Export button allows you to export the chart as a JPEG, PNG graphic, or CSV document. We'll discuss this functionality in the section “Exporting Performance Charts.”
On each side of the chart are units of measurement. In Figure 13.11, the counters selected are measured in percentages and megahertz. Depending on the counters chosen, there may be only one unit of measurement, but there will be no more than two. Next, on the horizontal axis is the time interval. Below that, the performance chart legend provides color-coded keys to help the user find a specific object or item of interest. This area also breaks down the chart into the object being measured; the measurement being used; the units of measure; and the Latest, Maximum, Minimum, and Average measurements recorded for that object.
Hovering the mouse pointer over the chart at a particular recorded interval of interest displays the data points at that moment in time. Another nice feature of the charts is the ability to emphasize a specific object so that you can more easily select it from among other objects. Clicking the item in the chart legend at the bottom will emphasize that object and its representative color.
Now that you have a feel for the Advanced layout, let's take a closer look at the Chart Options link. This link exposes vCenter Server's functionality in creating highly customized performance charts and is where all the nuts and bolts are configured for this feature. Figure 13.12 shows the Chart Options dialog box. This dialog box is the central place where you will come to customize vCenter Server's performance charts; you can also just double-click the chart to display this dialog box. Here, you select the counters to view, the time ranges, and the kind of chart (Line Graph or Stacked Graph) you want to display.
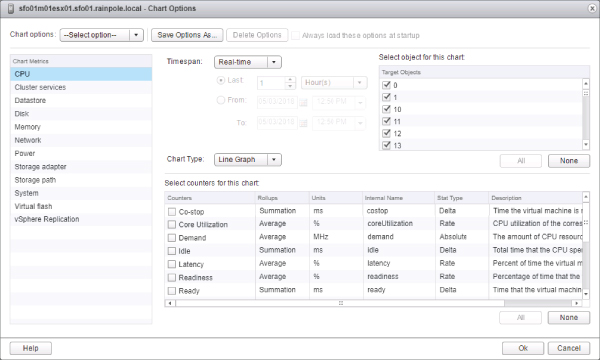
FIGURE 13.12 The Chart Options dialog box offers tremendous flexibility to create exactly the performance chart you need.
Because so much information is available in the Chart Options dialog box, we've grouped the various options and types of information into the sections that follow.
CHOOSING CHART METRICS AND COUNTERS
On the left side of the Chart Options dialog box (shown in Figure 13.12), you can choose which metric to monitor or analyze. All the available chart metrics are listed here, but only a subset of these is available:
- CPU
- Cluster Services
- Datastore
- Disk
- Memory
- Network
- Power
- Storage Adapter
- Storage Path
- System
- Virtual Flash
- Virtual Disk
- Virtual Machine Operations
- vSphere Replication
The selections available in this area change depending on the type of object that you have selected within the vCenter Web Client. That is, the options available when you're viewing the Monitor Performance tab for an ESXi host are different from the options available when you're viewing the Monitor ⇒ Performance tab of a VM, a cluster, or a datacenter.
Within each of these resources, different objects and counters can be selected. Be aware that other factors affect what objects and counters are available to view; for example, in some cases the real-time interval shows more objects and counters than other intervals. A description field within the counters list explains what each counter represents. If this description does not fit within the Chart Options dialog box, simply mouse over it to view the full text. The next few sections list some of the counters available for the resource types in the Chart Options dialog box. We have not listed every available counter as there are far too many to list.
VIEWING CPU PERFORMANCE INFORMATION
If you select the CPU resource type in the Chart Options dialog box, you can choose which objects and counters you'd like to see in the performance chart. Note that the CPU resource type is not available when viewing the Performance tab of a datacenter object (DC). It is available for clusters (CL), ESXi hosts (ESXi), resource pools (RP), and individual virtual machines (VM).
Table 13.2 lists the most important objects and counters available for CPU performance information.
TABLE 13.2: Available CPU performance counters
| Counter | CL | ESXI | RP | VM |
| Max Limited | X | |||
| Ready | X | X | ||
| Run | X | |||
| Swap Wait | X | X | ||
| System | X | |||
| Total | X | |||
| Usage In MHz | X | X | X | X |
| Used | X | X | ||
| Usage | X | |||
| Utilization | X | |||
| Wait | X | X |
You can view quite a bit of CPU performance information in the section “Monitoring CPU Usage.” We'll discuss how to use these CPU performance objects and counters to monitor CPU usage.
VIEWING MEMORY PERFORMANCE INFORMATION
If you select the Memory resource type in the Chart Options section of the Chart Options dialog box, you can display various objects and counters. The Memory resource type is not available when viewing the Performance tab of a datacenter object. It is available for clusters, ESXi hosts, resource pools, and individual VMs.
Table 13.3 lists the most important objects and counters for memory performance information.
TABLE 13.3: Memory performance counters
| Counter | CL | ESXI | RP | VM |
| Active | X | X | ||
| Ballooned Memory | X | |||
| Balloon Target | X | |||
| Compressed | X | X | ||
| Consumed | X | X | X | X |
| Memory Saved By Zipping | X | |||
| Swap In | X | X | ||
| Swap Out | X | X | ||
| Swap Used | X | |||
| Usage | X | X | X | |
| Zipped Memory | X |
In the section “Monitoring Memory Usage,” you'll get the opportunity to use these objects and counters to monitor how ESXi and VMs are using memory.
VIEWING DISK PERFORMANCE INFORMATION
Disk performance is another key area that you need to monitor. Table 13.4 shows the most important objects and counters available for disk performance information.
TABLE 13.4: Disk performance counters
| Counter | CL | ESXI | RP | VM |
| Disk Bus Resets | X | X | ||
| Disk Commands Terminated | X | X | ||
| Disk Kernel Command Latency | X | X | ||
| Disk Kernel Read Latency | X | X | ||
| Disk Kernel Write Latency | X | X | ||
| Disk Maximum Queue Depth | X | X | ||
| Disk Command Latency | X | X | ||
| Disk Read Latency | X | X | ||
| Disk Write Latency | X | X | ||
| Disk Queue Command Latency | X | X |
Note that these counters aren't supported for datacenters, clusters, and resource pools, but they are supported for ESXi hosts and VMs. Not all counters are visible in all display intervals.
You'll use these counters in the section “Monitoring Disk Usage,” later in this chapter.
VIEWING NETWORK PERFORMANCE INFORMATION
To monitor network performance, the vCenter Server performance charts cover a wide collection of performance counters. Network performance counters are available only for ESXi hosts and VMs; they are not available for datacenter objects, clusters, or resource pools.
Table 13.5 shows the most important objects and counters for network performance information.
TABLE 13.5: Network performance counters
| Counter | CL | ESXI | RP | VM |
| Data Receive Rate | X | X | ||
| Data Transmit Rate | X | X | ||
| Receive Packets Dropped | X | X | ||
| Transmit Packets Dropped | X | X | ||
| Packet Receive Errors | X | |||
| Packet Transmit Errors | X | |||
| Packets Received | X | X | ||
| Packets Transmitted | X | X | ||
| Data Receive Rate | X | X | ||
| Data Transmit Rate | X | X | ||
| Usage | X | X |
You'll use these network performance counters in the section “Monitoring Network Usage,” later in this chapter.
VIEWING SYSTEM PERFORMANCE INFORMATION
ESXi hosts and VMs also offer some performance counters in the System resource type. Datacenters, clusters, and resource pools do not support any system performance counters.
Table 13.6 lists the most important objects and counters for system performance information.
TABLE 13.6: System performance counters
| Counter | CL | ESXI | RP | VM |
| Resource CPU Active (1 Min Average) | X | |||
| Resource CPU Active (5 Min Average) | X | |||
| Resource CPU Maximum Limited (1 Min) | X | |||
| Resource CPU Maximum Limited (5 Min) | X | |||
| Resource CPU Running (1 Min Average) | X | |||
| Resource CPU Running (5 Min Average) | X | |||
| Resource CPU Usage (Average) | X | |||
| Resource Memory Shared | X | |||
| Resource Memory Swapped | X | |||
| Uptime | X | X |
The majority of these counters are valid only for ESXi hosts, and they all center on how resources are allocated or how the ESXi host itself is consuming CPU resources or memory.
VIEWING DATASTORE PERFORMANCE INFORMATION
Monitoring datastore performance allows you to see the performance of the whole datastore instead of using disk counters per VM. Datastore performance counters are available only for ESXi hosts and VMs; they are not available for datacenter objects, clusters, or resource pools.
Table 13.7 shows the most important objects and counters for datastore performance information.
TABLE 13.7: Datastore performance counters
| Counter | CL | ESXI | RP | VM |
| Storage I/O Control Aggregated IOPS | X | |||
| Storage I/O Control Datastore Maximum Queue Depth | X | |||
| Storage DRS Datastore Normalized Read Latency | X | |||
| Storage DRS Datastore Normalized Write Latency | X | |||
| Highest Latency | X | X | ||
| Average Read Requests Per Second | X | X | ||
| Average Write Requests Per Second | X | X | ||
| Storage I/O Control Normalized Latency | X | |||
| Read Latency | X | X | ||
| Write Latency | X | X |
VIEWING STORAGE PATH PERFORMANCE INFORMATION
Storage Path is one of the new categories of performance counters. As the name suggests, these counters can help you troubleshoot storage path problems. Storage path counters are available only for ESXi; they are not available for datacenter objects, clusters, VMs, or resource pools.
Table 13.8 shows the objects and counters for storage path performance information.
TABLE 13.8: Storage path performance counters
| Counter | CL | ESXI | RP | VM |
| Average Commands Issued Per Second | X | |||
| Highest Latency | X | |||
| Average Read Requests Per Second | X | |||
| Average Write Requests Per Second | X | |||
| Read Rate | X | |||
| Storage Path Throughput Usage | X | |||
| Read Latency | X | |||
| Write Latency | X | |||
| Write Rate | X |
VIEWING OTHER PERFORMANCE COUNTERS
The following performance counter types are also available:
- ESXi hosts participating in a cluster also have a resource type of Cluster Services, with two performance counters: CPU Fairness and Memory Fairness. Both of these counters show the distribution of resources within a cluster.
- The datacenter object contains a resource type marked as Virtual Machine Operations. This resource type contains performance counters that monitor the number of times a particular VM operation has occurred. These include VM Power-On Events, VM Power-Off Events, VM Resets, vMotion Operations, and Storage vMotion Operations.
SETTING A CUSTOM INTERVAL
Just as with the Overview layout, within each of the resource types you have a choice of intervals to view. Some objects offer a Real-Time option; this option shows what is happening with that resource right now, with a historical view over the past hour, and the charts automatically refresh every 20 seconds. The others are self-explanatory in their time span, but note that they do not refresh automatically. The Custom option allows you to specify exactly what you'd like to see on the performance chart. For example, you could specify that you'd like to see performance data for the last 8 hours. Having all of these interval options allows you to choose exactly the right interval necessary to view the data you're seeking.
MANAGING CHART SETTINGS
Let's look at one more area of the Chart Options dialog box: the Chart Options drop-down and Save Options As button along the top.
After you've gone through and selected the resource type, display interval, objects, and performance counters that you'd like to see in the performance chart, you can save that collection of chart settings using the Save Options As button. The vCenter Web Client prompts you to enter a name for the saved chart settings. After a chart setting is saved, you can easily access it again from the drop-down list at the top of the performance chart's Advanced layout. Figure 13.13 shows the View drop-down list, with two custom chart settings: CPU-8hr View and MEM - Overhead. By selecting either of these from the View drop-down list, you can quickly switch to those settings. This allows you to define the performance charts that you need to see and then quickly switch between them.
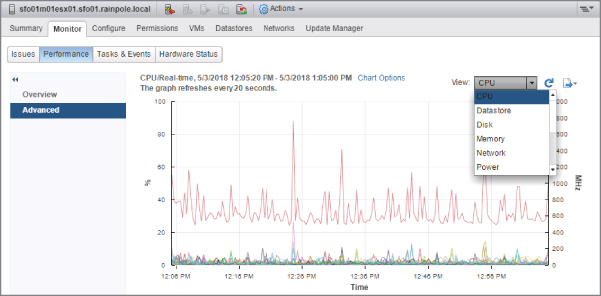
FIGURE 13.13 You can access saved chart settings from the View drop-down list.
If you have a custom chart saved, the Chart Options dialog box allows you to delete chart settings you've saved but no longer need.
In addition to offering you the option of saving the chart settings, vCenter Server allows you to save the chart.
EXPORTING PERFORMANCE CHARTS
When we first introduced you to the Advanced layout view of the Performance tab, we briefly mentioned the Export button. This button, found in the upper-right corner of the Advanced layout, allows you to save the results of the performance chart to an external file for long-term archiving, analysis, or reporting.
When you click the Export button, a standard Save dialog box appears. You have the option of choosing where to save the resulting file as well as the option of saving the chart either as a graphic file or as a comma-separated value (CSV) file. If you are going to perform any additional analysis, the option to save the chart data as a Microsoft Excel spreadsheet is quite useful. The graphics options are useful when you need to put the performance data into a report.
There's a lot of information exposed via vCenter Server's performance charts. We'll revisit the performance charts again in the sections on monitoring specific types of resources later in this chapter. We'll now explain the last tools in the toolbox, esxtop, and then show you how to combine all the tools to keep your environment in top condition.
Working with esxtop
In addition to alarms and performance charts, VMware provides esxtop to help you monitor performance and resource usage. A great reason to use esxtop is the immediate feedback it gives you. Using esxtop, you can monitor all four major resource types (CPU, disk, memory, and network) on a particular ESXi host. Also, when using esxtop, you don't need vCenter Server to be able to monitor performance and resource usage. Figure 13.14 shows some sample output from esxtop.
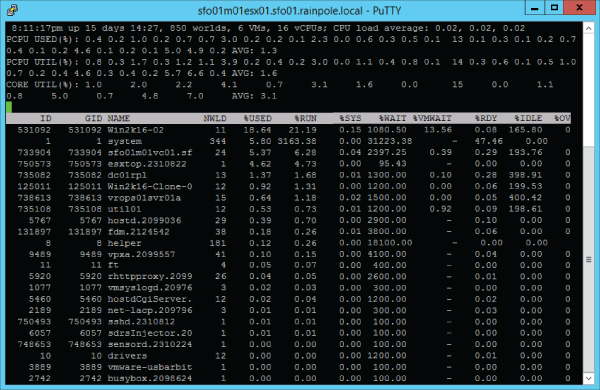
FIGURE 13.14
esxtop shows real-time information on CPU, disk, memory, and network utilization.
To run esxtop, you will need to enable SSH on your ESXi host and connect to the secure shell. Once you are logged in, it can be started by simply entering esxtop. Once esxtop is running, you can use single-letter commands to switch among the various views.
Upon launch, esxtop defaults to showing CPU utilization. At the top of the screen are summary statistics; below that are statistics for specific VMs and VMkernel processes. To show only VMs, press V. Be aware that esxtop, like many Linux commands, is case sensitive, so you'll need to be sure to use an uppercase V in order to toggle the display of VMs only.
- Monitoring CPU Usage with C Two CPU counters of interest to view with esxtop are the CPU Used (%USED) and Ready Time (%RDY) counters. You can also see these counters in the VM charts, but with
esxtop, they are calculated as percentages. The %RDY counter is also helpful in determining whether you have overallocated CPU resources to the VM. This might be the case if, for example, you've allocated two vCPUs to a VM that really needs only a single vCPU. While in CPU mode, you can also press the lowercase e to expand a VM's CPU statistics so that you can see the components that are using CPU time on behalf of a VM. This helps you determine what components of a VM may be taking up CPU capacity.If you switch away to another resource, press C (uppercase or lowercase) to come back to the CPU counters display. At any time when you are finished with
esxtop, you can simply press q (lowercase only) to exit the utility and return to the vMA command prompt. - Monitoring Memory Usage with M Memory is one of the most important components of your ESXi host because this resource is usually one of the first to get exhausted.
To monitor memory usage with
esxtop, press m (lowercase only). This gives you real-time statistics about the ESXi host's memory usage in the top portion and the VM's memory usage in the lower section. As with CPU statistics, you can press V (uppercase only) to show only VMs. This helps you weed out VMkernel resources when you are trying to isolate a problem with a VM. The %ACTV counter, which shows current active guest physical memory, is a useful counter, as are the %ACTVS (slow-moving average for long-term estimates), %ACTVF (fast-moving average for short-term estimates), %ACTVN (prediction of %ACTV at next sampling), and SWCUR (current swap usage) counters. - Monitoring Network Statistics with N Networking in a vSphere environment is often taken for granted, but while your environment grows, you'll learn that keeping an eye on network performance is essential.
To monitor network statistics about the virtual machine network interface cards (vmnics), individual VMs, or VMkernel ports used for iSCSI, VMotion, and NFS, press n (lowercase only). The columns showing network usage include packets transmitted and received and megabytes transmitted and received for each vmnic or port. Also shown in the DNAME column are the vSwitches or dvSwitches and, to the left, what is plugged into them, including VMs, VMkernel, and Service Console ports. If a particular VM is monopolizing the vSwitch, you can look at the amount of network traffic on a switch and the individual ports to see which VM is the culprit. Unlike in other
esxtopviews, you can't use V (uppercase only) here to show only VMs. - Monitoring Disk I/O Statistics with D Memory and disk I/O are considered the most important components in your vSphere environment. Although memory is important because it gets exhausted first, disk I/O is often overlooked even though bad disk performance will directly impact the VMs performance.
To monitor disk I/O statistics about each of the disk adapters, press d (lowercase only), press u (lowercase only) for disk devices, and v (lowercase only) for disk VM. As with some other views, you can press V (uppercase only) to show only VMs. The columns labeled READS/s, WRITES/s, MBREAD/s, and MBWRTN/s are most often used to determine disk loads. Those columns show loads based on reads and writes per second and megabytes read and written per second.
The esxtop command also lets you view CPU interrupts by pressing i. This command will show you the device(s) using the interrupt and is a great way to identify VMkernel devices, such as a vmnic, that might be sharing an interrupt with the Service Console. This sort of interrupt sharing can impede performance.
Another great feature of esxtop is the ability to capture performance data for a short period of time and then play back that data. Using the command vm-support, you can set an interval and duration for the capture.
Perform the following steps to capture data to be played back on esxtop:
- Using PuTTY (Windows) or a terminal window (Mac OS X or Linux), open an SSH session to an ESXi host. Note that this requires enabling the ESXi shell and SSH, both of which are disabled by default.
- Enter the
su –command to assume root privileges. - While logged in as root or after switching to the root user, change your working directory to
/tmpby issuing the commandcd /tmp. - Enter the command
vm-support -p -i 10 -d 180. This creates anesxtopsnapshot, capturing data every 10 seconds, for the duration of 180 seconds. - The resulting file is a tarball and is compressed with
gzip. You must extract it with the commandtar -xzf esx*.tgz. This creates avm-supportdirectory that is called in the next command. - Run
esxtop -R /vm-support*to replay the data for analysis.
Now that we've shown you the various tools (alarms, performance charts, and esxtop) that you will use to monitor performance in a vSphere environment, let's go through the four major resources—CPU, RAM, network, and disk—and see how to monitor the usage of these resources.
Monitoring CPU Usage
When monitoring a VM, it's always a good starting point to keep an eye on CPU consumption. Many VMs started out in life as underperforming physical servers. One of VMware's most successful sales pitches was being able to take all those lackluster physical boxes that are not busy and convert them to VMs. Once they are converted, virtual infrastructure managers tend to think of these VMs as simple, lackluster, and low-utilization servers with nothing to worry over or monitor. The truth, though, is quite the opposite.
When the server was physical, it had an entire box of hardware to itself. Now it must share its resources with many other workloads. In aggregate, they represent quite a load, and if some or many of them become somewhat busy, they contend with each other for the finite capabilities of the ESXi host on which they run. Of course, they don't know they are contending for resources because the VMkernel tries to make sure they get the resources they need. Virtual CPUs need to be scheduled, and ESXi does a remarkable job given that there are more VMs than physical processors most of the time. Still, the hypervisor can do only so much with the resources it has, and invariably there comes a time when the applications running in a VM may need more CPU time than the host can give.
When this happens, it's usually the application owner who notices first and raises the alarm with the system administrators. Now the vSphere administrators have the task of determining why this VM is underperforming. Fortunately, vCenter Server provides a number of tools that make monitoring and analysis easier. These are the tools you've already seen: alarms, performance charts, and esxtop.
Let's begin with a hypothetical scenario. A help desk ticket has been submitted indicating that an application owner isn't getting the expected level of performance on a particular server, which in this case is a VM. As the vSphere administrator, you need to first delve deeper into the problem and ask as many questions as necessary to discover what the application owner needs to be satisfied with performance. Some performance issues are subjective, meaning some users might complain about the slowness of their applications, but they have no objective benchmark for such a claim. Other times, this is reflected in a specific benchmark, such as the number of transactions by a database server or throughput for a web server. In this case, our issue revolves around benchmarking CPU usage, so our application is CPU intensive when it does its job.
vCenter Server's charts, which you have explored in great detail, are the best way to analyze usage, both short and long term. In this case, let's assume the help desk ticket describes a slowness issue in the last hour. As you've already seen, you can easily create a custom performance chart to show CPU usage over the last hour for a particular VM or ESXi host.
Perform the following steps to create a CPU chart that shows data for a VM from the last hour:
- Connect to a vCenter Server instance with the vSphere Web Client.
- Navigate to the Hosts And Clusters or VMs And Templates view.
- In the navigator, select a virtual machine.
- Select the Monitor ⇒ Performance tab from the contents pane on the right, and then change the view to Advanced.
- Click the Chart Options link.
- In the Chart Options dialog box, select CPU from the Resource Type list. Select the Custom interval for the time span.
- Leave the interval to Realtime (this shows the previous hour).
- Set the chart type to Line Graph.
- Select the VM from the list of objects.
- From the list of counters, select Usage In MHz (Average) and Ready.
- Click OK to apply the chart settings.
The chart in Figure 13.15 shows CPU utilization for the selected VM, but it won't necessarily help you get to the bottom of why this particular VM isn't performing as well as expected. In this scenario, we would fully expect the CPU Usage In MHz (Average) counter to be high; this simply tells you that the VM is using all the CPU cycles it can get. Unless the CPU Ready counters are also high, indicating that the VM is waiting on the host to schedule it onto a physical processor, you still haven't uncovered the cause of the slowness that triggered the help desk ticket. Instead, you'll need to move to monitoring host CPU usage.
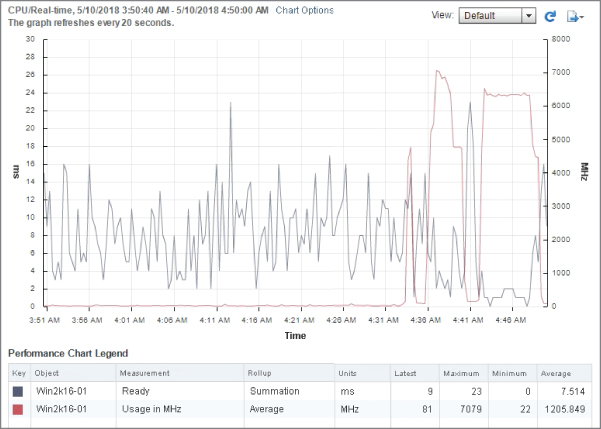
FIGURE 13.15 Understanding the metrics is important when building custom advanced performance graphs.
Monitoring a host's overall CPU usage is fairly straightforward. Keep in mind that other factors usually come into play when looking at spare CPU capacity. Add-ons such as vMotion, vSphere DRS, and vSphere HA directly impact whether there is enough spare capacity on a server or a cluster of servers.
Perform the following steps to create a real-time chart for a host's CPU usage:
- Launch the vSphere Web Client if it is not already running, and connect to a vCenter Server instance.
- Navigate to the Hosts And Clusters or VMs And Templates view.
- In the navigator, select a host. This shows you the Summary tab.
- Select the Monitor ⇒ Performance tab, and then switch to Advanced view.
- Click the Chart Options link.
- In the Chart Options dialog box, select the CPU resource type and the Real-Time display interval.
- Set Chart Type to Stacked Graph (Per VM).
- Select all objects.
- You should see a separate object for each VM hosted on the selected ESXi host.
- Select the Usage (Average) performance counter.
- Click OK to apply the chart settings and return to the Performance tab.
As you can see in Figure 13.16, the chart shows the use of all the VMs on the selected ESXi host in a stacked fashion. From this view, you should be able to determine whether there is a specific VM or group of VMs consuming abnormal amounts of CPU capacity.
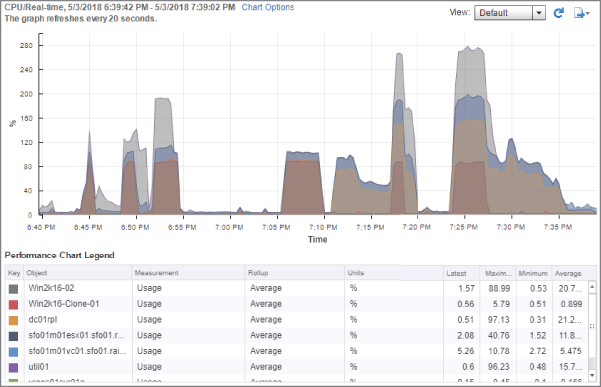
FIGURE 13.16 The CPU utilization of an ESXi host can be seen spread between each VM that hosts.
In this scenario, we identified the application within the VM as CPU bound, so these two performance charts should clearly identify why the VM isn't performing well. In all likelihood, the ESXi host on which the VM is running doesn't have enough CPU capacity to satisfy the requests of all the VMs. Your solution, in this case, would be to use the resource allocation tools described in Chapter 11, “Managing Resource Allocation,” to ensure that this specific application receives the resources it needs to perform at acceptable levels.
Monitoring Memory Usage
Monitoring memory usage, whether on a host or a VM, can be challenging. The monitoring itself is not difficult; it's the availability of the physical resource that can be a challenge. Of the four resources, memory can be oversubscribed without much effort. Depending on the physical form factor chosen to host VMware ESXi, running out of physical RAM is easy to do. Although the blade form factor creates a very dense consolidation effort, the blades are sometimes constrained by the amount of physical memory and network adapters that can be installed. But even with other regular form factors, having enough memory installed comes down to how much the physical server can accommodate and your budget.
If you suspect that memory usage is a performance issue, the first step is to isolate whether this is a memory shortage affecting the host (you've oversubscribed physical memory and need to add more memory) or whether this is a memory limit affecting only that VM (meaning you need to allocate more memory to this VM or change resource allocation policies). Normally, if the ESXi host is suffering from high memory utilization, the predefined vCenter Server alarm will trigger and alert the vSphere administrator. However, the alarm doesn't allow you to delve deeper into the specifics of how the host is using memory. For that, you'll need a performance chart.
Perform the following steps to create a real-time chart for a host's memory usage:
- Connect to a vCenter Server instance with the vSphere Web Client.
- Navigate to Hosts And Clusters view.
- In the navigator, click an ESXi host. This shows you the Summary tab.
- Click the Monitor tab, and the Performance sub-tab. Then switch to Advanced view.
- Click the Chart Options link.
- In the Chart Options dialog box, select the Memory resource type and the Real-Time display interval.
- Select Line Graph as the chart type. The host will be selected as the only available object.
- In the Counters area, select the Active (Average), Consumed (Average), Overhead Consumed (Average), Swap Consumed (Average), and VMkernel Consumed counters.
As you can see in Figure 13.17, this should give you a fairly clear picture of how much memory the ESXi host is using.
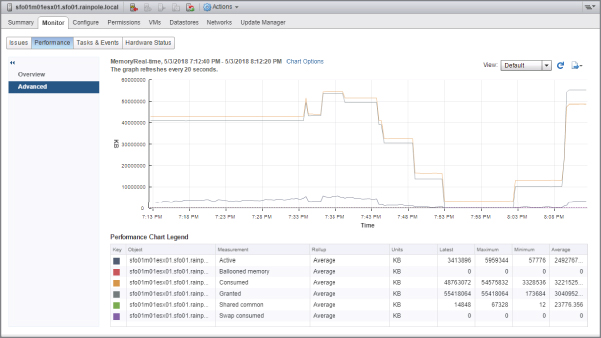
FIGURE 13.17 An ESXi host can show where all its memory is allocated down to a very granular level.
- Click OK to apply the chart options and return to the Performance tab.
These counters, in particular the Memory Swap Used (Average) counter, will give you an idea of whether the ESXi host is under memory pressure. If the ESXi host is not suffering from memory pressure and you still suspect a memory problem, then the issue likely lies with the VM.
Perform the following steps to create a real-time chart for a VM's memory usage:
- Use the vSphere Web Client to connect to a vCenter Server instance.
- Navigate to either the Hosts And Clusters or the VMs And Templates view.
- In the navigator, click a virtual machine. This shows you the Summary tab.
- Click the Monitor tab, and the Performance sub-tab. Then switch to Advanced view.
- Click the Chart Options link.
- In the Chart Options dialog box, select the Memory resource type and the Real-Time display interval.
- Select Line Graph as the chart type.
- In the list of counters, select to show the Overhead Consumed (Average), Consumed (Average), and Granted (Average) counters. This shows memory usage, including usage relative to the amount of memory configured for the VM.
- Click OK to apply the chart options and return to the Performance tab.
From this performance chart, you will be able to tell how much of the memory configured for the VM is actually being used. This might reveal to you that the applications running inside that VM need more memory than the VM has been assigned and that adding more memory to the VM—assuming that there is sufficient memory at the host level—might improve performance.
Memory, like CPU, is just one of several factors that can impact VM performance. Network usage is another area that can affect performance, especially perceived performance.
Monitoring Network Usage
vCenter Server's charts provide a wonderful tool for measuring the network usage of a VM or a host.
Monitoring network usage requires a slightly different approach than monitoring CPU or memory. With either CPU or memory, reservations, limits, and shares can dictate how much of these two resources can be consumed by any one VM. Network usage cannot be constrained by these mechanisms. Because VMs plug into a VM port group, which is part of a vSwitch on a single host, how the VM interacts with the vSwitch can be manipulated by the virtual switch's or port group's policy. For instance, if you need to restrict a VM's overall network output, you would configure traffic shaping on the port group to restrict the VM to a specific amount of outbound bandwidth. Unless you are using vSphere Distributed Switches or the Nexus 1000V third-party distributed virtual switch, there is no way to restrict VM inbound bandwidth on ESXi hosts.
To get an idea of how much network traffic is being generated, you can measure outgoing and incoming network traffic from a VM or host using the charts in vCenter Server. The charts can provide accurate information on the actual usage or ample information that a particular VM is monopolizing a virtual switch, especially using the Stacked Graph chart type.
Perform the following steps to create a real-time chart for a stacked graph of transmitted network usage by each VM on an ESXi host:
- Launch the vSphere Web Client if it is not already running, and connect to a vCenter Server instance.
- Navigate to either the Hosts And Clusters view or the VMs And Templates view.
- In the navigator, click an ESXi host. This shows you the Summary tab.
- Click the Monitor tab, and the Performance sub-tab. Then switch to Advanced view.
- Click the Chart Options link.
- From the Chart Options dialog box, select the Network resource type and the Real-Time display interval in the Chart Options area.
- Select a chart type of Stacked Graph (Per VM).
- In the objects list, be sure all the VMs are selected.
- In the list of counters, select the Data Transmit Rate counter.
This gives you an idea of how much network bandwidth each VM is consuming outbound on this ESXi host.
- Click OK to apply the changes and return to the Performance tab.
What if you wanted a breakdown of traffic on each of the network interface cards (NICs) in the ESXi host instead of by VM? That's fairly easily accomplished by another trip back to the Chart Options dialog box.
Follow these steps to create a real-time chart for a host's transmitted network usage by NIC:
- Connect to a vCenter Server instance with the vSphere Web Client.
- Navigate to the Hosts And Clusters view.
- In the navigator, select an ESXi host. This will show you the Summary tab in the content area to the right.
- Click the Monitor tab, and the Performance sub-tab. Then switch to Advanced view.
- Click the Chart Options link.
- Under Chart Options in the Chart Options dialog box, select the Network resource type and the Real-Time display interval.
- Set the chart type to Line Graph.
- In the objects list, select the ESXi host as well as all the specific NICs.
- Select the Data Transmit Rate and Packets Transmitted counters.
- Click OK to apply the changes and return to the Performance tab.
As with the previous example for a VM, the two counters shown in Figure 13.18 will give you a window into how much network activity is occurring on this particular host in the outbound direction for each physical NIC. This is especially relevant if you want to see different rates of usage for each physical network interface, which, by definition, represent different virtual switches.
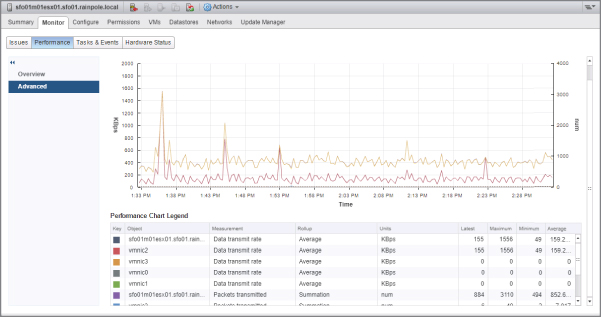
FIGURE 13.18 Packet rate and data rate can be overlaid on the same chart.
Now that you've examined how to monitor CPU, memory, and network usage, there's only one major area left: monitoring disk usage.
Monitoring Disk Usage
Monitoring a host's controller or VM's virtual disk usage is similar in scope to monitoring network usage. This resource, which represents a controller or the storing of a VM's virtual disk on a type of supported storage, isn't restricted by CPU or memory mechanisms like reservations, limits, or shares. The only way to restrict a VM's disk activity is to assign shares on the individual VM, which in turn may have to compete with other VMs running from the same storage volume. vCenter Server's charts come to our aid again in showing actual usage for both ESXi hosts and VMs.
Perform the following steps to create a host chart showing disk controller utilization:
- Use the vSphere Web Client to connect to a vCenter Server instance.
- Navigate to the Hosts And Clusters view.
- In the navigator, select an ESXi host.
This shows you the Summary tab in the Details section on the right.
- Click the Monitor tab, and the Performance sub-tab. Then switch to Advanced view.
- Click the Chart Options link. This opens the Chart Options dialog box.
- Under Chart Options, choose the Real-Time display interval for the disk resource type.
- Set the chart type to Line Graph.
- Selecting an object or objects—in this case, an NFS datastore device—and a counter or counters lets you monitor for activity that is interesting or necessary to meet service levels. Select the objects that represent the ESXi host and one of the disks or datastores.
- In the counters list, select Read Rate and Write Rate, to get an overall view of the activity for the selected disk / datastore object.
- Click OK to return to the Performance tab.
The performance chart shown in Figure 13.19 will give you an idea of the activity on the selected disk. But what if you want to see disk activity for the entire host by each VM? In this case, a Stacked Graph view can show you what you need.
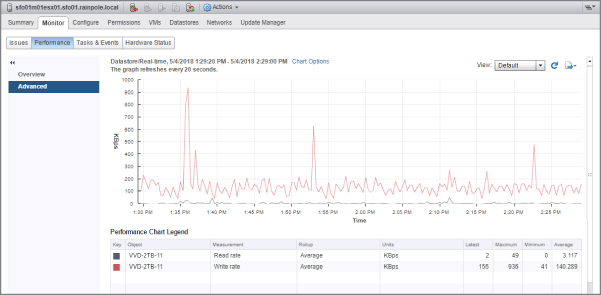
FIGURE 13.19 The read and write statistics for an NFS datastore are shown over the past hour.
Now let's switch to the virtual machine view. Looking at individual VMs for insight into their disk utilization can lead to some useful conclusions. File and print VMs, or any server that provides print queues or database services, will generate some disk-related I/O that needs to be monitored. In some cases, if the VM is generating too much I/O, it may degrade the performance of other VMs running out of the same volume. Let's take a look at a VM's chart.
Follow these steps to create a VM chart showing real-time disk controller utilization:
- Launch the vSphere Web Client if it is not already running, and connect to a vCenter Server instance.
- Navigate to either the Hosts And Clusters view or the VMs And Templates view.
- In the navigator, click a virtual machine.
This shows you the Summary tab in the Details section on the right.
- Click the Monitor tab, and the Performance sub-tab. Then switch to Advanced view.
- Click the Chart Options link to open the Chart Options dialog box.
- Under Chart Options, select the Virtual Disk resource type and the Real-Time display interval.
- Set the chart type to Line Graph.
- Set both objects listed in the list of objects.
- In the list of counters, select Read Rate, Write Rate (Average/Rate).
- Click OK to apply these changes and return to the Performance tab.
With this chart, you should have an informative picture of this VM's disk I/O behavior. This VM is busy generating reads and writes for its application. Does the chart show enough I/O to meet a service-level agreement, or does this VM need some help? The charts allow administrators to make informed decisions, usually working with the application owners, so that any adjustments to improve I/O will lead to satisfied VM owners.
In addition, by looking at longer intervals of time to gain a historical perspective, you may find that a VM has become busier or fallen off its regular output. If the amount of I/O is just slightly impaired, then adjusting the VM's shares may be a way to prioritize its disk I/O ahead of other VMs sharing the volume. The administrator may be forced to move the VM's virtual disk(s) to another volume or LUN if share adjustments don't achieve the required results. You can use Storage VMotion, described in Chapter 6, “Creating and Configuring Storage Devices,” to perform this sort of LUN-based load balancing without any disruption to the end users.
Monitoring resources can be tricky, and it requires a good knowledge of the applications running in the VMs in your environment. If you are a new vSphere administrator, it's worth spending some time using vCenter Server's performance charts to establish some baseline behaviors. This helps you become much more familiar with the normal operation of the VMs so that when something unusual or out of the ordinary does occur, you'll be more likely to spot it.
Once you are familiar with the counters, and what each counter means, it can often be quickest to look at the Utilization sub-tab found under the Monitor tab for Cluster and VM objects. As shown in Figure 13.20, you can get a quick look at the CPU and Memory being used by the object.
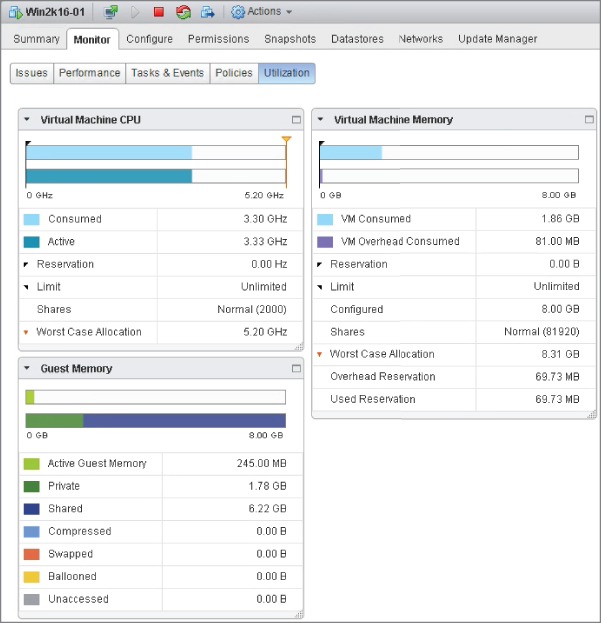
FIGURE 13.20 The Utilization area can provide an overview of some current, point-in-time CPU and Memory statistics without the need to delve into performance charts.
If you have a particular interest in the ongoing monitoring of resources and the performance management of your environment, it may be worthwhile to take a look at VMware vRealize Operations Manager (vROps). Built entirely for the purpose of monitoring, vROps integrates tightly with VMware's suite of products and provides even more in-depth metrics and intelligent analytics.
The Bottom Line
- Use alarms for proactive monitoring. vCenter Server offers extensive alarms for alerting vSphere administrators to excessive resource consumption or potentially negative events. You can create alarms on virtually any type of object found within vCenter Server, including datacenters, clusters, ESXi hosts, and VMs. Alarms can monitor for resource consumption or for the occurrence of specific events. Alarms can also trigger actions, such as running a script, migrating a VM, or sending a notification email.
- Master It What are the questions you should ask before creating a custom alarm?
- Work with performance charts. vCenter Server's detailed performance charts are the key to unlocking the information necessary to determine why an ESXi host or VM is performing poorly. The performance charts expose a large number of performance counters across a variety of resource types, and vCenter Server offers functionality to save customized chart settings, export performance graphs as graphic figures or Excel workbooks, and view performance charts in a separate window.
- Master It You find yourself using the Chart Options link in the Advanced layout of the Performance tab to set up the same chart over and over again. Is there a way to save yourself some time and effort so that you don't have to keep re-creating the custom chart?
- Gather performance information using command-line tools. VMware supplies a few command-line tools that are useful in gathering performance information. For VMware ESXi hosts,
esxtopprovides real-time information about CPU, memory, network, or disk utilization. Finally, thevm-supporttool can gather performance information that can be played back later usingesxtop.- Master It Explain how to run
esxtopfrom the shell of an ESXi host.
- Master It Explain how to run
- Monitor CPU, memory, network, and disk usage by ESXi hosts and VMs. Monitoring usage of the four key resources—CPU, memory, network, and disk—can be difficult at times. Fortunately, the various tools supplied by VMware within vCenter Server can lead the vSphere administrator to the right solution. In particular, using customized performance charts can expose the right information that will help you uncover the source of performance problems.
- Master It A junior vSphere administrator is trying to resolve a performance problem with a VM. You've asked this administrator to see if it is a CPU problem, and the junior administrator keeps telling you that the VM needs more CPU capacity because the CPU utilization is high within the VM. Is the junior administrator correct, based on the information available to you?