
The Diagnostics Tools feature of Visual Studio provides you with historical information about your application in a debugging session. Along with Visual Studio 2013, Microsoft first introduced the Performance and Diagnostics hub feature which changed over time and was relaunched as Diagnostics Tools in Visual Studio 2015 with more limited options than the version currently available in Visual Studio 2017.
When you start a debugging session, the Diagnostics Tools window will automatically launch and show side-by-side of your code window. In case it is unavailable, you can launch it from the Visual Studio Debug | Windows | Show Diagnostics Tools menu or alternatively you can press the keyboard shortcut Ctrl + Alt + F2:

The window shows you detailed historical information about your application, PerfTips, in the events graph and events table. It also allows you to correlate execution time with the Memory and CPU utilization graph. You can take snapshots of the current memory utilization and enable/disable the CPU profiling in this screen:

In the preceding screenshot, check how the memory was utilized over time. The yellow arrow head means the time when the garbage collector was called, either automatically by the system or forcefully from the code:

To view all the events performed while debugging the context, switch to the Events tab. It gives you a new IntelliTrace experience in Visual Studio and saves you valuable debugging time. It captures additional events and useful information about the execution of your application, thus allowing you to identify the potential root causes of any issues. When an exception happens, it also maintains the history of the events where they occurred.
When you want to know more about a specific event, click the item from the list and activate Historical Debugging to set the debug window back to a time when the event occurred. You can then see the call stack, the values of local variables, and other important information available at the time when the event occurred:

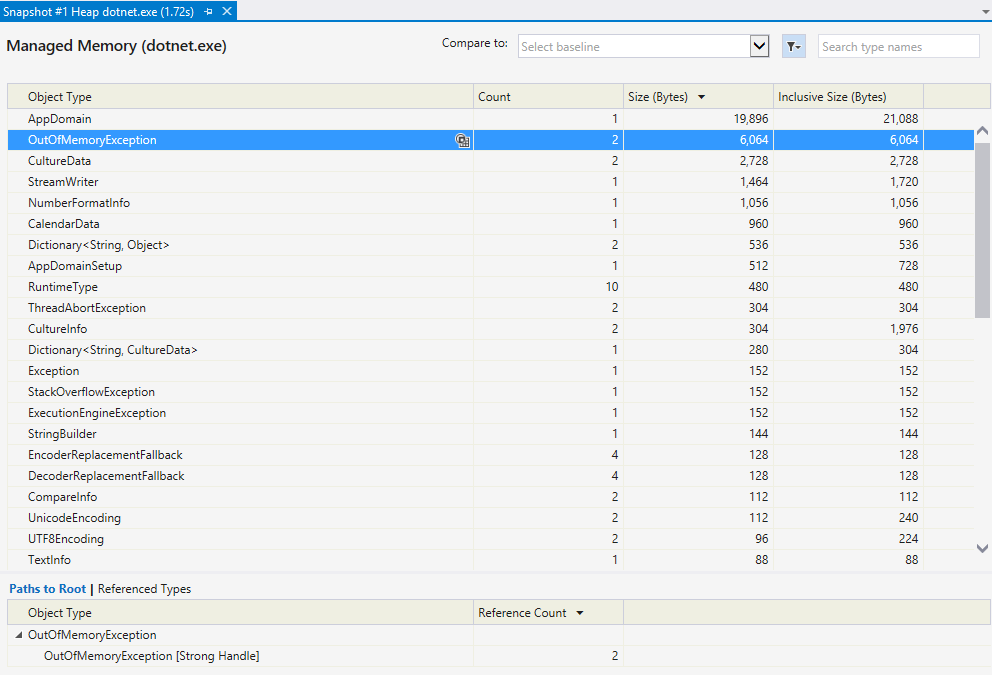
To know more about the memory utilization, navigate to the Memory Usage tab. Here you need to first take snapshots of the current memory usage by clicking the Take Snapshot button, as shown in the preceding screenshot.
Using this tab, you can monitor the memory usage (increased/decreased) and identify the memory issues while you are debugging your code. Clicking on the individual links in each item will give you more details about the snapshot and heap objects, as shown in the following screenshot:
The CPU Usage tab provides you details about the CPU utilization and tells you how many CPU resources were used by your code. You can correlate this information with the CPU usage graph shown in the tools window and find out the spike where a higher utilization took place, as shown in the following screenshot:

If you spot a potential issue when debugging, you can check this tab to get the per-function breakdown to identify the problem. Double clicking any item will give you details about the call tree, as shown in the following screenshot:

This provides the following details about each function that is available in the call tree:
- Total CPU %: This provides you the CPU activity in the selected function and functions it called. The information is provided in percentage value.
- Self CPU %: This provides the percentage of CPU activity in the selected function but not in the functions where it has been called.
- Module: This provides the name of the module where the call has been made.
By investigating these column values, you can easily identify the code block where the CPU utilization was higher and based on that you can optimize your code.
The diagnostic tool provides you with an option to enable/disable native profiling (the default is: disabled). Click the Select Tools | Settings... to open the diagnostic tools property pages, where you will be able to enable native heap profiling or native corruption detection, as shown in the following screenshot:
