Both administrators and ordinary users can benefit from monitoring the server and obtaining information about its general configuration and behavior. The Status, Variables, and Processes menu tabs can be used to get information about the MySQL server, or to act upon specific processes.
The server status statistics reflect the MySQL server's total activity, including (but not limited to) the activity generated by queries sent from phpMyAdmin.
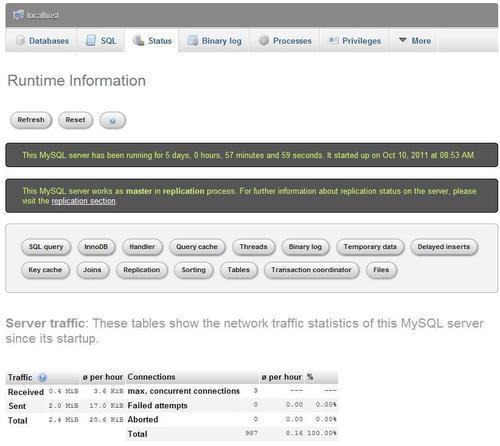
Clicking on the Status menu tab produces runtime information about the server. The page has several sections. First, we get information about the elapsed running time and the startup time. Then we get the total and average values, for traffic and connections (where the ø indicates average), as shown in the following screenshot:
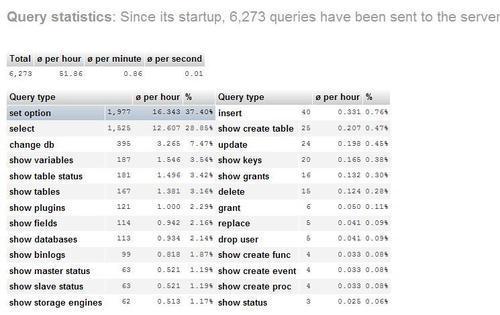
Next, the statistics about the queries are displayed (shown in part in the screenshot). The average number of queries per hour, minute, and second give a good indication of the server load.
The query statistics are followed by statistics about each MySQL statement executed, including:
- The absolute number of times each statement has been executed
- The hourly average of execution
- The percentage of execution for this statement compared to all statements
The presentation order is by descending percentage of utilization; in the following screenshot, we see that the set option statement is the one which is most received by this server with 37.40%:
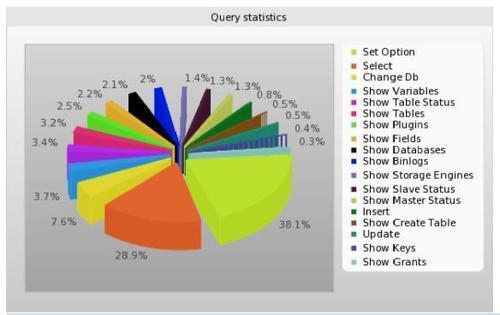
After Query statistics, a Show query chart link, when clicked, produces a chart displaying the popular query types on this server, as shown in the following screenshot:
Depending on the MySQL version, many other sections containing server information are also displayed.
The Variables page displays various settings for the MySQL server, which can be defined in, say, the my.cnf MySQL configuration file. These values can't be changed from within phpMyAdmin.
The Processes page is available to both superusers and normal users. A normal user would see only the processes belonging to him or her, whereas a superuser sees all of the processes.
This page lists all active processes on the server. There is a Kill link that allows us to terminate a specific process, as shown in the following screenshot:
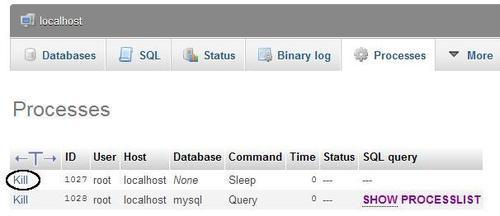
This example has only two running processes, including the one created by the SHOW PROCESSLIST command itself. This process is not killable because it's no longer running when we get to see the page. On a busy server, we would see more processes running.
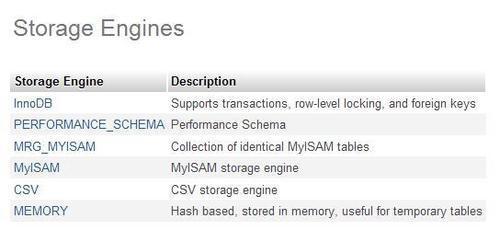
Information about the various storage engines is available in a two-level format. First, the Engines tab displays an overview of the possible engines for the current MySQL version. The names of the engines that are enabled on this server are clickable.
Secondly, a click on one engine name brings up a detailed panel about its settings. Hovering the mouse over the numbers in superscript reveals even more information about a particular setting.
The Charsets menu tab on the home page opens the Server view for the Charsets page, which lists the character sets and collations supported by the MySQL server. The default collation for each character set is shown with a different background color (using the row-marking color defined in $cfg['BrowseMarkerColor']).
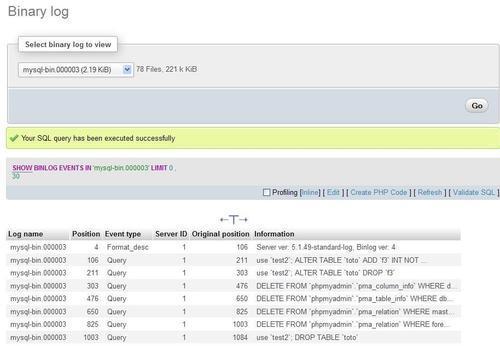
If MySQL's binary logging is active on our server, the menu in the Server view changes so that a Binary log tab appears. This tab gives access to an interface, through the SHOW BINLOG EVENTS command. This command produces the list of SQL statements that have updated data on our servers. This list could be huge, and currently phpMyAdmin does not limit its display with a pagination technique. Hence, we could hit the browser's memory limit, which depends on the particular browser we are using.
In the following screenshot, we choose the binary log that we want to examine (unless the server has only one binary log), and the statements are then displayed: