There are many ways to enter this mode. In fact, it is used each time the query results are displayed. We can enter this mode by clicking on the table name on the navigation panel, or by clicking Browse when we are in Table view for a specific table.
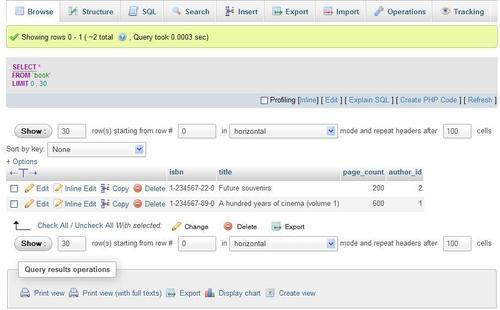
In the Browse results, the first part displayed is the query itself, along with a few links. The displayed links may vary depending on our actions and some configuration parameters.
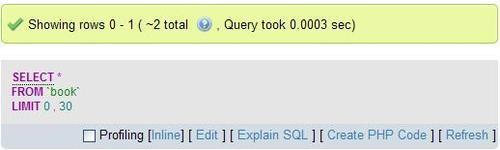
The following points describe the function of each link:
- The Profiling checkbox is covered in the Profiling queries section of this chapter.
- The Inline link permits to put the query inside a text area without reloading the page; then the query may be edited and the new query may be executed.
- The Edit link appears if
$cfg['SQLQuery']['Edit']is set toTRUE. Its purpose is to open the Query window so that you can edit this query (refer to Chapter 11 for more details). - Explain SQL is displayed if
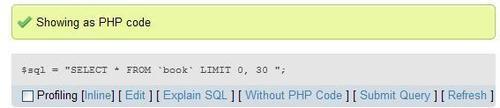
$cfg['SQLQuery']['Explain']is set toTRUE. We will see in Chapter 5 what this link can be used for. - The Create PHP Code link can be clicked to reformat the query to the syntax expected in a PHP script. It can then be copied and pasted directly at the place where we need the query in the PHP script we are working on. Note that after a click, this link changes to Without PHP Code (as shown in the following screenshot), which would bring back the normal query display. This link is available if
$cfg['SQLQuery']['ShowAsPHP']is set toTRUE.
- Refresh is used to execute the same query again. The results might change, as a MySQL server is a multi-user server, and other users or processes might be modifying the same tables. This link is shown if
$cfg['SQLQuery']['Refresh']is set toTRUE.
The Navigation bar is displayed at the top of results and also at the bottom. Column headers can be repeated at certain intervals among results depending on the value entered in repeat headers after field.
The bar enables us to navigate from page to page, displaying an arbitrary number of rows, starting at some point in the results. As we entered browse mode by clicking Browse, the underlying query that generated the results includes the whole table. However, this is not always the case.
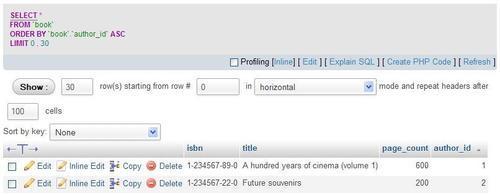
We are currently using a table containing a small number of rows. With larger tables, we could see a more complete set of navigation buttons. To simulate this, let us use the Show dialog to change the default number of rows from 30 to 1; we then click on Show. We can see that the navigation bar adapts itself as shown in the following screenshot:
This time, there are buttons labeled<<, <, >, and>> for easy access to the first page, previous page, next page, and the last page of the results respectively. The buttons appear only when necessary; for example, the first page button is not displayed if we already are on the first page. These symbols are displayed in this manner as the default setting of $cfg['NavigationBarIconic'] is TRUE. A FALSE here would produce buttons such as Next and End, whereas a value of'both' would display> Next and>> End.
Note
Note that the $cfg['NavigationBarIconic'] directive controls only the behavior of these navigation buttons; other buttons and links such as Edit are controlled by other configuration directives.
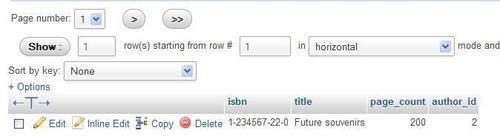
There is also a Page number drop-down menu, to go directly to one of the pages located near the current page. As there can be hundreds or thousands of pages, this menu is kept small and contains the commonly requested pages: a few page numbers before and after the current page, a few pages at the beginning and at the end plus a sample of page numbers based on a computed interval.
By design, phpMyAdmin always tries to give quick results, and one way to achieve this result is to add a LIMIT clause in SELECT. If a LIMIT clause is already there in the original query, phpMyAdmin will respect it. The default limit is 30 rows, set in $cfg['MaxRows']. If there are many users on the server, limiting the number of rows returned helps keeping the server load to a minimum.
Another button is available on the navigation bar, but must be activated by setting $cfg['ShowAll'] to TRUE. It would be very tempting for users to use this button often. Hence, on a multi-user installation of phpMyAdmin, it is recommended that the button be left to its default value of disabled (FALSE). When enabled, the navigation bar is augmented with a Show all button. Clicking on this button retrieves all the rows of the current results set, which might hit the execution time limit in PHP or a memory limit in the server; most browsers would also crash when asked to display thousands of rows. The exact number of rows that can be safely displayed cannot be predicted as it depends on the actual data present in columns and on the browser's capabilities.
A section labeled Query results operations is located under the results. It contains links to print the results (with or without the FULL TEXT columns), to export these results (refer to Exporting partial query results section in Chapter 6), or to create a view from this query (more on this in Chapter 17).
Another operation available is Display chart. To practice this, we will use a different query that selects only two columns. For this we can use the Inline link shown next to the query and change the query to:
SELECT page_count, author_id from book
Clicking on Go produces a result set with only those two columns; next we click on Display chart, which generates the following panel:
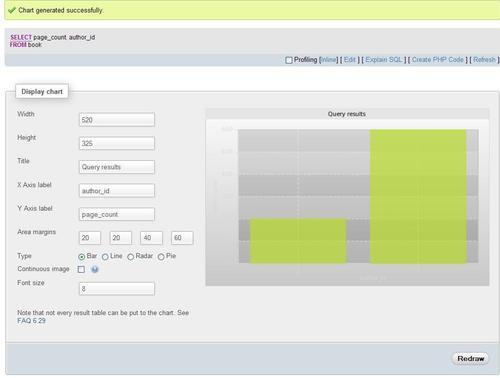
More details are available at http://wiki.phpmyadmin.net/pma/Charts.
In SQL, we can never be sure of the order in which the data is retrieved, unless we explicitly sort the data. Some implementations of the retrieving engine may show results in the same order as the one in which data was entered, or according to a primary key. However, a sure way to get results in the order we want is by sorting them explicitly.
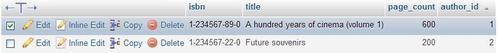
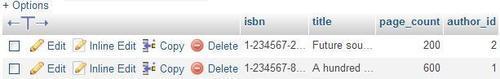
When browsing results are displayed, any column header can be clicked to sort on this column, even if it is not part of an index. Let us click on the author_id column header.
We can confirm that the sorting has occurred, by watching the SQL query at the top of screen; it contains an ORDER BY clause.
We now see a small triangle pointing upwards beside the author_id header. This means that the current sort order is 'ascending'. Hovering the mouse over the author_id header makes the triangle change direction, to indicate what will happen if we click on the header again—a sort by descending author_id values.
Another way to sort is by key. The Sort dialog shows all the keys already defined. Here we see a key named PRIMARY—the name given to our primary key on the isbn column when we checked Primary for this column at creation time:
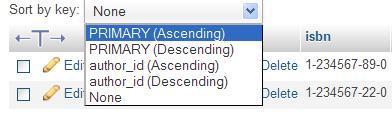
This might be the only way to sort on multiple columns at once (for multi-columns indexes).
The initial sort order is defined in $cfg['Order'] with ASC for ascending, DESC for descending, or SMART; the latter is the default sort order, which means that columns of type DATE, TIME, DATETIME, and TIMESTAMP would be sorted in descending order, whereas other column types will be sorted in ascending order.
Because we can change the number of rows displayed on a page, it is quite possible that we do not see the whole data. In this case, it would help to see headwords —indications about the first and last row of displayed data. This way, you can click on Next or Previous without scrolling to the bottom of the window.
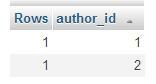
However, which column should phpMyAdmin base his headwords generation on? A simple assumption has been made: if you click on a column's header to indicate your intention of sorting on this column, phpMyAdmin uses this column's data as a headword. For our current book table, we do not have enough data to clearly notice the benefits of this technique. However, we can nonetheless see that after a sort, the top part of the screen now contains this message:
Showing rows 0 - 1 (2 total, Query took 0.0006 sec) [author_id: 1 - 2]
Here, the message between square brackets means that author_id number 1 is on the first displayed row and number 2 is on the last one.
When moving the mouse between rows (or between column headers), the row (or column) background color may change to the color defined in $cfg['BrowsePointerColor']. This parameter can be found in themes/<themename>/layout.inc.php. To enable this, browse pointer for all themes—$cfg['BrowsePointerEnable']—must be set to TRUE (the default) in config.inc.php.
It may be interesting to visually mark some rows when we have many columns in the table and must constantly scroll left and right to read data. Another usage is to highlight the importance of some rows for personal comparison of data, or when showing data to people. Highlighting is done by clicking on the row. Clicking again removes the mark on the row. The chosen color is defined by $cfg['BrowseMarkerColor'] (see themes/<themename>/layout.inc.php). This feature must be enabled by setting $cfg['BrowseMarkerEnable'] to TRUE, this time in config.inc.php. This sets the feature for all the themes. We can mark more than one row. Marking the row also activates the checkbox for this row.
Marking a column is done by clicking on the column header, but not on the column name itself.
In the previous examples, we always saw the full contents of each column, as each column had the number of characters within the limit defined by $cfg['LimitChars']. This is a limit enforced on all non-numeric columns. If this limit was low (say 10), the display would be as follows:
This would help us see more columns at the same time (at the expense of seeing less of each column).
In order to see the full texts, we will now make use of the Options slider, which reveals some display options. All these options will be explained in the chapters that cover the corresponding notions. The option that concerns us at the moment is the Partial Texts/Full Texts pair; we can choose Full Texts to see all of the text that was truncated. Even if we elect not to change the $cfg['LimitChars'] parameter, there will be a time when asking for full texts will be useful (when we work with TEXT column type—more on this in Chapter 5).
A quicker way of seeing the full texts is to click on the big T which is located just on top of the Edit and Delete icons. Another click on this T toggles the display from full to partial.
There is a quick way to display all distinct values and the number of occurrences for each value of a column. This feature is available on the Structure page of a table. For example, we want to know how many different authors we have in our book table and how many books each one wrote. On the line describing the column we want to browse (here author_id), we open the More menu and click on the Browse distinct values link.
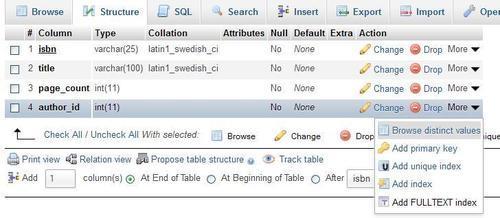
We have a limited test set, but can nonetheless see the results.