
One of the most common forms of IOT projects are those that monitor events using sensors providing the data either to another machine, cloud service, or local server (like an HTML server). One way to do that is to wire your MicroPython board up to a set of sensors and then log the data. You can find several examples of general data loggers on the Internet, but few combine the logging of data with a visualization component. Indeed, making sense of the data is the key to making a successful IOT solution.
In this project, we will explore combining data logging with data visualization. We will use the same HTML server technique from the last chapter as well as several techniques from previous chapters. We will also see how to use an analog sensor - a sensor that produces analog data that we will then have to interpret. In fact, we will rely on the analog-to-digital conversion (ADC) capabilities of our boards to change the voltage read to a value we can use. We will also see a bit more sophistication in the code as we leverage what we learned about classes and modules from Chapter 4.
The added complexity for this project isn’t new hardware or interfaces although we will see how to use the analog-to-digital converter class; the complexity is in the sophistication of the code. As you will see, the code used in this chapter is more modular and uses more functions than previous projects. For that reason alone, it is more complex. But, as you will see, the code isn’t difficult to learn and uses concepts we have seen in previous chapters.
Overview
In this chapter, we will implement a plant soil moisture monitoring solution (plant monitor for brevity). This will involve using one or more soil moisture sensors connected to our MicroPython board. We will set up a timer alarm (an interrupt) to run periodically to read the data from the sensors and store it in a comma-separated value (CSV) file.
Figure 10-1 depicts a conceptual drawing of the project. The MicroPython board will read the data from the soil moisture sensors and then display it via a HTML web page upon request.

Figure 10-1. Plant Monitoring Project Concept
The user interface for this project is a web page that consists of a table that includes all the data read from the log file. This is how we can overcome potential issues of running the HTML server in a loop. That is, we do not have to interrupt the loop to read the sensors - that’s done via the timer alarm callback. Sadly, this technique only works for the WiPy and similar boards. We will have to use a different technique for the Pyboard.
By separating the sensor reading from the display, we can reuse or modify either without confusing ourselves as we dig into the code. For example, so long as the visualization component reads the sensor data from the file, it doesn’t matter to the sensor reading code how it is used. The only interface or connection between these two parts is the format of the file and since we’re using a CSV file, it is very easy to read and use in our code.
To make things more interesting and to make it easier to code, we will place all the sensor code in a separate code module. Recall, this is a technique used to help reduce the amount of code in any one module thereby making it easier to write and maintain.
Now let’s see what components are needed for this project and then we will see how to wire everything together.
Note
Since we are well into our third project and have seen many of the techniques employed in this project, the discussion on the required components, wiring, and setup of the hardware shall be brief.
Required Components
Table 10-1 lists the components you will need. You can purchase the components separately from Adafruit (adafruit.com), Sparkfun (sparkfun.com), or any electronics store that carries electronic components. Links to vendors are provided should you want to purchase the components. When listing multiple rows of the same object, you can choose one or the other - you do not need both. Also, you may find other vendors that sell the components. You should shop around to find the best deal. Costs shown are estimates and do not include any shipping costs.
Table 10-1. Required Components
Component | Qty | Description | Cost | Links |
|---|---|---|---|---|
MicroPython board | 1 | Pyboard v1.1 with headers | $45-50 | https://www.adafruit.com/product/2390 https://www.adafruit.com/product/3499 |
WiPy | $25 | |||
Soil Moisture Sensor | 1+ | Soil Moisture Sensor | $6 | |
Networking Module (Pyboard) | 1 | CC3000 breakout board (or equivalent) | $15+ | various |
Real-Time Clock | 1 | RTC optional for Pyboard and other boards without NTP support | $10+ | |
Jumper wires (WiPy) | 3* | M/M jumper wires, 6” (cost is for a set of 10 jumper wires) | $4 | |
Jumper wires (Pyboard) | 15+ | M/M jumper wires, 6” (cost is for a set of 10 jumper wires) | $4 | |
Power | 1 | USB cable to get power from PC | Use from your spares | |
1 | USB 5V power source and cable | Use from your spares |
The number of jumper wires needed will vary depending on how many sensors you are using and whether you are using a MicroPython board that needs a networking module. You will need three jumpers for each sensor and, if you are using the CC3000 SPI breakout board, eight additional wires. If you plan to use the Pyboard, you will also want to add a real-time clock to keep time while powered off.
The Pyboard firmware has no network time protocol (NTP) server support. Thus, you must either initialize the onboard RTC each time you power on the board, attach a backup battery to the board (see the underside of the board – you will see the pins you will need to solder), or add a real-time clock module.
Soil moisture sensors come in a variety of formats but most have two prongs that are inserted into the soil and using a small electrical charge, measure the resistance between the prongs. The higher the value read, the more moisture is in the soil. However, there is a bit of configuration needed to obtain reliable or realistic thresholds. While the manufacturer will have threshold recommendations, some experimentation may be needed to find the right values.
These sensors can also be affected by environmental factors including the type of pot the plant is in, the soil composition, and other factors. Thus, experimenting with a known overwatered soil, dry soil, and properly tended soil will help you narrow down the thresholds for your environment.
Figure 10-2 shows a soil moisture sensor from Sparkfun that has a terminal mount instead of pins. You can find several varieties of these sensors. Just pick the one you want to use, keeping in mind you may need different jumpers to connect it to your board.
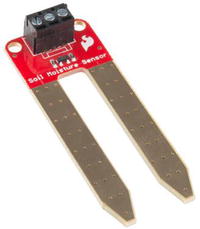
Figure 10-2. Soil Moisture Sensor (courtesy of sparkfun.com)
Of special note is how these soil moisture sensors work. If you were to leave the sensors powered on, they can degrade over time. The metal on the prongs can become degraded due to electrolysis thereby dramatically reducing its lifespan. You can use a technique of a GPIO pin to power the sensor by turning the pin on when you want to read a value. Keep in mind there will be a small delay while the sensor settles, but we can use a simple delay to wait and then read the value and turn the sensor off. In this way, we can extend the life of the sensor greatly.
Fortunately, the wiring for this project is less complex than the last two projects. Now, let’s see how to wire the components together.
Set Up the Hardware
Table 10-2 shows the connections needed for this project. This shows only two sensors, but you can add several more if you’d like. However, it is recommended you start with one sensor until you get the project working and then add additional sensors. If it is easier, you can use a breadboard to connect the sensors to the MicroPython board, but depending on where you plan to place the board, you may not need it. It is your choice.
Table 10-2. Connections for the MicroPython (Pyboard and WiPy)
MicroPython Board | |||
|---|---|---|---|
WiPy | Pyboard | Component | Wire Color |
P13 | X19 | Sensor 1: VCC | |
GND | GND | Sensor 1: GND | |
P19 | X20 | Sensor 1: SIG | |
P14 | X21 | Sensor 2: VCC | |
GND | GND | Sensor 2: GND | |
P20 | X22 | Sensor 2: SIG | |
Of course, you must insert the soil moisture sensors into the soil of your plants. If your plants are located further away from your power source, you may need to use longer wires to connect the sensors. You should start with a single, small plant and one sensor (or for testing, two sensors in one plant) that you can place close to your PC (or power source).
Caution
You will need soil moisture sensors that can operate at 3.3–5V. Some MicroPython boards may limit output on the pins to 3.3V. The sensors from Sparkfun are compatible.
Let us see how to make the connections shown in the chart for the WiPy and Pyboard.
WiPy
Wiring for the WiPy is best done orienting the board with the USB connector to the left. Figure 10-3 shows the wiring diagram for the WiPy. Notice the use of a small breadboard to help with the ground connections. Notice also Sensor 1 is on the left and Sensor 2 is on the right.
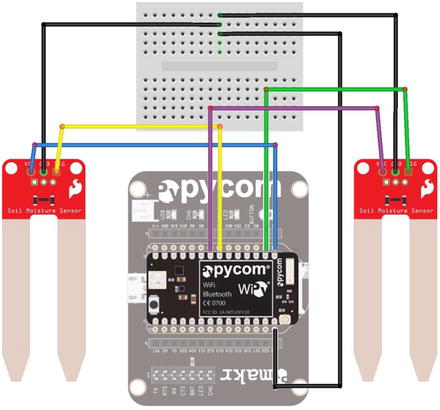
Figure 10-3. Wiring the Plant Monitor (WiPy)
Pyboard
Wiring for the Pyboard is best done orienting the board with the USB connector to the left. Figure 10-4 shows the wiring diagram for the Pyboard. You will likely want to use a breadboard so you can connect your networking module like the one shown. Notice also Sensor 1 is on the left and Sensor 2 is on the right.
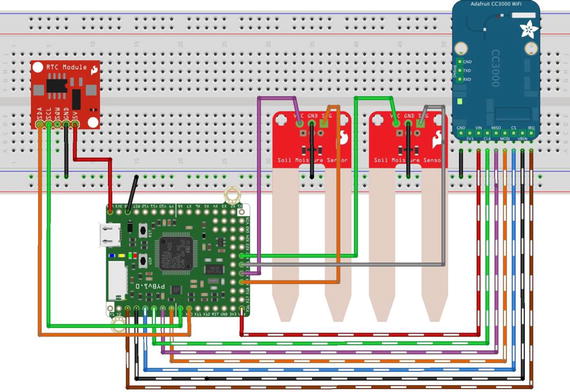
Figure 10-4. Wiring the Plant Monitor (Pyboard)
Once again, always make sure to double-check your connections before powering the board on. Now, let’s talk about the code we need to write. Don’t power on your board just yet – there is a fair amount of discussion needed before we’re ready to test the project.
Write the Code
Now it’s time to write the code for our project. The code is longer than what we’ve seen thus far, and due to all the bits and bobs we’re working with, it is best to divide the project into parts. So, we are going to write the code in two stages. We won’t have a working project until the end, so most of the discussion will be about the individual parts. We will put it all together before testing the project.
Recall from the overview, we will have two major components: the main code and a code module that encapsulates the soil sensors. We will place the HTML server code and supporting functions in the main code module. However, before we embark on the code for the project, we should calibrate our sensors. Let’s do that now.
Note
These sections demonstrate the code for the WiPy. This project is best suited for the WiPy and boards with similar capabilities: namely, WiFi and NTP support. Differences for implementing the project on Pyboard and Pyboard clone boards are given at the end of the chapter. As you will see, it is a bit more work to get the project working on those boards.
Calibrating the Sensor
Calibration of sensors is very important. This is especially true for soil moisture sensors because there are so many different versions available. These sensors are also very sensitive to the soil composition, temperature, and even the type of pot in which the plant lives. Thus, we should experiment with known soil moisture so we know what ranges to use in our code.
More specifically, we want to classify the observation from the sensor so that we can determine if the plant needs watering. We will use the values “dry”, “Ok”, and “wet” to classify the value read from the sensor. Seeing these labels is much easier for us to determine – at a glance – whether the plant needs watering. In this case, the raw data such as a value of 1756 may not mean much, but if we see “dry”, we know it needs water.
Since the sensors are analog sensors, we will use the analog-to-digital conversion on the board. When we read the data from the pin, we will get a value in the range of 0-4096. This value is related to the resistance the sensor reads in the soil. Low values indicate dry soil and high values indicate wet soil.
However, the sensors from different vendors can vary widely in the values read. For example, sensors from Sparkfun tend to read values in the range 0-1024 but sensors from other vendors can read as high as 4096. Fortunately, they all seem to be consistent in that the lower the value, the drier the soil.
So, we must determine thresholds for the three classifications. Again, there are several factors that can influence the values read from the sensor. Thus, you should select several pots of soil including one that you feel is dry, another that is correctly watered, and a third that is overwatered. The best thing to do is select one that is dry, take measurements, then water it until the soil moisture is correct, measure that, then water it again until there is too much water.1
To determine the threshold, we must first write a short bit of code to set up our board for reading values from the sensor. This includes choosing a GPIO pin that supports ADC. Check the reference drawing for your board to be certain which GPIO pins are included. For example, on the WiPy, there are several ADC GPIO sections including those in the range P13-P18.
We also need to choose a pin to use to power the board. This is also an analog output pin. Finally, we will write a loop to read several values every 5 seconds and then average them. Five seconds is an arbitrary value and it was derived from reading the datasheet for the sensor. Check your sensors to see how much time is needed for the read to settle (may be under the heading of frequency of reads). Listing 10-1 shows the code needed to setup the analog-to-digital channel, a pin to use for powering the sensor, and a loop for reading 10 values and averaging them.
Listing 10-1. Calibrating the Soil Moisture Threshold (WiPy)
# MicroPython for the IOT - Chapter 10## Project 3: MicroPython Plant Monitoring## Threshold calibration for soil moisture sensors## Note: this only runs on the WiPy.from machine import ADC, Pinimport utime# Setup the ADC channel for the read (signal)# Here we choose pin P13 and set attn to 3 to stabilize voltageadc = ADC(0)sensor = adc.channel(pin='P13', attn=3)# Setup the GPIO pin for powering the sensor. We use Pin 19power = Pin('P19', Pin.OUT)# Turn sensor offpower.value(0)# Loop 10 times and average the values readprint("Reading 10 values.")total = 0for i in range (0,10):# Turn power onpower.value(1)# Wait for sensor to power on and settleutime.sleep(5)# Read the valuevalue = sensor.value()print("Value read: {0}".format(value))total += value# Turn sensor offpower.value(0)# Now average the valuesprint("The average value read is: {0}".format(total/10))
If you enter this code in a file named threshold.py, you can copy it to your WiPy and execute it. Listing 10-2 shows the output of running this calibration code in a plant that is correctly watered.
Listing 10-2. Running the Calibration Code (WiPy)
>>> import thresholdReading 10 values.Value read: 1724Value read: 1983Value read: 1587Value read: 1702Value read: 1634Value read: 1525Value read: 1874Value read: 1707Value read: 1793Value read: 1745The average value read is: 1727.4>>>
Here we see an average value of 1727 (always round the number – you need integers). Further tests running the code on dry soil resulted in a value of 425 and for a wet plant, 3100. Thus, the thresholds for this example are 500 for dry, 2500 for wet. However, your results may vary greatly so make sure to run this code with your sensors, board, and plant of choice.
Tip
To make things easier for calibrating the thresholds, use sensors from the same vendor. Otherwise, you may have to use a different set of thresholds for each sensor supported.
Notice the values read. As you can see, the values can vary from one moment to another. This is normal for these sensors. They are known for producing some jumpy values. Thus, you should consider sampling the sensor more than once to get an average over a short period rather than a single value. Even taking an average can be skewed slightly if one or more of the samples is off by a large margin. However, sampling even 10 values and averaging will help reduce the possibility of getting an anomalous reading. We will do this in our project code.
Now that we have our threshold values for our sensors, we can begin with the code module for the sensors.
Part 1: Sensor Code Module
The first part of the project will be to create a code module to contain a new class named PlantMonitor that contains all the functionality to read data from the sensors and save the data to a file. In this section, we will see how to write the code for the module. If you want to follow along writing the code, you can open a new file and name it plant_monitor.py. Let’s start by looking at the high-level design.
High-Level Design
As we learned earlier, it is a good idea to create a design for each code module (class) we want to use. We will use the code module from the main code. Thus, we need functions to tell the class to read the sensors and a way to get the filename the class uses for the data.
Typically, one would design a code module to completely hide a file and all operations on it, but in this case the class is only concerned with reading the sensors and writing the data. Plus, since the main code needs to read the data and format it with HTML tags, it is more appropriate to place the read function in the main code. That is, you should strive to keep like code functions together, which helps maintaining the code. For example, keeping all the HTML code in one file makes modifying the HTML code (or reusing it) easier.
We will use a timer interrupt to read the sensors. This allows us to set up a function to be called periodically without the need to monitor or poll the time and call the function directly. We provide the clear log function as a convenience. Thus, we will only need two public functions: one to clear the log and another to fetch the filename. Aside from initializing the class, we only need to get the filename when we want to refresh the data (send it to the client). Table 10-3 shows the functions for the Plant Monitoring class.
Table 10-3. High-Level Design (Functions) Plant Monitor Class
Function | Parameters | Description |
|---|---|---|
__init__() | rtc | Initialization for the class (the constructor) |
clear_log() | Clear the log | |
get_filename() | Get the filename we're using after the check for SD card | |
_get_value() | sensor, power | Read the sensor 10 times and average the values read |
_read_sensors() | line | Monitor the sensors, read the values, and save them |
_convert_value() | value | Convert the raw sensor value to an enumeration |
Notice the first function named __init__(). This is the constructor for the class and will be called when the class is instantiated from our main code. Notice also the private methods are named with a single underscore.
The following sections explain the initialization code and the functions needed. We will see the complete code in a later section.
Setup and Initialization
In this section, we discuss the code we need to set up and initialize the code module. First, there are a few imports we need including those for the analog-to-digital converter, pin, secure disk (SD), timer, and the operating system libraries.
We will also need some constants defined for the class. Recall we want to classify the soil moisture read with an enumeration. To do so, we will need to use the thresholds we determined for the classification. We can use constants at the top of the file to make it easier to change them later should we need to adjust the code for use with other sensors or the conditions of our plants changes (different pot, soil, environment, etc.). We can use the same philosophy to set the name of the file to contain the data.
We also use a constant to define the frequency for reading the sensors. Since we will use a loop to read the sensor waiting 5 seconds for each read, we will need a minimum of 50-55 seconds to read 10 values. Thus, we cannot set the update frequency to anything less than about one minute. The frequency is in seconds. While you may want to set this to a low value for testing, you certainly do not want to check the soil moisture of your plants every minute. That is, how often to you check your plants normally? Once every few days or once a day? Why check it sooner than normal?
Finally, we need a function that converts a time structure to a string. Recall from an earlier example, we can use a simple format specification. We will use a module-level private function for that feature.
Listing 10-3 shows the code for the setup and initialization section . Place this at the top of the file.
Listing 10-3. Plant Monitor Class Setup and Initialization (WiPy)
from machine import ADC, Pin, SD, Timerimport osimport utime# Thresholds for the sensorsLOWER_THRESHOLD = 500UPPER_THRESHOLD = 2500UPDATE_FREQ = 120 # seconds# File name for the dataSENSOR_DATA = "plant_data.csv"# Format the time (epoch) for a better viewdef _format_time(tm_data):# Use a special shortcut to unpack tuple: *tm_datareturn "{0}-{1:0>2}-{2:0>2} {3:0>2}:{4:0>2}:{5:0>2}".format(*tm_data)
Constructor
The constructor for the class is where all the major work takes place. There are several things we need to do including the following.
Normalize the location (path) of the data file
Set up the sensors in a dictionary stored in a list
Set up the timer interrupt to read the sensors periodically
We normalize the path to the data file by attempting to use the SD card. If the SD card cannot be found, we default to the flash drive. However, you should avoid writing data to the flash drive since the driver is smaller and can fill up, and writing to the flash drive increases the risk of corrupting the drive or causing problems during execution.
We use a dictionary for each sensor so we can define the pin for the sensor, pin for powering the sensor, sensor number (an arbitrary identification), and the location of the sensor. We then place the dictionaries in a list to make it easy to read all the sensors at the same time using a loop.
Finally, we set up an interrupt via the timer alarm class to read the sensors periodically. Listing 10-4 shows the code for the class constructor.
Listing 10-4. Plant Monitor Class Constructor (WiPy)
def __init__(self, rtc):self.rtc = rtc# Try to access the SD card and make the new pathtry:sd = SD()os.mount(sd, '/sd')self.sensor_file = "/sd/{0}".format(SENSOR_DATA)print("INFO: Using SD card for data.")except:print("ERROR: cannot mount SD card, reverting to flash!")self.sensor_file = SENSOR_DATAprint("Data filename = {0}".format(self.sensor_file))# Setup the dictionary for each soil moisture sensoradc = ADC(0)soil_moisture1 = {'sensor': adc.channel(pin='P13', attn=3),'power': Pin('P19', Pin.OUT),'location': 'Green ceramic pot on top shelf','num': 1,}soil_moisture2 = {'sensor': adc.channel(pin='P14', attn=3),'power': Pin('P20', Pin.OUT),'location': 'Fern on bottom shelf','num': 2,}# Setup a list for each sensor dictionaryself.sensors = [soil_moisture1, soil_moisture2]# Setup the alarm to read the sensorsa = Timer.Alarm(handler=self._read_sensors, s=UPDATE_FREQ,periodic=True)print("Plant Monitor class is ready...")
Notice the code for the timer alarm. Here we define the handler (callback) for the interrupt, the frequency using the constant we defined at the top of the tile, and set it to fire every N seconds (periodically).
Public Functions
There are only two public functions. The first, clear_log(), simply opens the file for writing and closes it. This effectively empties the file. The function is provided for convenience. The second function, get_filename(), simply returns the name of the file used to store data. This name is not the same as the name in the constant SENSOR_DATA because we normalized the path in the constructor as shown in the previous section.
Private Functions
There are three private functions. The _get_value() function is the same code from our threshold calibration code where we sample the sensor 10 times and average the value. The _read_sensors() function is the callback for the timer alarm interrupt that reads all the sensors we have defined and saves the data to the file. The _convert_value() function is a helper function to determine the classification of the soil based on the sensor data. This function returns a string or “dry”, “Ok”, or “wet”.
Complete Code
Now that we have seen all the parts of the code module, let’s look at the completed code. Listing 10-5 shows the complete code for the Plant Monitor code module. Once again, we can save this file as plant_monitor.py.
Listing 10-5. Plant Monitor Code Module Complete Code (WiPy)
# MicroPython for the IOT - Chapter 10## Project 3: MicroPython Plant Monitoring## Plant monitor class## Note: this only runs on the WiPy.from machine import ADC, Pin, SD, Timerimport osimport utime# Thresholds for the sensorsLOWER_THRESHOLD = 500UPPER_THRESHOLD = 2500UPDATE_FREQ = 120 # seconds# File name for the dataSENSOR_DATA = "plant_data.csv"# Format the time (epoch) for a better viewdef _format_time(tm_data):# Use a special shortcut to unpack tuple: *tm_datareturn "{0}-{1:0>2}-{2:0>2} {3:0>2}:{4:0>2}:{5:0>2}".format(*tm_data)class PlantMonitor:"""This class reads soil moisture from one or more sensors and writes thedata to a comma-separated value (csv) file as specified in the constructor."""# Initialization for the class (the constructor)def __init__(self, rtc):self.rtc = rtc# Try to access the SD card and make the new pathtry:sd = SD()os.mount(sd, '/sd')self.sensor_file = "/sd/{0}".format(SENSOR_DATA)print("INFO: Using SD card for data.")except:print("ERROR: cannot mount SD card, reverting to flash!")self.sensor_file = SENSOR_DATAprint("Data filename = {0}".format(self.sensor_file))# Setup the dictionary for each soil moisture sensoradc = ADC(0)soil_moisture1 = {'sensor': adc.channel(pin='P13', attn=3),'power': Pin('P19', Pin.OUT),'location': 'Green ceramic pot on top shelf','num': 1,}soil_moisture2 = {'sensor': adc.channel(pin='P14', attn=3),'power': Pin('P20', Pin.OUT),'location': 'Fern on bottom shelf','num': 2,}# Setup a list for each sensor dictionaryself.sensors = [soil_moisture1, soil_moisture2]# Setup the alarm to read the sensorsa = Timer.Alarm(handler=self._read_sensors, s=UPDATE_FREQ,periodic=True)print("Plant Monitor class is ready...")# Clear the logdef clear_log(self):log_file = open(self.sensor_file, 'w')log_file.close()# Get the filename we're using after the check for SD carddef get_filename(self):return self.sensor_file# Read the sensor 10 times and average the values readdef _get_value(self, sensor, power):total = 0# Turn power onpower.value(1)for i in range (0,10):# Wait for sensor to power on and settleutime.sleep(5)# Read the valuevalue = sensor.value()total += value# Turn sensor offpower.value(0)return int(total/10)# Monitor the sensors, read the values and save themdef _read_sensors(self, line):log_file = open(self.sensor_file, 'a')for sensor in self.sensors:# Read the data from the sensor and convert the valuevalue = self._get_value(sensor['sensor'], sensor['power'])print("Value read: {0}".format(value))time_data = self.rtc.now()# datetime,num,value,enum,locationlog_file.write("{0},{1},{2},{3},{4} ".format(_format_time(time_data),sensor['num'], value,self._convert_value(value),sensor['location']))log_file.close()# Convert the raw sensor value to an enumerationdef _convert_value(self, value):# If value is less than lower threshold, soil is dry else if it# is greater than upper threshold, it is wet, else all is well.if (value <= LOWER_THRESHOLD):return "dry"elif (value >= UPPER_THRESHOLD):return "wet"return "ok"
Wow, that’s a lot of code! Take some time to read through it until you understand all the parts of the code.
Changes for the Pyboard
There are considerably more changes needed for this project to run on the Pyboard. The main reasons for this include the usual changes we need for the imports, the pin class high/low versus value, and differences in how we use the real-time clock. Finally, the Pyboard does not support timer alarm class interrupts so we must use a polling technique to read the sensors. This last change means we must make the read_sensors() function a public function so we can call it from the main code.
Since the changes are numerous, a difference file is nearly the same length as the actual code.2 Thus, we will see the complete code for the Pyboard. Listing 10-6 shows the complete code for the code module with the differences needed to adapt the code module to the Pyboard (in bold). While most changes are minimal, if you are using the Pyboard or a Pyboard clone, take note of the pins used for the sensor.
Listing 10-6. Plant Monitor Code Module Complete Code (Pyboard)
# MicroPython for the IOT - Chapter 10## Project 3: MicroPython Plant Monitoring## Plant monitor class## Note: this only runs on the Pyboard.from pyb import ADC, delay, Pin, SDimport osimport pyb# Thresholds for the sensorsLOWER_THRESHOLD = 500UPPER_THRESHOLD = 2500UPDATE_FREQ = 120 # seconds# File name for the dataSENSOR_DATA = "plant_data.csv"# Format the time (epoch) for a better viewdef _format_time(tm_data):# Use a special shortcut to unpack tuple: *tm_datareturn "{0}-{1:0>2}-{2:0>2} {3:0>2}:{4:0>2}:{5:0>2}".format(*tm_data)class PlantMonitor:"""This class reads soil moisture from one or more sensors and writes thedata to a comma-separated value (csv) file as specified in the constructor."""# Initialization for the class (the constructor)def __init__(self, rtc):self.rtc = rtc# Try to access the SD card and make the new pathtry:self.sensor_file = "/sd/{0}".format(filename)f = open(self.sensor_file, 'r')f.close()print("INFO: Using SD card for data.")except:print("ERROR: cannot mount SD card, reverting to flash!")self.sensor_file = SENSOR_DATAprint("Data filename = {0}".format(self.sensor_file))# Setup the dictionary for each soil moisture sensorsoil_moisture1 = {'sensor': ADC(Pin('X19')),'power': Pin('X20', Pin.OUT_PP),'location': 'Green ceramic pot on top shelf','num': 1,}soil_moisture2 = {'sensor': ADC(Pin('X20')),'power': Pin('X21', Pin.OUT_PP),'location': 'Fern on bottom shelf','num': 2,}# Setup a list for each sensor dictionaryself.sensors = [soil_moisture1, soil_moisture2]# Setup the alarm to read the sensorsself.alarm = pyb.millis()print("Plant Monitor class is ready...")# Clear the logdef clear_log(self):log_file = open(self.sensor_file, 'w')log_file.close()# Get the filename we're using after the check for SD carddef get_filename(self):return self.sensor_file# Read the sensor 10 times and average the values readdef _get_value(self, sensor, power):total = 0# Turn power onpower.high()for i in range (0,10):# Wait for sensor to power on and settledelay(5000)# Read the valuevalue = sensor.read()total += value# Turn sensor offpower.low()return int(total/10)# Monitor the sensors, read the values and save themdef read_sensors(self):if pyb.elapsed_millis(self.alarm) < (UPDATE_FREQ * 1000):returnself.alarm = pyb.millis()log_file = open(self.sensor_file, 'a')for sensor in self.sensors:# Read the data from the sensor and convert the valuevalue = self._get_value(sensor['sensor'], sensor['power'])print("Value read: {0}".format(value))time_data = self.rtc.datetime()# datetime,num,value,enum,locationlog_file.write("{0},{1},{2},{3},{4} ".format(_format_time(time_data),sensor['num'], value,self._convert_value(value),sensor['location']))log_file.close()# Convert the raw sensor value to an enumerationdef _convert_value(self, value):# If value is less than lower threshold, soil is dry else if it# is greater than upper threshold, it is wet, else all is well.if (value <= LOWER_THRESHOLD):return "dry"elif (value >= UPPER_THRESHOLD):return "wet"return "ok"
Ok, now we’re ready to look at the main code.
Part 2: Main Code
The main code is like the code for the last project. However, this time we will use a file to store the HTML code (since it doesn’t change) and a single HTML string for populating a HTML table with the data from the file. We will also add code to read the date and time from a network time protocol (NTP) server.
Unlike the last project, the HTML code does not include a button but we can format a command manually on the URL. We can use this technique to allow access to commands without using buttons or other user interface features. It also helps to make these commands harder to use to prevent overuse. For example, we can provide a clear logs command. We would use a URL like http://192.168.42.140/CLEAR_LOG, which submits a GET request to the HTML server. We can capture that command and clear the log when it is issued.
Caution
If you build commands like this, be sure to use them carefully. That is, setting your URL to http://192.168.42.140/CLEAR_LOG and pressing enter issues the command. Refreshing the page will reissue the command! When you use the command, be sure to clear your URL before refreshing or, better, use it once and close the page/tab.
The following sections explain the initialization code and the functions needed. We will see the complete code in a later section. Let’s start with the HTML code.
HTML Code (Files)
We will store the HTML code needed in files to save memory. Recall by reading a row at a time – we do not have to take up space with the strings in our code. As your projects grow in complexity, this could become an issue. Thus, this project demonstrates a way to save some memory.
The HTML for this project creates a web page with a simple table that includes all the data in the file at the time of the request. To make things easier, we will use three files. The first file (named part1.html) will contain the HTML code up to the table rows; the second file (named plant_data.csv), which is populated by the PlantMonitor class; and the third (named part2.html) will contain the remaining HTML code.
The first file, part1.html, is shown in Listing 10-7. This file establishes the table HTML code. It also establishes characteristics for the table including text alignment, border size, and padding – all through cascading style (<style> tag). Don’t worry if this looks strange or alien. You can google for W3C standards to see how we use the tag to control the style of the web page.
Listing 10-7. HTML Code (part1.html)
<!DOCTYPE html><html><head><title>MicroPython for the IOT - Project 3</title><meta http-equiv="refresh" content="30"><style>table, th, td {border: 1px solid black;border-collapse: collapse;}th, td {padding: 5px;}th {text-align: left;}</style></head><center><h2>MicroPython for the IOT - Project 3</h2></center><br><center>A simple project to demonstrate how to retrieve sensor data over the Internet.</center><center><br><b>Plant Monitoring Data</b><br><br><table style="width:75%"><col width="180"><col width="120"><col width="100"><col width="100"><tr><th>Datetime</th><th>Sensor Number</th><th>Raw Value</th><th>Moisture</th><th>Location</th></tr>
Notice the table code. Again, don’t worry if this seems strange. It works and it is very basic. Those familiar with HTML may want to embellish and improve the code. The last line establishes the header for the table.
The second file, plant_data.csv, contains the data. We will use a constant to populate a properly formatted HTML table row. The following shows an example of what a row of data would look like in the file and how that data is transformed to HTML. We will see the HTML for the table row in the next section.
# Raw data2017-08-08 20:26:17,1,78,dry,Small fern on bottom shelf# HTML table row<tr><td>2017-08-08 20:26:17</td><td>1</td><td>78</td><td>dry</td><td>Small fern on bottom shelf </td></tr>
The last file, part2.html, contains the closing tags so it isn’t very large. But since we’re reading from files, we include this file. The following shows the code in the second file.
</table></center></html>
So, how do we use these files? When we send a response back to the client (the web page), we read the first file sending one row at a time, then read the data file sending one row at a time, then read the last file sending one row at a time. We will use a helper function to read the data file. Listing 10-8 shows the code used to do this.
Listing 10-8. Reading the HTML and Data File (WiPy)
# Read HTML from file and send to client a row at a time.def send_html_file(filename, client):html = open(filename, 'r')for row in html:client.send(row)html.close()# Send the sensor data to the client.def send_sensor_data(client, filename):send_html_file("part1.html", client)log_file = open(filename, 'r')for row in log_file:cols = row.strip(" ").split(",") # split row by commas# build the table string if all parts are thereif len(cols) >= 5:html = HTML_TABLE_ROW.format(cols[0], cols[1], cols[2],cols[3], cols[4])# send the row to the clientclient.send(html)log_file.close()send_html_file("part2.html", client)
Imports
The imports we need for the project include those for the real-time clock, sys, usocket, utime, machine, and WLAN. These are now quite familiar. The last line imports the PlantMonitor class from the plant_monitor code module. The complete list of imports is shown below. If you want to follow along, open a new file and name it plant_wipy.py.
# Imports for the projectfrom machine import RTCimport sysimport usocket as socketimport utimeimport machinefrom network import WLANfrom plant_monitor import PlantMonitor
We also need a string we can use to create the rows for the table. The HTML code that occurs before this line is saved in files as described above. The following shows the string used. Notice we use replacement syntax so that we can use the format() function to fill in the details.
# HTML web page for the projectHTML_TABLE_ROW = "<tr><td>{0}</td><td>{1}</td><td>{2}</td><td>{3}</td><td>{4}</td></tr>"
Imports
We also want to connect the project to our network. We use the same code as we used in previous projects and examples but instead make it a function named connect(), which we will call from the main run() function. Be sure to change the SSID and password to match your network.
Network Time Protocol
Since we are saving data that has a time element (you want to know when you sampled the soil moisture), we need to store the date and time with the data. The easiest way to do this is to use a network time protocol (NPT) server : that is, provided the board is connected to the Internet. If it is not connected to the Internet, we must use a RTC module or initialize the onboard RTC at startup. We saw how to use a NTP server in Chapter 5. We repeat it in this project as a function named get_ntp(), which we will call from the main run() function.
The run() Function
The HTML server portion of the run() function is like the last project but instead of processing form requests, we send the web page back to the client by default. The only command supported is the CLEAR_LOG command, which requires specifying it on the URL on the client as described above.
Another difference is instead of placing code in the global section of the code file (so that it executes when we import the file in our REPL console or main.py file), we use functions to connect to the network, set up the NTP, and send the HTML code to the client. This is an escalation of complexity that you should start using as general practice. We did not see this in earlier projects so that we could concentrate on getting the code complete. When writing your own projects, be sure to use functions to contain code and call the functions from your other code.
Since this is different from the last project, we will look at the code. Listing 10-9 shows the code for the run() function.
Listing 10-9. Plant Monitor Run() Function (WiPy)
# Setup the socket and respond to HTML requestsdef run():# Connect to the networkif not connect():sys.exit(-1)# Setup the real time clockrtc = get_ntp()# Setup the plant monitoring object instance from the plant_monitoring classplants = PlantMonitor(rtc)filename = plants.get_filename()# Setup the HTML serversock = socket.socket(socket.AF_INET, socket.SOCK_STREAM)sock.bind(('', 80))sock.listen(5)print("Ready for connections...")server_on = Truewhile server_on:client, address = sock.accept()print("Got a connection from a client at: %s" % str(address))request = client.recv(1024)# Allow for clearing of the log, but be careful! The auto refresh# will resend this command if you do not clear it from your URL# line.if (request[:14] == b'GET /CLEAR_LOG'):print('Requesting clear log.')plants.clear_log()send_sensor_data(client, filename)client.close()sock.close()
Take a moment to read through this code. Notice how we implement the function in a more modular way. Not only does placing common code in functions help with how you break a problem down into parts, it also makes your main code (the run() function) shorter.
Let’s look at the completed code.
Complete Code
Now that we have seen all the parts of the code module, let’s look at the completed code. Listing 10-10 shows the complete code for the Plant Monitor code module. Once again, we can save this file as plant_wipy.py or plant_pyboard.py for the Pyboard).
Listing 10-10. Plant Monitor Main Code (WiPy)
# MicroPython for the IOT - Chapter 10## Project 3: MicroPython Plant Monitoring## Required Components:# - WiPy# - (N) Soil moisture sensors (one for each plant)## Note: this only runs on the WiPy.## Imports for the projectfrom machine import RTCimport sysimport usocket as socketimport utimeimport machinefrom network import WLANfrom plant_monitor import PlantMonitor# HTML web page for the projectHTML_TABLE_ROW = "<tr><td>{0}</td><td>{1}</td><td>{2}</td><td>{3}</td><td>{4}</td></tr>"# Setup the board to connect to our network.def connect():wlan = WLAN(mode=WLAN.STA)nets = wlan.scan()for net in nets:if net.ssid == 'YOUR_SSID':print('Network found!')wlan.connect(net.ssid, auth=(net.sec, 'YOUR_PASSWORD'), timeout=5000)while not wlan.isconnected():machine.idle() # save power while waitingprint('WLAN connection succeeded!')print("My IP address is: {0}".format(wlan.ifconfig()[0]))return Truereturn False# Setup the real time clock with the NTP servicedef get_ntp():rtc = RTC()print("Time before sync:", rtc.now())rtc.ntp_sync("pool.ntp.org")while not rtc.synced():utime.sleep(3)print("Waiting for NTP server...")print("Time after sync:", rtc.now())return rtc# Read HTML from file and send to client a row at a time.def send_html_file(filename, client):html = open(filename, 'r')for row in html:client.send(row)html.close()# Send the sensor data to the client.def send_sensor_data(client, filename):send_html_file("part1.html", client)log_file = open(filename, 'r')for row in log_file:cols = row.strip(" ").split(",") # split row by commas# build the table string if all parts are thereif len(cols) >= 5:html = HTML_TABLE_ROW.format(cols[0], cols[1], cols[2],cols[3], cols[4])# send the row to the clientclient.send(html)log_file.close()send_html_file("part2.html", client)# Setup the socket and respond to HTML requestsdef run():# Connect to the networkif not connect():sys.exit(-1)# Setup the real time clockrtc = get_ntp()# Setup the plant monitoring object instance from the plant_monitoring classplants = PlantMonitor(rtc)filename = plants.get_filename()# Setup the HTML serversock = socket.socket(socket.AF_INET, socket.SOCK_STREAM)sock.bind(('', 80))sock.listen(5)print("Ready for connections...")server_on = Truewhile server_on:client, address = sock.accept()print("Got a connection from a client at: %s" % str(address))request = client.recv(1024)# Allow for clearing of the log, but be careful! The auto refresh# will resend this command if you do not clear it from your URL# line.if (request[:14] == b'GET /CLEAR_LOG'):print('Requesting clear log.')plants.clear_log()send_sensor_data(client, filename)client.close()sock.close()
Changes for the Pyboard
Like the code module previously, the changes needed to run the code on the Pyboard are numerous. The main reasons for this include the usual changes but also the code is quite different because we must use a polling method since there is no (easy) way to set up a timer interrupt like we did on the WiPy.
Since the changes are numerous, a difference file is nearly the same length as the actual code.3 Thus, we will see the complete code for the Pyboard. Listing 10-11 shows the complete code for the code module with the differences needed to adapt the code module to the Pyboard (in bold). While most changes are minimal, if you are using the Pyboard or a Pyboard clone, take note of the pins used for the sensor.
There are two major changes needed in the run() function. First, there is not NTP support in the Pyboard firmware so we must use an RTC module or initialize the onboard RTC each time we start the project. Second, since there is no way to set up a timer interrupt that permits access to files, we must change the HTML server to use a non-blocking socket technique. These changes are highlighted in bold.
Listing 10-11. Plant Monitor Main Code (Pyboard)
# MicroPython for the IOT - Chapter 10## Project 3: MicroPython Plant Monitoring## Required Components:# - Pyboard# - (N) Soil moisture sensors (one for each plant)## Note: this only runs on the Pyboard.## Imports for the projectfrom pyb import delay, SPIfrom pyb import I2Cimport networkimport urtcimport usocket as socketfrom plant_monitor import PlantMonitor# Setup the I2C interface for the rtci2c = I2C(1, I2C.MASTER)i2c.init(I2C.MASTER, baudrate=500000)# HTML web page for the projectHTML_TABLE_ROW = "<tr><td>{0}</td><td>{1}</td><td>{2}</td><td>{3}</td><td>{4}</td></tr>"# Setup the board to connect to our network.def connect():nic = network.CC3K(SPI(2), Pin.board.Y5, Pin.board.Y4, Pin.board.Y3)# Replace the following with yout SSID and passwordprint("Connecting...")nic.connect("YOUR_SSID", "YOUR_PASSWORD")while not nic.isconnected():delay(50)print("Connected!")print("My IP address is: {0}".format(nic.ifconfig()[0]))return True# Read HTML from file and send to client a row at a time.def send_html_file(filename, client):html = open(filename, 'r')for row in html:client.send(row)html.close()# Send the sensor data to the client.def send_sensor_data(client, filename):send_html_file("part1.html", client)log_file = open(filename, 'r')for row in log_file:cols = row.strip(" ").split(",") # split row by commas# build the table string if all parts are thereif len(cols) >= 5:html = HTML_TABLE_ROW.format(cols[0], cols[1], cols[2],cols[3], cols[4])# send the row to the clientclient.send(html)delay(50)log_file.close()send_html_file("part2.html", client)# Setup the socket and respond to HTML requestsdef run():# Connect to the networkif not connect():sys.exit(-1)# Setup the real time clockrtc = urtc.DS1307(i2c)## NOTE: We only need to set the datetime once. Uncomment these# lines only on the first run of a new RTC module or# whenever you change the battery.# (year, month, day, weekday, hour, minute, second, millisecond)#start_datetime = (2017,07,20,4,9,0,0,0)#rtc.datetime(start_datetime)# Setup the plant monitoring object instance from the plant_monitoring classplants = PlantMonitor(rtc)filename = plants.get_filename()# Setup the HTML serversock = socket.socket(socket.AF_INET, socket.SOCK_STREAM)sock.bind(('', 80))sock.setblocking(False) # We must use polling for Pyboard.sock.listen(5)print("Ready for connections...")server_on = Truewhile server_on:try:client, address = sock.accept()except OSError as err:# Do check for reading sensors hereplants.read_sensors()delay(50)continueprint("Got a connection from a client at: %s" % str(address))request = client.recv(1024)# Allow for clearing of the log, but be careful! The auto refresh# will resend this command if you do not clear it from your URL# line.if (request[:14] == b'GET /CLEAR_LOG'):print('Requesting clear log.')plants.clear_log()send_sensor_data(client, filename)client.close()sock.close()
Notice the try block in the run() function. The sock.accept() function will throw an exception when there is no client connected. This is different than how a blocking call works. A blocking call will simply wait until a client connects. Here, we must attempt to accept a connection and if it fails, continue waiting for a connection. That is, we cannot send the HTML to the client as there is not client!
These changes highlight the added difficulty in using the Pyboard and other MicroPython boards without networking support, those that require RTC modules, and those with limited support for timer alarm interrupts to permit quasi-asynchronous execution (it’s not really asynchronous). In other words, we can disconnect some of our code to be called (triggered) by interrupts.
Now, let’s run this project!
Execute!
Now is the fun part! We’ve got the code all set up to read soil moisture from our plants and send all the sensor data collected to the client. Recall, we need to copy the code to our board. We can ftp the two code files (plant_monitor.py and plant_wipy.py) as well as the two HTML files (part1.html and part2.html). Do that now and you are ready to test the project.
All we need now is the IP address of that board to point our web browser. We can get that from our debug statements by running the code. Listing 10-12 shows the initial run for the project on a WiPy (results for the Pyboard are similar).
Listing 10-12. Running the Plant Monitor (WiPy)
MicroPython v1.8.6-694-g25826866 on 2017-06-29; WiPy with ESP32Type "help()" for more information.>>> import plant_wipy as p>>> p.run()Network found!WLAN connection succeeded!My IP address is: 192.168.42.128Time before sync: (1970, 1, 1, 0, 1, 44, 382593, None)Waiting for NTP server...Time after sync: (2017, 8, 9, 14, 26, 1, 92051, None)INFO: Using SD card for data.Data filename = /sd/plant_data.csvPlant Monitor class is ready...Ready for connections...Got a connection from a client at: ('192.168.42.110', 50395)
Notice in this case the IP address is 192.168.42.128. All we need to do is put that in our browser and shown in Figure 10-5.
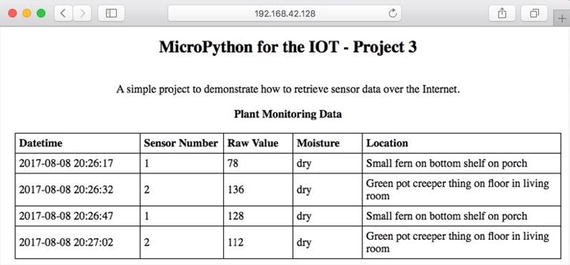
Figure 10-5. Plant Monitor Project
Once you enter the URL, you should see a web page like the image shown. If you don’t, be sure to check the HTML in your code to ensure it is exactly like what is shown; otherwise, the page may not display properly. You should also ensure the network your PC is connected to can reach the network to which your board is connected. If your home office is set up like mine, there may be several WiFi networks you can use. It is best if your board and your PC are on the same network (and same subnet).
At this point, you’ve completed another real MicroPython IOT project. In this case, we saw an IOT project that collects and displays data. Cool!
Taking it Further
This project, like the last one, shows excellent prospects for reusing the techniques in other projects. This is especially true for the HTML server aspect. If you liked seeing your sensor data over the Internet, you should consider taking time to explore some embellishments. Here are a few you may want to consider. Some are easy and some may be a challenge or require more research.
Add more sensors to expand your project to more plants.
Add a temperature sensor to record ambient temperature and display it on the web page.
Rewrite the HTML code to produce JSON strings.
Rewrite the HTML code to produce XML.
Explore the HTML code to change the web page to your liking. Consider using cascading style sheets to change the background of the button when pressed.
Connect your board to the Internet and call a friend to connect to your board and try it out.
Add LEDs to your board to illuminate when the plants need watering.
Of course, if you want to press on to the next project, you’re welcome to do so but take some time to explore these potential embellishments – it will be good practice.
Summary
IOT solutions can take many forms. One of the more common forms is those that generate data that we can view over the Internet (sometimes called data collectors). The implementation of data collectors can vary greatly, but they generally store the data in some location and provide a way to view the data. The simplest forms are those that log the data (sometimes called data loggers) locally, one a remote server, in a database, or in a cloud service. The visualization of the data can also vary with the most basic providing the data via a web page.
In this chapter, we saw a MicroPython IOT project that logs data read from a series of soil moisture sensors. We created a plant monitoring solution that saved the data to the local SD card. The project also served the data via a HTML server so that we can see the data at any time. This project can be used as a template for a host of data collection projects. You can simply follow the pattern established in this chapter and build your own HTML-based data logger.
In the next chapter, we will close out our tour of MicroPython IOT projects by making our MicroPython board send data to a cloud-based4 storage and visualization service. Cool!
Footnotes
1 Be sure to choose a plant hearty enough to withstand overwatering.
2 This happens quite often. When it does, it is better to view the actual code as the difference file may be harder to read.
3 This happens quite often. When it does, it is better to view the actual code as the difference file may be harder to read.
4 Sadly, some would argue it isn’t IOT unless it involves cloud services of one form or another.