
7 Droplet-Based Digital Microfluidics for Single-Cell Genetic Analysis
CONTENTS
7.2 High-Throughput, Programmable Microfluidic Droplet Generation
7.2.1.1 MEGA Fabrication and Assembly
7.2.2.1 MEGA Design and Performance
7.2.2.2 Programmable Active Droplet Generation
7.3 Single-Cell Quantification and Genotyping of Bacterial Pathogens
7.3.1.2 Bead and PCR Preparation
7.3.1.4 Bead Recovery and Flow Cytometry Quantitation
7.3.2.1 Digital Single-Cell Pathogen Detection at the Statistically Dilute Regime
7.3.2.2 High-Throughput and Sensitive SCGA
7.3.2.3 Limit of Detection and Dynamic Range
7.4 Single-Cell Multiplex Gene Detection and Sequencing of Mammalian Cells
7.4.2.1 Cell Culture and Preparation
7.4.2.2 Agarose Droplet Generation
7.4.2.3 Single-Genome Purification
7.4.2.6 Single-Cell Sequencing
7.4.3.1 Single-Cell Encapsulation and Genome Purification
7.4.3.2 Multiplexed Single-Cell Droplet PCR
7.1 Introduction
Cellular heterogeneity and individuality are well documented and play essential roles in biological functions and in the development of disease.1,2 For instance, recent results have revealed marked cellular heterogeneity in gene and protein expression,1,3,4 and 5 genetic/genomic alterations,2,6,7 and responsiveness to environmental and chemotherapeutic stimuli.8,9 Circulating tumor cells (CTCs) are found at an estimated frequency of 1 per 106–107 nucleated blood cells, making their isolation, quantitative counting, and molecular characterization extremely difficult.10 Traditional biological analyses probe large ensembles on the order of 103–106 cells, thereby revealing only the average genotypic and phenotypic characterization of the population. These average measurements from large population of cells cannot properly characterize the cellular heterogeneity of a population, detect the co-occurrence of various somatic mutations within single cells, or identify rare events (e.g., rare mutations and CTCs); these factors are important to elucidating the pathology, enabling early detection, and improving the treatment of diseases.11 In particular, since initial mutagenesis occurs inherently at the single-cell level, investigation of carcinogenesis can be remarkably facilitated by molecular techniques with single-cell sensitivity and resolution. Identifying driver mutations that lead to carcinogenesis in a rare subset of cells is one key approach to the risk assessment, early detection, and treatment of cancer.12,13 These somatic mutations can provide tumor-specific biomarkers and therapeutic targets for early detection, prognosis, and treatment of cancer. Clinical use of these genetic biomarkers relies on sensitive and quantitative measurement of these rare mutations in a vast excess of wild-type alleles.
Microfluidics has evolved from a scale-dependent technology that improves chemical analysis through miniaturization toward a versatile platform that enables the development of powerful new techniques to address challenges in many areas such as genetics, cell biology, and global health care.14 Microfluidic technology offers the fundamentally new capabilities of manipulating fluids, molecules, and cells in space and time, thus opening new opportunities for developing high-throughput single-cell analysis technology.15 Droplet-based digital microfluidics is an emerging paradigm in the field that takes advantages of microscale multi-phase flow dynamics to create and manipulate uniform emulsion droplets of femtoliter to nanoliter volume for massively parallel and ultrasensitive assays.16,17 and 18 For instance, emulsion polymerase chain reaction (ePCR) provides a powerful tool for high-throughput single-molecule amplification and counting of genetic targets.19,20 However, traditional ePCR has inherent limitations due to the use of mechanical agitation for emulsion generation, which produces high shear forces and polydisperse droplet sizes. Droplet microfluidics overcomes these limitations due to its unique ability to generate monodisperse droplets with precise control over droplet size, which ensures equal population sampling and amplification efficiencies across all reaction compartments to enable accurate digital quantification of an absolute number of targets.16,21,22,23,24 and 25 In addition, microfluidic encapsulation significantly mitigates the mechanical agitation and stress that can damage cells as it is normally performed with a shear stress lower than 10 dynes/cm2.29 Finally, microfluidic integration allows programmable in situ manipulation of droplets, such as droplet steering, trapping,26 and fusion,27 leading to a broader spectrum of applications, including real-time PCR,21 protein expression studies,25 and drug screening.28
We have developed a high-performance single-cell/copy genetic analysis (SCGA) technology that is based on high-throughput microfluidic emulsion generation and multiplexed droplet PCR assays.29 This platform technology has now been shown to be useful in a variety of different applications. Here we will first describe the programmable active microfluidic droplet generation approach and devices that we have developed.30 We will then discuss their applications to single-cell genetic analysis of pathogens31 and mammalian cells.32
7.2 High-Throughput, Programmable Microfluidic Droplet Generation
Droplet microfluidics has been typically a passive process, consisting of droplet generation by flow focusing and cross-flow shearing,33 and downstream manipulation based on hydrodynamic interactions of droplets.34 Elucidation of complex and dynamic biological processes poses an urgent need for the ability to perform more complicated active operations, including reagent dosing, mixing, splitting, extraction, detection, and sorting, each of which requires precise and automated control in space and time. Precise and controllable droplet generation has been recognized as an important component in developing droplet-based platforms to interrogate complex biological systems. A variety of methods, such as piezoelectric actuators35 and electrowetting,36 have been investigated to achieve controllable and eventually programmable microfluidic droplet generation. Pneumatic valves fabricated by soft lithography are a particularly promising tool for controlled droplet formation, owing to the inherent compatibility of pneumatic valves with large-scale microfluidic integration and automation.37 Current valve-based methods rely on external pumps to continuously flow the dispersed phase while actuating the integrated valves to modulate passive droplet formation in microchannels.38 In contrast, we have developed an active microfluidic droplet generator (μDG) that uses an integrated valve-based diaphragm pump to control both fluidic transport and flow modulation of the dispersed phase.23 Here, we will describe the microfluidic engineering approach to scale up our μDG to large-scale microfluidic emulsion generator array (MEGA) systems for high-throughput SCGA, as well as the systematic study of the on-demand droplet formation process driven by on-chip pumping.
7.2.1 Experimental
7.2.1.1 MEGA Fabrication and Assembly
MEGA chips shown schematically in Figure 7.1 were constructed from three 100 mm diameter glass wafers and a thin poly(dimethylsiloxane) (PDMS) membrane following a process described by Zeng et al.31 Briefly, the valve structure was first lithographically fabricated on the top side of a Borofloat glass wafer. Using backside alignment lithography, the droplet generators were fabricated on the bottom of the same wafer in register with the pump structure. Fluidic and interlayer via holes were drilled and the wafer was thermally bonded to a clean glass substrate at 650°C for 6 h. Pneumatic control manifolds were microfabricated on another glass wafer. Prior to device assembly, the microchannels were coated with 0.1% octadecyltrichlorosilane in dry toluene for 10 min. A 250 μm thick PDMS membrane was sandwiched between a microchip and a pneumatic manifold piece immediately after 2 min UV-ozone activation of the interacting surfaces. A custom Plexiglas manifold was assembled with the MEGA stack to allow oil infusion and droplet collection.
7.2.1.2 Droplet Generation

FIGURE 7.1 Microfluidic emulsion generator array (MEGA) devices. (a) Exploded view of a glass/PDMS/glass hybrid four-channel MEGA device with a pneumatically controlled three-valve micropump integrated to drive four nozzles for droplet generation. (b) Design of an eight-channel MEGA device that contains eight T-shaped droplet generators to increase device density. (c) Exploded view of the complete 96-channel MEGA device containing 96 parallel T-shaped droplet generators driven by a single coaxial three-ring valve pump.
The carrier oil contains 39.8% (w/w) Dow Corning 5225C Formulation Aid, 30% (w/w) Dow Corning 749 Fluid, 30% (w/w) AR20 Silicone Oil, and 0.2% (w/w) Triton X-100 surfactant. A syringe pump was used to continuously inject carrier oil into the device at various flow rates. The on-chip three-valve diaphragm pump was pneumatically actuated by a homemade solenoid valve system to pump the aqueous solution through the channels. A Welch dry vacuum pump was used to supply constant vacuum (−80 kPa) for valve actuation while the pressure was varied as specified in the text. Pumping was conducted in either four- or three-step fashion under the control of a program written in LabVIEW.
7.2.2 Results and Discussion
7.2.2.1 MEGA Design and Performance
To enable detection of extremely low frequency events in a vast population, we have developed a series of MEGA systems with 4, 8, 32, and 96 parallel units (Figure 7.1). These multilayer devices consist of a bonded glass–glass microfluidic chip, a PDMS membrane, and a microfabricated manifold wafer. The main fluidic chip contains a pattern of valve seats microfabricated on the top surface, which is connected through a “via” hole to the enclosed microfluidic networks. The assembly is then completed by contact bonding a manifold wafer onto the fluidic chip with a PDMS membrane to form the micropump structure. The microfluidic networks consist of the symmetrically bifurcated channels for introduction of aqueous and oil phases, which form parallel droplet nozzles. Four- and eight-channel MEGAs are based on the single-pump design, but with different droplet generator nozzles: a cross-shaped nozzle in the four-channel MEGA and a T-shaped nozzle in eight-channel devices (Figure 7.1a and b). The four-channel array defines a basic unit that is used to build up multiplexed MEGAs, such as the 32-channel MEGA with eight such arrays integrated onto a 4″ wafer. Further multiplexing of the MEGA on a 4″ wafer is restricted by the number of individual pumps that can be symmetrically arranged in a circle. To achieve a higher density, we designed a new ring micropump composed of three pairs of coaxial ring-shaped valve seats connected by offset channels, as well as corresponding circular displacement trenches (Figure 7.1c). This compact micropump, along with the T-shaped nozzle design, enables the implementation of a 96-channel MEGA on a 4″ wafer. In the 96-channel MEGA, oil channels are connected to the oil inlet holes drilled on the bottom substrate of the device.
For droplet generation, a homemade manifold module is used to infuse oil phase and route generated droplets into PCR tubes, as sketched in Figure 7.2a. The bottom part of the manifold is designed to form a circular oil reservoir when sealed against the MEGA chip. This design yields uniform oil introduction across the whole channel network while minimizing the number of syringe pumps and tubing connections required. The compact ring-shaped micropump in the 96-channel MEGA confers sufficient power to drive multiple droplet generators in parallel. At the same time, the symmetrically designed microfluidic network ensures even fluidic transport, which is crucial for uniform droplet encapsulation. The symmetrical design of the MEGA assures uniform generation of monodisperse droplets in all channels. The microphotograph in Figure 7.2b demonstrates the generation of uniform droplets from a mock PCR mix containing agarose beads by flow shearing at the T-shaped injectors. The mean diameter of the droplets was determined to be 162 μm (2.2 nL) with a deviation of only 3.8% (Figure 7.2c). Such size uniformity is preserved across a range of droplet volumes (1–5 nL; RSD < 5%).

FIGURE 7.2 Characterization of droplet generation and PCR amplification using the 96-channel MEGA. (a) Exploded view of the complete four-layer MEGA device and the Plexiglass assembly module used to infuse oil and to collect the generated emulsion. (b) Image of droplet production at the T-shaped nozzles with a total throughput of 2.4 × 10⁶ droplets per hour. (c) Size distribution of uniform ~2 nL droplets collected from 16 nozzles in a device. (d) A representative flow cytometric histogram of beads carrying the FAM-labeled PCR product from E. coli K12 at 0.2 cpd in 2.5 nL droplets. For droplet generation, the mock PCR mix containing ~100 beads per μL was used. (Modified with permission from Zeng, Y., Novak, R., Shuga, J., Smith, M.T., and Mathies, R.A., Anal. Chem., 82, 3183–3190, Copyright 2010. American Chemical Society.)
To assess the encapsulation performance of the 96-channel MEGA, single-cell emulsion PCR was performed targeting the KI#128 island on the K12 genome. Bacterial Escherichia coli K12 cells and forward primer modified beads were introduced at a statistical dilution of 0.2 cells and 0.1 beads per 2.5 nL droplet, respectively. After PCR and isolation, flow cytometric analysis (Figure 7.2d) shows that 15% of the total bead population (4423 beads) is strongly fluorescent, corresponding well to a theoretical value of 18% predicted by the Poisson distribution. This good agreement indicates successful single-copy genetic amplification resulted from uniformly distributed cells and beads. A 96-channel MEGA can produce up to 3.4 × 10⁶ droplets per hour (dph), which enables rapid detection of extremely low frequency events in a vast population.
7.2.2.2 Programmable Active Droplet Generation
We have systematically investigated the effects of pulsatile on-chip pumping and flow conditions on droplet formation using the eight-channel MEGA. A three-step actuation sequence was used here to increase the droplet formation rate. We first studied the effects of the oil flow rate, a critical factor in microfluidic droplet generation. Figure 7.3a plots the droplet formation frequency (fdroplet) and droplet size (Rdroplet) as a function of the oil flow rate (Qoil) under an actuation sequence of 40, 50, 40 ms and a pressure of 35 kPa. At the low oil flow rate in regime (a), large uniform droplets were periodically formed, as seen in Figure 7.3b. Interestingly, fdroplet is lower than the pumping frequency (fpump) of 7.69 Hz and increases along with Qoil while Rdroplet decreases. Microscopic visualization also observed a droplet break-up process, which resembles that of passive cross-flow droplet formation.39 These results indicate that the droplet break-up within regime (a) is predominantly governed by the interaction of viscous shear stresses and interfacial tension between the two immiscible phases and that the force generated by mechanical pump actuation plays a minor role.40 As Qoil was further increased, a narrow transition regime (b) occurred in which droplet generation lacks both periodicity and size uniformity, as seen in Figure 7.3b. A sharp change of droplet generation behavior was observed when fdroplet was tuned to a threshold value of 1.3 μL/min (Figure 7.3a). Within this regime of a wide range of Qoil, the use of active on-chip pumping enables stable generation of uniform droplets, as exemplified in Figure 7.3b. Several unique phenomena were observed in this regime. First, the droplet generation synchronizes with the pumping frequency, which can be attributed to the pulsatile nature of on-chip pumping that modulates the process of droplet formation. Second, fdroplet is independent of Qoil, which indicates the dominance of the forces caused by pumping over the viscous shear stresses that depend on the flow parameters. Third, the droplet size can be independently tuned by varying Qoil while droplet formation remains synchronized with the pumping. Increasing Qoil leads to higher back pressure that suppresses the pneumatic actuation of the valves and thus reduces the flow rate of the aqueous phase being pumped into the channels.41 Eventually, the droplet generators will stop working when the back pressure is larger than the pressure that the pump is able to generate (Figure 7.3a). These observations clearly demonstrate that on-chip pumping confers the ability to independently control frequency by adjusting pumping rate and droplet size by varying Qoil. This unique property is in contrast to the passive droplet generation methods in which droplet generation frequency and droplet size are linked and sensitive to the flow conditions.33 Figure 7.3 shows that a range of Qoil needs to be experimentally defined to ensure precisely controlled droplet generation with excellent size uniformity. As expected, the Qoil range and the droplet sizes were found to be also affected by the pumping conditions, such as fpump and the pressure for pneumatic actuation.
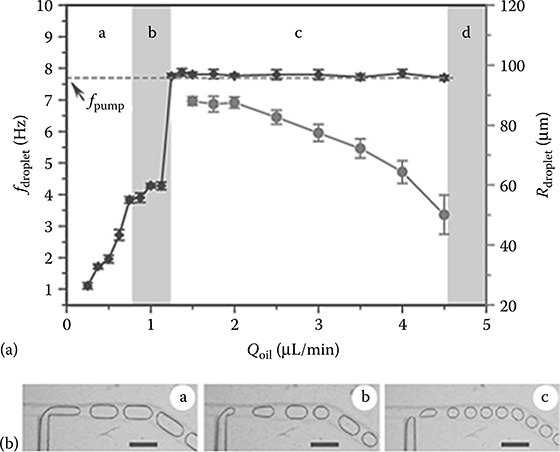
FIGURE 7.3 (a) Plot of droplet formation frequency (fdroplet) and droplet radius (Rdroplet) as a function of the oil flow rate in each T-junction (Qoil) under an actuation sequence of 40, 50, 40 ms and a pressure of 35 kPa. The dashed line indicates the pumping frequency (fpump) of 7.69 Hz. (b) Images of different droplet formation behavior observed in the regimes identified in (a). The scale bars are 600 μm. (From Zeng, Y., Shin, M., and Wang, T., Lab Chip, 13, 267–273, 2013. Reproduced by permission of Royal Society of Chemistry.)
Figure 7.4a shows that the threshold Qoil at which droplet generation and pumping start to synchronize shows a roughly linear function of fpump, especially for the high frequencies. At a fixed pressure (same as in Figure 7.3a) within the range that we commonly used, increasing pumping rate requires a higher oil flow rate to establish stable operation. Since the droplet size is also affected by Qoil (Figure 7.3a), one should work at oil flow rates away from the boundary conditions such that the adjustment of droplet generation frequency by varying fpump will require no changes of oil flow and thus have no effects on droplet sizes. In addition to oil flow rate, droplet sizes can be tuned by adjusting the actuation pressure. Droplet volume exhibits a peaking response to increasing actuation pressure under the conditions of pumping and oil flow that we commonly used for fast droplet generation. An example is shown in Figure 7.4b with a pumping sequence of 45, 45, 45 ms and Qoil at 3 μL/min. The experimental observations in Figures 7.3 and 7.4 provide guidance for exploring proper conditions for independent and precise control of the droplet frequency and sizes.

FIGURE 7.4 Effects of the pumping conditions on active droplet generation. (a) Plot of the threshold Qoil as a function of pumping frequency (fpump) obtained under an actuation pressure of 35 kPa. The duration for each actuation step was kept the same. (b) Plot of droplet volume as a function of actuation pressure. Qoil was 3 μL/min and the pumping sequence was 45, 45, 45 ms. (From Zeng, Y., Shin, M., and Wang, T., Lab Chip, 13, 267–273, 2013. Reproduced by permission of Royal Society of Chemistry.)
It is important to note that these droplet generation behaviors are distinct from those of mechanical actuation-based methods that use PDMS or piezoelectric valves.40,42 In a PDMS valve-based method, the dispersed phase is constantly driven by external pumps and a valve placed close to the droplet generation junction is periodically actuated to alter the instantaneous flow rate of the dispersed phase.41 It was found that forced droplet generation synchronizes with natural droplet generation only if the actuation frequency is a multiple of the natural frequency, otherwise irregular droplet formation will occur. In our method, synchronized droplet formation can be obtained at any pumping frequency as long as the oil flow rate falls in regime (c) in Figures 7.3 and 7.4. Therefore, our studies suggest a different physical mechanism that should arise from the combination of pulsatile transport and modulation of the dispersed phase, in contrast to the valve-based devices that only modulate the flow being continuously injected. More experimental and theoretical studies are needed to fully elucidate the fluid dynamics of droplet formation driven by pulsing pumping.

FIGURE 7.5 Programmable droplet generation. (a) Plot of droplet radius as a function of the pumping period. (b) The top photo shows a stream of two differently sized droplets formed by continuously alternating two pumping cycles of 150 and 105 ms. The bottom photo shows on-demand generation of more complex patterns. In this case, each repeating sequence consists of seven steps: (1,2) two consecutive pumping cycles of 130 and 165 ms, (3) 100 ms interval, (4) 110 ms pumping, (5) 300 ms interval, (6) 150 ms pumping, and (7) 500 ms interval. The actuation pressure was 45 kPa and Qoil was 3.5 μL/min. (From Zeng, Y., Shin, M., and Wang, T., Lab Chip, 13, 267–273, 2013. Reproduced by permission of Royal Society of Chemistry.)
Because the on-chip diaphragm pump directly delivers the dispersed phase in our device, the pumping frequency or period is expected to be an important factor in determining the flow rate of the dispersed phase and thus the droplet size. As seen in Figure 7.5a, the droplet size increases and then levels off as the pumping period is extended, consistent with the reported behavior of three-valve micropumps.41 Adjusting the pumping period provides a means to control droplet generation that is more compatible with computer programming. The top photo in Figure 7.5b shows a stream of two differently sized droplets that was formed by continuously alternating two pumping cycles of 150 and 105 ms. In addition, the droplets can be formed on demand to yield more complex patterns, as demonstrated in the bottom photo of Figure 7.5b. In this case, each repeating sequence consists of seven steps: two consecutive pumping cycles of 130 and 165 ms, 100 ms interval, 110 ms pumping, 300 ms interval, 150 ms pumping, and 500 ms interval. Clearly, the on-chip pumping method allows precise control of droplet generation frequency, size, and timing, which demonstrates its on-demand capability and programmability.
7.3 Single-Cell Quantification and Genotyping of Bacterial Pathogens
The integration of multiplex PCR with high-throughput droplet generation is valuable for the analysis of genomic deletion, forensic genotyping, mutation and polymorphism analysis, and the identification of pathogens. We will demonstrate high-throughput single-cell analysis of a major food-borne bacterial pathogen, E. coli O157:H7, which alone causes an estimated 73,000 infections and 61 deaths annually in the United States.43,44 Sensitive pathogen detection is critical for many applications, such as food safety, where microbial pathogen detection needs to meet a zero tolerance policy for many foods.45 To this end, we have developed a multiplex single-cell genetic analysis (SCGA) approach, as illustrated in Figure 7.6, which allows efficient high-throughput PCR amplification of multiple target genes specific to different cell types. In this process, primer-linked beads and cells are diluted in the PCR mix such that isolated individual beads or cells are encapsulated into individual uniform reaction droplets dispersed in the carrier oil. Statistically, a small fraction of droplets will contain both one bead and one or more cells. Beads are functionalized with forward primers for all targets, and the PCR mix contains reverse primers each labeled with a unique fluorescent dye. Each bead in a droplet containing only a single cell will carry one type of dye-labeled double-stranded amplicons after PCR, while a bead compartmentalized with different types of target cells will be labeled with multiple dyes. Post-PCR beads are recovered from the emulsion and rapidly analyzed by flow cytometry for multicolor fluorescent digital counting of each single-cell detection event.
7.3.1 Experimental
7.3.1.1 Cell Culture
All cell culture and preparation was performed in a class II biosafety cabinet to avoid contamination. Two types of cells, E. coli K12 and nontoxigenic E. coli O157, were grown separately in tryptic soy broth medium overnight at 37°C. E. coli K12 cells were transformed with a 3.9 kb pCR 2.1-TOPO vector to confer ampicillin resistance and grown with 1 mg/mL ampicillin added to the medium. E. coli O157 was untreated and frequently tested for contamination by PCR. Cells were washed three times in 1× PBS and the final cell density was determined using a hemacytometer.
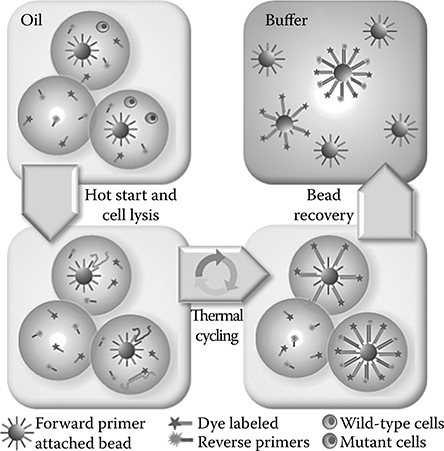
FIGURE 7.6 Multiplex single-cell genetic analysis (SCGA). Statistically dilute beads and templates are encapsulated into uniform nanoliter-volume PCR-mix-in-oil droplets, which are then thermally cycled for PCR amplification. Each bead is functionalized with forward primers for all targets. The PCR mix contains reverse primers, each labeled with a unique fluorescent dye. Each bead in a droplet containing only a single target will carry one type of fluorescent amplicon after PCR, while a bead compartmentalized with two different templates or cells will be linked with multiple dye-labeled products. Following emulsion PCR, the droplets are broken and the beads are recovered and analyzed by flow cytometry. (Reprinted with permission from Zeng, Y., Novak, R., Shuga, J., Smith, M.T., and Mathies, R.A., Anal. Chem., 82, 3183–3190, Copyright 2010. American Chemical Society.)
7.3.1.2 Bead and PCR Preparation
Samples were handled in a UV-treated laminar flow hood. Primers specific to the KI#128 island on the K12 genome and the OI#43 island on the O157 genome were designed to prevent cross-amplification between strains. Reverse primers were labeled with 6-carboxyfluorescein (6-FAM) or Cy5 dye on the 5′ end. 5′ Amine-modified forward primers were linked to agarose beads (34 μm mean diameter) via amine-NHS conjugation chemistry. The coupling reaction was performed at a ratio of ~1.5 μmol oligos per gram beads for the pUC18 target. For E. coli cells, equimolar forward primers were used at a concentration of ~0.3 μmol oligo per gram beads. PCR mixes contained forward primer functionalized beads (40 beads/μL) and varied amounts of freshly prepared template DNA or cells.
7.3.1.3 PCR Reaction
The primer sequences specific for E. coli cells are listed in Table 7.1. For E. coli experiments with an average cell concentration of ≤1 cell per droplet, the PCR mix contains 1× AmpliTaq Gold buffer with 1.5 mM MgCl2, 0.2 mM dNTPs, 0.5 μg/μL heat-inactivated BSA, 0.01% Tween 80, 0.4 μM reverse and 0.04 μM forward primers for each cell target, 0.1 beads/2.5 nL droplet, 0.2 U/μL AmpliTaq Gold polymerase, and various amount of cells. At the average cell concentrations of 10 and 100 cells per droplet (cpd), the PCR mix was optimized to have 3 mM MgCl2, 2 μM reverse and 0.2 μM forward primers for E. coli K12, with other ingredients kept the same. To minimize DNA/polymerase adsorption on glass and PDMS surfaces, the MEGA device was primed with a coating solution consisting of 1× AmpliTaq Gold buffer with 1.5 mM MgCl2, 0.5 μg/μL heat-deactivated BSA, and 0.01% Tween 80. Droplets were thermocycled as follows: 10 min at 95°C; six cycles of 30 s at 94°C, 90 s at 65°C, and 60 s at 72°C; eight cycles of 30 s at 94°C, 90 s at 63°C, and 60 s at 72°C; 10 cycles of 30 s at 94°C, 90 s at 60°C, and 60 s at 72°C; 13 cycles of 30 s at 94°C, 90 s at 55°C, and 60 s at 72°C; and 7 min at 72°C.
7.3.1.4 Bead Recovery and Flow Cytometry Quantitation
The emulsion in the PCR tubes was vacuumed to pass a 15 μm mesh filter in a 13 mm diameter plastic filter holder. The droplets were broken and the beads were retained by the filter. After rinsing with isopropanol, 100% ethanol, and 1× Dulbecco’s PBS (DPBS), the beads were recovered using a 5 mL syringe and stored in 1× DPBS for flow cytometry analysis. The bead suspension in PBS was analyzed using a multicolor flow cytometer (FC-500, Beckman-Coulter). FAM-labeled DNA product on the bead surface was quantified against standard beads with different known amounts of fluorophores (Bangs Laboratories Inc., Fishers, IN). The flow cytometry data were analyzed using WinMDI.
7.3.2 Results
7.3.2.1 Digital Single-Cell Pathogen Detection at the Statistically Dilute Regime
Table 7.1 Primer Sequences for Gene Targets

We targeted unique genes on the K12 genome (KI#128 island) and the O157 genome (OI#43 island) using primers labeled with different fluorophores. A four-channel MEGA device was operated for ~18 min to obtain ~3000 beads for flow cytometric analysis. A mixed E. coli bacterial sample containing 50% O157 cells was first analyzed at an average cell concentration (Cavg) of 0.2 cpd. As seen in Figure 7.7a, the flow cytometry profile shows four distinct bead populations: 212 FAM-positive beads due to the amplicons from K12 (7.93%, green), 198 Cy5-positive beads for O157 (7.40%, red), 45 double-positive beads due to coexistence of both cell types in a single droplet (1.68%, orange), and 2220 negative beads (82.99%, blue). The O157 cell ratio (O157-positive beads/total positive beads) is then determined to be 0.48, in good accord with the input O157 cell fraction of 0.5.

FIGURE 7.7 High-throughput digital multiplex detection of E. coli O157 in a background of E. coli K12. (a) With Cavg = 0.2 cpd, flow cytometry shows four distinct populations: negative, FAM-positive beads specific for K12, Cy5-positive beads specific for O157, and double-positive beads for both cells. Small populations are expanded along the event axis for better visualization, as indicated. The gray regions mark the population gating. (b) When Cavg = 10 cpd while keeping O157 cells at 0.01 cpd, the measured O157 ratio was 0.92/103 (expected: 1/103). Up to 3000 beads can be analyzed using a four-channel device for ~25 min run time. (c) O157 detection using a 96-channel MEGA at Cavg = 100 cpd shows the measured O157 ratios of 0.85/104, consistent with the inputs of 1/104. Up to 104 events were processed within a 5 min run time. (d) Comparison of the percentage of positive beads over total beads vs. starting cell concentration. The curve represents the value expected from Poisson statistics. The experimental data were obtained by detecting E. coli O157 cells in a background of E. coli K12 with overall cell concentrations of 0.07–100 cpd. Error bars represent standard deviation (n ≥ 3). (Reprinted with permission from Zeng, Y., Novak, R., Shuga, J., Smith, M.T., and Mathies, R.A., Anal. Chem., 82, 3183–3190, Copyright 2010. American Chemical Society.)
7.3.2.2 High-Throughput and Sensitive SCGA
The detection of low frequency genetic variations requires high analysis throughput in order to obtain the statistically significant population for the target. The multiplex SCGA process discussed above uses droplets/beads inefficiently because cells are highly dilute so that most droplets are empty. One way to increase the process efficiency is to perform multiplex single-cell genetic analysis at elevated cell density while still keeping the cells of interest statistically dilute. This is realistic because the target pathogen or mutant cells are typically present at very low relative concentrations compared to normal cells. Figure 7.7b demonstrates the use of a four-channel MEGA device to detect E. coli O157 cells at a frequency of 1/103. By increasing Cavg from 0.2 to 10 cpd, the effective density of O157 cells is raised from 0.0002 to 0.01 cpd, reducing the number of droplets/beads that must be processed by 50-fold. In this case, all beads should be FAM fluorescent due to coencapsulated K12 cells; the presence of O157 cells in the droplets will modify only a fraction of beads with the Cy5 dye. As expected, the vast majority of beads (1846 out of 1961 events, 96.13%) are FAM positive and a small fraction of double-positive beads (102 events, 0.88%) are observed. The measured O157 ratio is determined to be 0.92/103 (the ratio of double-positive beads over all positive beads divided by Cavg), close to the 1/103 input. Multiplex SCGA preserves the quantitative performance for pathogen detection even when the average concentration is up to 100 E. coli cells per 2.5 nL droplet. To further improve the detection sensitivity, we assessed the 96-channel MEGA which allows us to encapsulate up to 104 cells within 5 min when operating the device at ~7 Hz per channel. As shown in Figure 7.7c, the experiments at an input ratio of 1/104 at 100 cpd detect 88 and 21 O157-positive events, giving an output fraction of 0.85/104.
To verify that the observed performance is the result of digital quantification of each strain, we compare the percentage of positive beads obtained with various input ratios and average cell concentrations with that predicted by the Poisson distribution (Figure 7.7d). The multiplex detection is seen to follow Poisson statistics even when individual O157 cells were detected within a high background of 100 cpd. The good correspondence indicates successful single-cell emulsion PCR, which allows digital quantification of the absolute cell concentration. For instance, with Cavg = 100 cpd and O157 cells diluted to 1/104 in a K12 background, the O157 cell density is 0.01 cpd and the detection resulted in 0.91% ± 0.04% double-positive beads, consistent with the predicted ratio of 0.995%. Because of the presence of negative events, the average percentage of O157-positive beads is corrected to be 0.93% ± 0.05% (double-positive beads divided by total positive beads), from which the O157 cell concentration is determined to be 3.7 ± 0.2 cells/μL (input 4 cells/μL).
7.3.2.3 Limit of Detection and Dynamic Range
To determine the limit of detection (LOD) of multiplex SCGA for E. coli O157 detection, the assay was carried out at lower pathogenic ratios and Cavg = 100 cpd using a 96-channel MEGA. Figure 7.8a presents a representative analysis at an input ratio of 1/106 where the experimental output ratio (1.4/105) is one order of magnitude higher than that expected. In this case, to define a statistically significant population at the extremely low cell density (0.0001 cpd for O157 cells), a large volume of PCR mix (1500 μL) was used to produce ~8 × 10⁵ droplets within 20 min, which leads to 45,419 total events analyzed and 65 Cy5-positive events detected. The experimental readout at the input of 1/106 (1.8/105 ± 0.66/105, n = 4) is significantly above the expected value (p = .01), indicating that there is significant background signal. It is seen in Figure 7.8a that the peak for K12 cells (FAM-positive only) tails off into the Cy5-positive region, suggesting that the background could be attributed to misamplification caused by the nonspecific binding of O157 primers to the K12 templates. Figure 7.8b is the result obtained with an input ratio of 1/105 that detects 33 Cy5-positive beads. At this pathogenic ratio, the experimental readouts (2.4/105 ± 0.91/105, n = 4) are in the same order as the expected value and significantly different from that obtained at 1/106 at p = .05 using the two-sample Student’s t-test. By subtracting the background, the corrected value at the input ratio of 1/105 is determined to be 0.69/105 ± 0.34/105 (n = 4). Figure 7.8c summarizes the background corrected calibration of E. coli O157 detection as a function of the input O157 fraction, which shows a linear dynamic range for O157 fraction higher than 1/105. From this plot, the concentration detection limit is determined to be 3/105 with a 99% confidence.
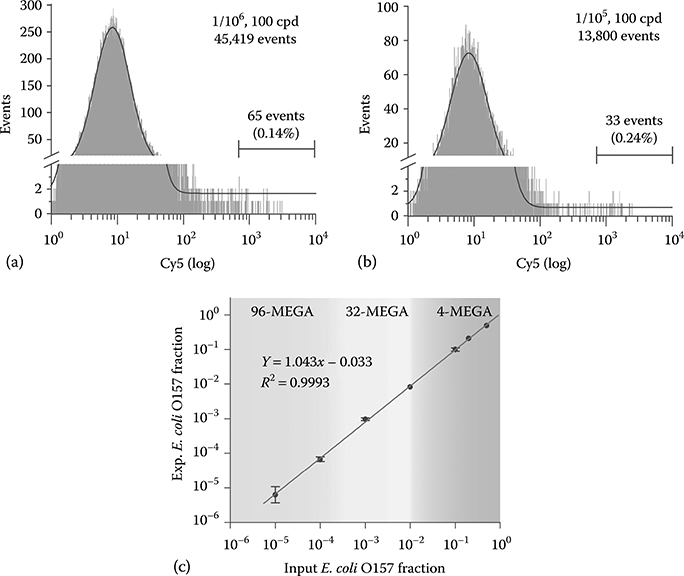
FIGURE 7.8 Detection limit and dynamic range of multiplex SCGA for E. coli O157 detection using a 96-channel MEGA. (a,b) Representative cytometric histograms (events vs. Cy5 signal) obtained with input O157 ratios of 1/106 and 1/105, respectively. The measured O157 ratios are: (a) 2.4/105 and (b) 1.4/105. The solid lines represent the Gaussian fittings for the Cy5-negative populations. (c) Plot of experimental readout vs. input O157 fraction showing a linear dynamic range for O157 fraction higher than 1/105. The gray regions roughly mark the detection windows that meet the throughput offered by different MEGA devices within an experimentally accessible run time. Error bars represent standard deviation (n ≥ 3). (Reprinted with permission from Zeng, Y., Novak, R., Shuga, J., Smith, M.T., and Mathies, R.A., Anal. Chem., 82, 3183–3190, Copyright 2010. American Chemical Society.)
7.3.3 Discussion
Multiplex single-cell PCR is the cornerstone of the high-throughput SCGA technique, which maximizes the genetic information extracted from each single-cell detection event. In this process, it is critical to compartmentalize single cells and beads into monodisperse nanoliter-volume droplets. Our results clearly demonstrate that the droplet uniformity provided by our active droplet generators enables strict Poisson statistical analysis to calibrate the performance of digital single-cell PCR, which is determined collectively by the statistical encapsulation of beads and cells, cell lysis, and PCR reaction. Such analysis permits digital quantification of the absolute number of targets in the initial sample. Other digital PCR techniques using agitation-based emulsification fundamentally lack this capability because of the extremely polydisperse droplets produced.46 In addition, the uniform droplets contain the same amount of reactants, enabling a quantitative comparison of the PCR products. Thus, one should be able to perform large-scale gene expression profiling at the single-cell level by transforming reverse transcription-PCR (RT-PCR) assays to the SCGA format.47 The multiplex SCGA displays great tolerance to PCR inhibition as the cell lysate and debris are significantly diluted in the large nanoliter droplets generated by MEGA, and each reaction is independent. Efficient and specific multiplex PCR amplification can be achieved even when each droplet is loaded with up to 100 E. coli cells on average, which greatly increases the analysis throughput and hence the detection sensitivity, without excessively extending the droplet production time. This result indicates the feasibility of SCGA for the large-scale genetic analysis of larger and more complex mammalian cells. For instance, the analysis of cancer development and progression, CTCs, and stem cell differentiation, where single-cell resolution may facilitate a deeper understanding of the biological mechanisms involved, can be envisioned.
Most PCR-based microdevices reported the detection of only one bacterial strain by PCR, with detection limits ranging from a few to 104 bacterial cells.48,49 and 50 Recent work in our group showed that PCR reactions in a 250 nL microreactor can detect E. coli O157:H7 in a mixture with the K12 strain down to a ratio of 1:500,51 and that the detection limit of the microscale PCR can be as low as 1:1000 by using on-chip affinity cell preconcentration.52 Our quantitative digital format remarkably outperforms previous low-throughput microsystems with its capability to identify and quantify both E. coli O157 and K12 cells down to a pathogen-to-background ratio in the order of 1:105 (Figure 7.8). Such sensitivity makes the technique a promising candidate to achieve the level of detection and speed required for a zero-pathogen-tolerance policy. Droplet generation using the 96-channel MEGA requires <30 min of run time to achieve a LOD of 1:105. The entire procedure, including PCR thermal cycling, post-PCR cleanup, and flow cytometry takes approximately 4 h and compares favorably with standard PCR-based detection assays while providing better sensitivity. In contrast, most methods commonly used today require at least 2 days to achieve this level of sensitivity since they rely on pathogen culturing.45 The SCGA technique can be further extended to detect multiple pathogenic microorganisms in one sample. Compared to the small beads used in the BEAMing technique, the large surface area of the microsphere used here allows multiple different primers to be conjugated with a density that supports efficient on-bead PCR reaction for each target. Thus, our detection multiplicity is limited primarily by the number of fluorescent dyes that a flow cytometer can detect (commonly five colors) since that is a relatively standard degree of PCR multiplicity.
We believe that the detection limit of our multiplex SCGA can be further improved to beyond one in a million. Some nonspecific amplification was observed when the 2.5 nL droplets were loaded with 100 E. coli cells. Although the multiplex PCR conditions have been optimized to minimize nonspecific amplification, it still can contribute to the false-positive scores that limit the low-abundance detection to the level of 1:105 in this proof-of-concept work. In practical applications, we can perform droplet generation for longer periods of time at lower cell concentrations to minimize the effect of nonspecific PCR amplification, and thus lower the detection limit. On the other hand, trace exogenous contamination from microorganisms and/ or DNA present in air, reagents, and instruments may cause considerable interference at these extremely low detection limits. We did see false-positive events occasionally in negative control experiments performed at a cell concentration of < 1 cpd. Sample preparation and experimental operation with more stringent environmental controls should prevent contaminations and enable us to lower the detection limit to 1:106 or better.
7.4 Single-Cell Multiplex Gene Detection and Sequencing of Mammalian Cells
Cytometric sorting, limiting dilution, and micromanipulation have been previously used to perform single-cell PCR assays in 96-well PCR plates, but these approaches are not ideal for large-scale screening applications.53 Microfluidic droplet technology is particularly advantageous for single-cell analysis because it facilitates rapid statistical compartmentalization of targets for massively parallel pico- to nanoliter-scale assays.29,54 To date most single-cell genomic analyses have been reported on bacterial samples.55,56 For mammalian cells, droplet-based genetic analyses have predominantly implemented reverse transcription PCR for phenotypic profiling.57 A difficulty in single-cell PCR is the persistent technical challenge of integrating a robust and scalable DNA release/extraction method.55,58 The relative lack of suitable single-cell genomic analysis technologies combined with the significant genetic heterogeneity associated with cancer, underscores the importance of developing new microdroplet methodologies that integrate robust single-cell genome preparation with multiplexed PCR.
To address the fundamental technical challenge of single-genome extraction, we have adapted our SCGA methodology and the emulsion generator array technology to facilitate a novel agarose droplet-based method. In this method, individual cells are confined in gelled agarose droplets for integration with a standard DNA extraction protocol consisting of detergent membrane solubilization and enzymatic protein digestion to release and protect genomic DNA within the droplet. We explored multilocus single-cell sequencing of the control gene β-actin and the chromosomal translocation t(14;18) to validate this technology. The BCL-2/IgH translocation t(14;18) is highly prevalent in many blood cancers, including ~80% of follicular lymphoma (FL) cases and ~25% of large-cell B-cell lymphoma cases.59 This trans-location brings the B-cell lymphoma-2 (BCL-2) gene from 18q21 under the control of the strong enhancers of the IgH locus, ultimately disrupting BCL-2’s normal pattern of expression in B cells.60 BCL-2 is an antiapoptotic protein and its overexpression can be intimately involved in the pathogenesis of B-cell neoplasms.61 t(14;18) is also found in healthy individuals at very low levels and may be an early biomarker for lymphoma.62,63 and 64 A high-throughput technique that can sequence and quantify t(14;18) could provide insight into the molecular pathology and clinical importance of t(14;18).
7.4.1 Methodology
The underlying concept of our highly parallel single-cell purification and genetic analysis method is the microfluidic encapsulation of cells in agarose droplets that serves two important roles: first, it enables cell lysis and genomic DNA purification with single-genome integrity; and second, it defines monodispersed water-in-oil droplet reactors for efficient multiplex emulsion PCR target amplification and subsequent genetic analysis. The workflow of the agarose droplet-based SCGA method for the genetic analysis and multilocus sequencing of single mammalian cells is illustrated in Figure 7.9. Briefly, cells and primer-functionalized beads suspended in a molten agarose solution are injected into a MEGA device that is kept at an elevated temperature. Single cells are microfluidically encapsulated together with primer-functionalized beads in uniform agarose droplets. When the droplets are cooled, the agarose droplet forms a rigid but porous gel bead to protect the individual cell and its genomic DNA while allowing fluidic access to enzymes and chemicals for cell lysis, washing, and PCR. The genomes of single cells are released and trapped in the gel beads upon SDS lysis and digestion with proteinase K according to a standard protocol (Figure 7.9b). For genetic analysis, the agarose droplets are equilibrated in PCR buffer containing fluorescent forward primers and then emulsified with oil by mechanical agitation to form monodispersed nanoliter emulsion reactors for massively parallel single-cell amplification (Figure 7.9c). Following multiplex PCR amplification, primer beads are recovered by breaking the emulsion and melting the agarose. The fluorescent amplicon-decorated beads are then rapidly quantified by flow cytometry or further subjected to PCR amplification for DNA sequencing of target genes (Figure 7.9d).

FIGURE 7.9 Workflow diagram demonstrating the agarose-based SCGA technology for genetic detection and multilocus sequencing of single mammalian cells. (a) A MEGA chip is used to statistically encapsulate single cells and primer-functionalized beads in uniform agarose droplets. (b) The genomes of single cells are released in the gelled droplets using a standard SDS lysis/proteinase K digestion protocol. (c) The agarose droplets are equilibrated in PCR buffer, mechanically emulsified in oil, and thermally cycled. (d) After PCR amplification, amplicon beads are released by breaking the emulsion and melting the agarose. The post-PCR beads will be quantified using flow cytometry or further PCR-amplified for DNA sequencing. (Reprinted with permission from Novak, R. et al., Angew. Chem. Int. Ed. Engl., 50, 390–395, Copyright 2011. Wiley-VCH Verlag GmbH & Co. KGaA.)
7.4.2 Experimental
Device fabrication, bead functionalization, and bead recovery and flow cytometry followed the same protocols as described before. The primer sequences specific for E. coli cells are listed in Table 7.2.
7.4.2.1 Cell Culture and Preparation
Cell lines of t(14;18)− TK6 (CRL 8015) and t(14;18)+ RL (CRL 2261) lymphoblasts were cultured in RPMI 1640 media supplemented with 10% FBS at 37°C in a 5% CO2 atmosphere. Cell preparation was performed in a class II biosafety cabinet. Final cell density was determined to be between 2 × 10⁵ and 2 × 10⁶ using a hemacytometer. Cells were washed with PBS, combined with primer-conjugated beads, and mixed with 2% low-melt agarose to a final concentration of 400 beads/μ and 80–120 cells/μ in 1.5% agarose at 40°C.
Table 7.2 Primer Sequences for Gene Targets

Source: Novak, R. et al., Angew. Chem. Int. Ed. Engl., 50, 390–395, 2011.
7.4.2.2 Agarose Droplet Generation
The preparation of the carrier oil and the device operation have been described previously.29 Molten agarose solution mixed with cells and beads was injected into the channels by the on-chip three-valve diaphragm pump. The three valves form the input, displacement, and output of a diaphragm pump and are cycled in a four-step fashion under the control of a LabVIEW graphical interface. The whole MEGA assembly was continually heated using a heated air stream (42°C–45°C) to avoid agarose gelling in the device. Pumping parameters were optimized to produce uniform ~3 nL 1.5% agarose droplets. The sample reservoir was constantly replenished with agarose suspension to sustain droplet generation. Agarose droplets were collected and immediately gelled in 0.5 mL PCR tubes placed in freezer trays.
7.4.2.3 Single-Genome Purification
Agarose droplets were extracted from carrier oil by washing with isopropanol, 100% ethanol, and PBS (10 mL each) and resuspended in 1 mL PBS. To lyse cells, 1 mL 2× SDS lysis buffer (1% SDS, 200 mM EDTA, 20 mM Tris–HCl) and 100 mg/mL proteinase K were added, and samples were incubated overnight at 52°C. Agarose droplets were washed with 2% (w/v) Tween 20 to remove PCR-inhibiting SDS, with 100% ethanol to inactivate any remaining proteinase K, with 0.02% (w/v) Tween 20 five times (10 mL each), and finally 10 mL H2O. The supernatant was removed prior to emulsion PCR. Samples not immediately used were stored at 4°C in 100% ethanol.
7.4.2.4 Emulsion PCR
The PCR mix contained 1× AmpliTaq Gold buffer with 1.5 mM MgCl2, 0.2 mM dNTPs, 4 μg/μL heat-inactivated BSA, 0.01% Tween 80, 0.45 μM forward and 0.045 μM reverse primers for each target gene, 0.25 U/μL AmpliTaq Gold polymerase, and 12.5 μL agarose droplets containing purified single-cell genomes in each 50 μL PCR reaction. Agarose droplets were equilibrated in PCR mix in standard 0.5 mL PCR tubes for 30 min at 4°C with occasional agitation. To reemulsify the agarose droplets, 160 μL carrier oil were added and mechanically agitated. Carrier oil was identical to the oil used for initial agarose droplet formation but contained 0.8% (w/w) Triton X-100 surfactant for increased stability. Emulsions were generated by mechanical agitation. Thermal cycling, carried out in a PTC200 thermocycler (MJ Research, Waltham, MA), involved ramping to 95°C (0.1°C/s) in order to melt agarose droplets without merging, followed by a 10 min hot start at 95°C, and 33 cycles of 95°C for 30 s, 60°C for 60 s, 72°C for 90 s, and a final 72°C extension for 5 min. The reactions were cooled to 4°C.
7.4.2.5 Fluorescence Imaging
Spinning disk confocal microscopy was performed with 491 and 561 nm excitation lasers through a 63 × 1.4 NA oil immersion objective (Carl Zeiss, Inc., Thornwood, NY). Images were captured using a Cascade II charge-coupled device. Samples were stained with (50 g/mL) acridine orange or (500 g/mL) propidium iodide. Epifluorescence imaging of amplicon-labeled beads was performed using a 10 × 0.25 NA Nikon Plan objective. Images were contrast adjusted and cropped if needed for optimal viewing.
7.4.2.6 Single-Cell Sequencing
Amplicon-bound beads from emulsion PCR were reamplified in 50 μL TaqMan qPCR reaction in reactions in standard 96-well plates. Beads were counted using a hemocytometer and diluted to approximately one bead per reaction. PCR mix contained 1× Ampli buffer with 5 mM MgCl2, 0.2 mM dNTPs, 0.025% DMSO, 1 μM ROX reference dye, 0.15 μM forward and 0.15 μM reverse primers and 0.15 μM TaqMan probe for each target gene, and 0.035 U/μL AmpliTaq Gold polymerase. Thermal cycling in an ABI7300 cycler consisted of a 10 min hot start at 95°C, and 20 cycles of 95°C for 15 s, 60°C for 30 s, and 72°C for 30 s. Reactions were loaded on a 1.5% agarose gel and the two amplicons were separated and then excised, purified using a QIAquick Gel Extraction Kit (QIAGEN, Valencia, CA), and sequenced on an ABI3730 at the UC Berkeley Core Sequencing Facility.
7.4.3 Results and Discussion
7.4.3.1 Single-Cell Encapsulation and Genome Purification
Single lymphoblast cells were encapsulated along with primer-functionalized beads in 1.5% low-melting-point agarose by using a four-channel MEGA. Micropump actuation was optimized to account for the increased viscosity of molten agarose without modification of the microfluidic design. Droplet generation at approximately 40°C for 30 min resulted in the encapsulation of approximately 18,000 cells at up to 0.3 cpd on average. Figure 7.10a shows the generation of uniform 3 nL agarose droplets containing primer-functionalized beads. The inset highlights an example of cell and bead coencapsulation in a single droplet. Encapsulation in agarose droplets enables reproducible single-cell DNA extraction and isolation. Figure 7.10b shows an example of an agarose droplet in which a bead and a cell were coencapsulated (the bead is larger than the cell). Cell lysis and digestion of the DNA-binding histone proteins upon overnight incubation of the gel droplets in SDS lysis buffer containing proteinase K led to complete release of genomic DNA in a cell. The void left by the cell in the agarose was occupied by brightly fluorescent genomic DNA, which exhibited minimal diffusion into the surrounding gel (Figure 7.10c) as a result of the relatively small pore size of 1.5% agarose (~130 nm). An incubation temperature of 52°C facilitated enzymatic protein digestion while preserving the integrity of the agarose droplets. By staining with propidium iodide, we were able to visualize single high-molecular-weight DNA strands protruding from the relatively small agarose droplets. This result indicated that the majority of nuclear proteins were removed by the combination of proteinase K and SDS. The agarose droplets were stable for at least 1 week when stored in ethanol at 4°C, as determined by confocal imaging of DNA diffusion radii.
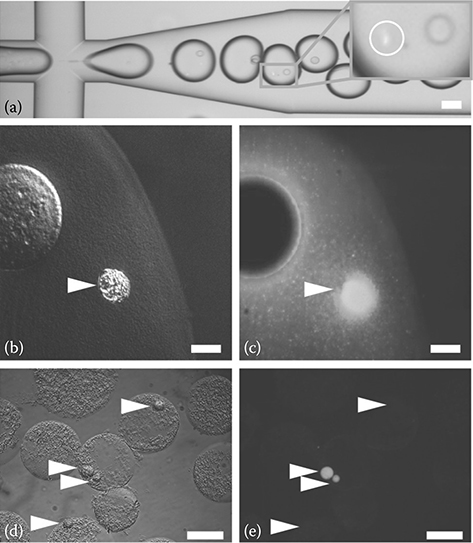
FIGURE 7.10 Microfluidic agarose encapsulation and SCGA of mammalian cells. (a) Microfluidic agarose emulsion generation showing single cells encapsulated along with primer-labeled beads in uniform 3 nL droplets. Inset highlights a cell (circled) and a bead in one droplet. (b) DIC image of a cell (arrow) at the edge of an agarose droplet after protease digestion. (c) Z-projection of confocal micrograph of the previous image showing acridine-orange-stained DNA confined in the agarose after release from the cell (arrow). (d) Following PCR amplification of the chromosomal translocation t(14;18), agarose droplets containing beads (arrows) remain intact and do not merge. (e) Epifluorescent micrograph of the previous image demonstrates primer-labeled beads (arrows) becoming fluorescent if a t(14;18)+ RL cell is present in the same droplet but otherwise remaining dark. Scale bars are 100 μm in a, d, and e and 10 μm in b and c. (Reprinted with permission from Novak, R. et al., Angew. Chem. Int. Ed. Engl., 50, 390–395, Copyright 2011. Wiley-VCH Verlag GmbH & Co. KGaA.)
7.4.3.2 Multiplexed Single-Cell Droplet PCR
A key benefit of agarose encapsulation is the ability to mechanically manipulate the isolated genomic DNA without mixing the genetic content of different cells. The agarose matrix also protects the genomic DNA from physical damage caused by flow shearing during liquid sample preparation. Without going through another microfluidic droplet generation, agarose droplets equilibrated with PCR mix can be easily reemulsified by mechanical agitation in dispersing oil to produce uniform nanoliter-droplet “reactors” for massively parallel single-cell PCR analysis. Excess PCR mix produces microfines (emulsions <1 μm in diameter), which enhance emulsion stability during thermal cycling.65 The agarose droplets melt during the hot start phase of PCR and remain liquid throughout the amplification process, maximizing reagent and amplicon diffusion rates. We varied the initial heating rate and tested various concentrations of Triton X-100 as well as combinations of Abil em90 and Span 80 detergents in oil. A slow temperature ramp profile (0.1°C/s) resulted in improved short-term stability, and the addition of BSA (4 mg/mL) to the PCR mix and 0.8% Triton X-100 to the emulsion oil minimized droplet merger over the course of PCR thermal cycling (Figure 7.10d). Fluorescently labeled amplicons bound to the primer-functionalized beads could be seen inside the agarose droplets following PCR (Figure 7.10e). The 34 μm cross-linked beads were selected for their ability to amplify targets exceeding 1 kb in amounts of at least 100 amol per bead.23 The absence of fluorescence from beads in droplets without cellular genomic DNA indicated that genomic targets were not transferred between agarose droplets.
We demonstrated highly parallel genotyping with single-cell resolution by performing a multiplex PCR assay of cancer cells harboring the t(14;18) translocation at various mutant-to-wild type (RL/TK6) cell ratios. Labeling of the control gene product, β-actin, with the cyanine dye Cy5 enabled the quantification of total cell frequency, whereas the BCL-2/IgH translocation t(14;18) product labeled with FAM spanned BCL-2 and IgH genes across their breakpoint regions and could be used to determine mutation frequency. A representative flow cytometric profile of beads following multiplex PCR amplification with 50% RL cells at an average cell frequency of 0.3 cpd (Figure 7.11a) demonstrated distinct populations of negative beads, Cy5-positive beads with β-actin only, and double-positive beads with FAM-labeled t(14;18) and Cy5-labeled β-actin. Beads containing t(14;18) only were never observed, which further indicates the conservation of single-genome integrity during cell lysis and PCR. By maintaining a constant total cell density in the single-cell regime (0.1–0.3 cpd on average) and varying the relative concentrations of mutant RL and wild-type TK6 cells, we generated a standard curve (Figure 7.11b) to confirm that amplification originated from single cells. In this stochastic regime, the linearity (r = 0.993) of the measured concentration of mutant RL cells with respect to the input in the 0%–100% RL-cell-frequency range tested indicated successful genetic analysis of single cells. Importantly, in the subset of samples further tested, the ratio of total amplicon-positive bead frequency determined by flow cytometry to the microscopically observed cell-encapsulation frequency indicated high PCR efficiency (113% ± 24%).

FIGURE 7.11 High-throughput digital genetic analysis of cancer cells. (a) A representative flow cytometry plot and gated populations of beads from a sample containing 50% RL lymphoblast cells (N = 1206) at a frequency of 0.3 cpd. The observed fraction of total positive events (26.3%) compares favorably with an expected frequency of 25.9% based on the Poisson distribution. (b) Standard curve of t(14;18)+ RL cell detection from mixtures of mutant RL and wild-type TK6 cells. Experimental quantification by multiplex emulsion PCR and flow cytometry exhibits a linear response between the 10% and 100% mutant cell frequencies tested. (Reprinted with permission from Novak, R. et al., Angew. Chem. Int. Ed. Engl., 50, 390–395, Copyright 2011. Wiley-VCH Verlag GmbH & Co. KGaA.)
7.4.3.3 Single-Cell Sequencing
For the single-cell sequencing of both target gene loci, the post-PCR beads were diluted to the stochastic limit and reamplified in a standard 96-well plate, and the products from individual wells were separated by gel electrophoresis. Gel analysis further confirmed amplification from single genomes, and frequencies of β-actin single-positive to double-positive events matched flow cytometry frequency results in the samples tested. Fluorescence-based sorting can be applied to amplicon-labeled beads to sequence only populations of interest and thereby increase efficiency. Size-separated products from single beads were excised from the gel and reamplified for Sanger sequencing. The correct sequences were recovered for both the t(14;18) target and the β-actin control (Figure 7.12). The random nucleotide insertion sequence in t(14;18) matched the unique translocation “fingerprint” determined by sequencing of RL cells in bulk.66 The reamplification step bridges single-cell PCR amplification with standard molecular-biology protocols for the sequencing of multiple genetic loci with single-cell resolution at a rate required for meaningful population analysis.
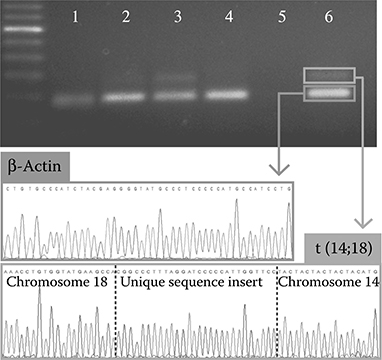
FIGURE 7.12 Multiplex single-cell sequencing. Two loci from DNA products isolated from single cells were sequenced by the reamplification of individual amplicon-labeled beads in separate PCR reactions and the separation of the two products by gel electrophoresis. This representative image of a section of the gel from a 50% RL cell sample shows amplified t(14;18) and β-actin from single beads (lanes 3 and 6), β-actin originating from TK6 cells (lanes 1, 2, and 4), the lack of β-actin and t(14;18) from negative beads (lane 5), and a 100 bp DNA ladder. A lack of t(14;18) amplification without β-actin indicates true single-cell analysis. Both products were excised and sequenced to give sequence data from two genes colocalized in a single cell. The breakpoint locations on chromosomes 14 and 18 as well as the unique insertion sequence confirmed the recovery of the expected RL lymphoblast sequence. (Reprinted with permission from Novak, R. et al., Angew. Chem. Int. Ed. Engl., 50, 390–395, Copyright 2011. Wiley-VCH Verlag GmbH & Co. KGaA.)
Using this approach, it is possible to sequence multiple target genes from hundreds of single cells in a single experiment and to perform statistical analysis of gene-sequence variation of a cell population. Our agarose cell-encapsulation and emulsion PCR method has the potential to combine with next-generation sequencing technologies to provide additional gains in throughput for single-cell sequencing. In the case of follicular lymphoma, identification of the breakpoint sequence along IgH and BCL-2 genes can help in the elucidation of the mechanisms of erroneous genetic recombination that cause the translocation t(14;18), whereas the random insertion sequence between the two chromosomes is a unique identifier of distinct mutation events.66 Alternative single-cell analysis approaches, such as fluorescence in situ hybridization and in situ PCR, are utilized for investigating cell-mutation progression, their throughput is limited, and the inability to recover amplicons prevents the identification of unknown mutations.
Agarose droplet encapsulation offers a robust means for parallel cell lysis and DNA purification of cell types that are difficult to screen using other single-cell PCR techniques. The method can be adapted to encapsulate live single cells for cell culture and subsequent analysis of clonal populations. Although a similar approach was demonstrated recently for the screening and amplification of alginate-encapsulated E. coli colonies containing plasmid libraries,67 our approach enables the robust genome purification of mammalian cells, requires 1% of the reagent volume for emulsion PCR, does not require droplet sorting, and maintains single-cell segregation throughout all downstream analyses as a result of the incorporation of primer-functionalized beads as amplicon substrates. Furthermore, single-cell sequencing techniques generally involve cell types that are amenable to lysis during PCR and the sorting of single cells into 96-well PCR plates. However, PCR amplification directly from single cells has been hindered by the lack of a DNA-purification step that would remove histones and other nuclear components that inhibit polymerase activity. Our approach incorporates a highly parallel single-cell-lysis and DNA-purification step, resulting in near 100% amplification efficiency. Finally, the ability to purify genomic DNA from single cells in a supporting matrix opens up the possibility of single-cell epigenetic analysis, such as the methylation-specific PCR of gene regulatory sequences following conversion with bisulfite for sequencing.
7.5 Conclusions
Cancer is an evolving disease driven by genetic instability, which results in constant clonal divergence of the tumor cell population. The accumulation of mutations in the genes coding for cellular pathways plays an important role in carcinogen-esis, metastasis, and therapeutic resistance. Significant cellular heterogeneity may therefore exist in tumors; this heterogeneity changes dynamically at different stages of disease progression.68 Droplet microfluidics is uniquely positioned for high-throughput, sensitive single-molecule and single-cell analyses as it offers significant advantages compared to conventional robotic laboratory systems, such as speed, throughput, sensitivity, and ultralow sample consumption. We have developed a MEGA technology as a core droplet-based digital microfluidic platform for high-throughput single-cell genetic analysis. We have characterized a unique droplet formation mechanism underlying the active pump-driven droplet formation, which allows for programmable, on-demand formation of complex droplet patterns. Based on the MEGA technology, we developed a multiplexed SCGA method that is used to address multiple problems in biology. We first demonstrated the feasibility of ultrasensitive pathogen detection and genotyping with high speed with sensitivity extending to one pathogen in a 106 background. The digital microfluidic technology was then adapted to multilocus detection and sequencing of genes in single cells for high-throughput analysis of variable regions as well as mutation colocalization. The ability to sequence multiple targets within single cells with high throughput will facilitate investigation of the synergistic effects of mutation co-occurrence and its impact on disease progression and treatment. Furthermore, the screening of large cell populations will uncover potential tumor heterogeneity at the single-nucleotide level that is otherwise obscured by the ensemble average. Overall, our high-performance microfluidic single-cell genetic analysis technology provides a powerful tool for probing the stochastic mechanisms of carcinogenesis, progression, and response to chemotherapy.
The authors gratefully acknowledge the contributions of Richard Novak, Dr. Joe Shuga, Professor Martyn T. Smith from the University of California at Berkeley, Mimi Shin and Dr. Tanyu Wang from the University of Kansas, and all the other collaborators who contributed to the work described in this chapter. This work was supported by the trans-NIH Genes, Environment and Health Initiative, Biological Response Indicators of Environmental Systems Center Grant U54 ES016115-01, by the Superfund Basic Research Program NIEHS Grant P42 ES004705, and the new faculty start-up funds from the University of Kansas.
References
1. Cai, L., Friedman, N. and Xie, X.S. Stochastic protein expression in individual cells at the single molecule level. Nature 440, 358–362 (2006).
2. Hanahan, D. and Weinberg, R.A. The hallmarks of cancer. Cell 100, 57–70 (2000).
3. Elowitz, M.B., Levine, A.J., Siggia, E.D. and Swain, P.S. Stochastic gene expression in a single cell. Science 297, 1183–1186 (2002).
4. Toriello, N.M. et al. Integrated microfluidic bioprocessor for single-cell gene expression analysis. Proc. Natl Acad. Sci. USA 105, 20173–20178 (2008).
5. King, K.R. et al. A high-throughput microfluidic real-time gene expression living cell array. Lab Chip 7, 77–85 (2007).
6. Klein, C.A. et al. Genetic heterogeneity of single disseminated tumour cells in minimal residual cancer. Lancet 360, 683–689 (2002).
7. Fuhrmann, C. et al. High-resolution array comparative genomic hybridization of single micrometastatic tumor cells. Nucleic Acids Res. 36, e39 (2008).
8. Batchelor, E., Loewer, A. and Lahav, G. The ups and downs of p53: Understanding protein dynamics in single cells. Nat. Rev. Cancer 9, 371–377 (2009).
9. Li, X.J., Ling, V. and Li, P.C.H. Same-single-cell analysis for the study of drug efflux modulation of multidrug resistant cells using a microfluidic chip. Anal. Chem. 80, 4095–4102 (2008).
10. Pantel, K., Brakenhoff, R.H. and Brandt, B. Detection, clinical relevance and specific biological properties of disseminating tumour cells. Nat. Rev. Cancer 8, 329–340 (2008).
11. d’Amore, F. et al. Clonal evolution in t(14;18)-positive follicular lymphoma, evidence for multiple common pathways, and frequent parallel clonal evolution. Clin. Cancer Res. 14, 7180–7187 (2008).
12. Carter, H. et al. Cancer-specific high-throughput annotation of somatic mutations: Computational prediction of driver missense mutations. Cancer Res. 69, 6660–6667 (2009).
13. Chiu, B.C.H. et al. Agricultural pesticide use and risk of t(14;18)-defined subtypes of non-Hodgkin lymphoma. Blood 108, 1363–1369 (2006).
14. Arora, A., Simone, G., Salieb-Beugelaar, G.B., Kim, J.T. and Manz, A. Latest developments in micro total analysis systems. Anal. Chem. 82, 4830–4847 (2010).
15. Zeng, Y. and Wang, T. Quantitative microfluidic biomolecular analysis for systems biology and medicine. Anal. Bioanal. Chem. 405, 5743–5758 (2013).
16. Teh, S.Y., Lin, R., Hung, L.H. and Lee, A.P. Droplet microfluidics. Lab Chip 8, 198–220 (2008).
17. Niu, X. and Demello, A.J. Building droplet-based microfluidic systems for biological analysis. Biochem. Soc. Trans. 40, 615–623 (2012).
18. Guo, M.T., Rotem, A., Heyman, J.A. and Weitz, D.A. Droplet microfluidics for high-throughput biological assays. Lab Chip 12, 2146–2155 (2012).
19. Nakano, M. et al. Single-molecule PCR using water-in-oil emulsion. J. Biotechnol. 102, 117–124 (2003).
20. Dressman, D., Yan, H., Traverso, G., Kinzler, K.W. and Vogelstein, B. Transforming single DNA molecules into fluorescent magnetic particles for detection and enumeration of genetic variations. Proc. Natl Acad. Sci. USA 100, 8817–8822 (2003).
21. Beer, N.R. et al. On-chip, real-time, single-copy polymerase chain reaction in picoliter droplets. Anal. Chem. 79, 8471–8475 (2007).
22. Beer, N.R. et al. On-chip single-copy real-time reverse-transcription PCR in isolated picoliter droplets. Anal. Chem. 80, 1854–1858 (2008).
23. Kumaresan, P., Yang, C.J., Cronier, S.A., Blazei, R.G. and Mathies, R.A. High-throughput single copy DNA amplification and cell analysis in engineered nanoliter droplets. Anal. Chem. 80, 3522–3529 (2008).
24. Mazutis, L. et al. Droplet-based microfluidic systems for high-throughput single DNA molecule isothermal amplification and analysis. Anal. Chem. 81, 4813–4821 (2009).
25. Huebner, A. et al. Quantitative detection of protein expression in single cells using droplet microfluidics. Chem. Commun. (12), 1218–1220 (2007).
26. Huebner, A. et al. Static microdroplet arrays: A microfluidic device for droplet trapping, incubation and release for enzymatic and cell-based assays. Lab Chip 9, 692–698 (2009).
27. Mazutis, L., Baret, J.C. and Griffiths, A.D. A fast and efficient microfluidic system for highly selective one-to-one droplet fusion. Lab Chip 9, 2665–2672 (2009).
28. Brouzes, E. et al. Droplet microfluidic technology for single-cell high-throughput screening. Proc. Natl Acad. Sci. USA 106, 14195–14200 (2009).
29. Zeng, Y., Novak, R., Shuga, J., Smith, M.T. and Mathies, R.A. High-performance single cell genetic analysis using microfluidic emulsion generator arrays. Anal. Chem. 82, 3183–3190 (2010).
30. Zeng, Y., Shin, M. and Wang, T. Programmable active droplet generation enabled by integrated pneumatic micropumps. Lab Chip 13, 267–273 (2013).
31. Zeng, Y., Novak, R., Shuga, J., Smith, M.T. and Mathies, R.A. High-performance single cell genetic analysis using microfluidic emulsion generator arrays. Anal. Chem. 82, 3183–3190 (2010).
32. Novak, R. et al. Single-cell multiplex gene detection and sequencing with microfluidically generated agarose emulsions. Angew. Chem. Int. Ed. Engl. 50, 390–395 (2011).
33. Christopher, G.F. and Anna, S.L. Microfluidic methods for generating continuous droplet streams. J. Phys. D Appl. Phys. 40, R319–R336 (2007).
34. Prakash, M. and Gershenfeld, N. Microfluidic bubble logic. Science 315, 832–835 (2007).
35. Shemesh, J., Nir, A., Bransky, A. and Levenberg, S. Coalescence-assisted generation of single nanoliter droplets with predefined composition. Lab Chip 11, 3225–3230 (2011).
36. Gu, H., Murade, C.U., Duits, M.H. and Mugele, F. A microfluidic platform for on-demand formation and merging of microdroplets using electric control. Biomicrofluidics 5, 11101 (2011).
37. Zeng, S., Li, B., Su, X., Qin, J. and Lin, B. Microvalve-actuated precise control of individual droplets in microfluidic devices. Lab Chip 9, 1340–1343 (2009).
38. Lin, R., Fisher, J.S., Simon, M.G. and Lee, A.P. Novel on-demand droplet generation for selective fluid sample extraction. Biomicrofluidics 6, 24103 (2012).
39. Christopher, G.F., Noharuddin, N.N., Taylor, J.A. and Anna, S.L. Experimental observations of the squeezing-to-dripping transition in T-shaped microfluidic junctions. Phys. Rev. E 78, 036317 (2008).
40. Willaime, H., Barbier, V., Kloul, L., Maine, S. and Tabeling, P. Arnold tongues in a microfluidic drop emitter. Phys. Rev. Lett. 96, 054501 (2006).
41. Grover, W.H., Skelley, A.M., Liu, C.N., Lagally, E.T. and Mathies, R.A. Monolithic membrane valves and diaphragm pumps for practical large-scale integration into glass microfluidic devices. Sens. Actuators B Chem. 89, 315–323 (2003).
42. Bransky, A., Korin, N., Khoury, M. and Levenberg, S. A microfluidic droplet generator based on a piezoelectric actuator. Lab Chip 9, 516–520 (2009).
43. Mead, P.S. et al. Food-related illness and death in the United States. Emerg. Infect. Dis. 5, 607–625 (1999).
44. Nugen, S.R. and Baeumner, A.J. Trends and opportunities in food pathogen detection. Anal. Bioanal. Chem. 391, 451–454 (2008).
45. Batt, C.A. Materials science: Food pathogen detection. Science 316, 1579–1580 (2007).
46. Diehl, F. et al. Detection and quantification of mutations in the plasma of patients with colorectal tumors. Proc. Natl Acad. Sci. USA 102, 16368–16373 (2005).
47. Zhong, J.F. et al. A microfluidic processor for gene expression profiling of single human embryonic stem cells. Lab Chip 8, 68–74 (2008).
48. Lagally, E.T. et al. Integrated portable genetic analysis microsystem for pathogen/infectious disease detection. Anal. Chem. 76, 3162–3170 (2004).
49. Liu, R.H., Yang, J.N., Lenigk, R., Bonanno, J. and Grodzinski, P. Self-contained, fully integrated biochip for sample preparation, polymerase chain reaction amplification, and DNA microarray detection. Anal. Chem. 76, 1824–1831 (2004).
50. Cady, N.C., Stelick, S., Kunnavakkam, M.V. and Batt, C.A. Real-time PCR detection of Listeria monocytogenes using an integrated microfluidics platform. Sens. Actuators B Chem. 107, 332–341 (2005).
51. Thaitrong, N., Toriello, N.M., Del Bueno, N. and Mathies, R.A. Polymerase chain reaction-capillary electrophoresis genetic analysis microdevice with in-line affinity capture sample injection. Anal. Chem. 81, 1371–1377 (2009).
52. Beyor, N., Yi, L.N., Seo, T.S. and Mathies, R.A. Integrated capture, concentration, polymerase chain reaction, and capillary electrophoretic analysis of pathogens on a chip. Anal. Chem. 81, 3523–3528 (2009).
53. Vogelstein, B. and Kinzler, K.W. Digital PCR. Proc. Natl Acad. Sci. USA 96, 9236–9241 (1999).
54. Beer, N.R. et al. On-chip, real-time, single-copy polymerase chain reaction in picoliter droplets. Anal. Chem. 79, 8471–8475 (2007).
55. Chao, T.C. and Ros, A. Microfluidic single-cell analysis of intracellular compounds. J. R. Soc. Interface 5(Suppl 2), S139–S150 (2008).
56. Ottesen, E.A., Hong, J.W., Quake, S.R. and Leadbetter, J.R. Microfluidic digital PCR enables multigene analysis of individual environmental bacteria. Science 314, 1464–1467 (2006).
57. Zhang, H., Jenkins, G., Zou, Y., Zhu, Z. and Yang, C.J. Massively parallel single-molecule and single-cell emulsion reverse transcription polymerase chain reaction using agarose droplet microfluidics. Anal. Chem. 84, 3599–3606 (2012).
58. Zare, R.N. and Kim, S. Microfluidic platforms for single-cell analysis. Annu. Rev. Biomed. Eng. 12, 187–201 (2010).
59. Aster, J.C. and Longtine, J.A. Detection of BCL-2 rearrangements in follicular lymphoma. Am. J. Pathol. 160, 759–763 (2002).
60. Cleary, M.L. and Sklar, J. Nucleotide sequence of a t(14;18) chromosomal breakpoint in follicular lymphoma and demonstration of a breakpoint-cluster region near a transcriptionally active locus on chromosome 18. Proc. Natl Acad. Sci. USA 82, 7439–7443 (1985).
61. Korsmeyer, S.J. BCL-2 gene family and the regulation of programmed cell death. Cancer Res. 59, 1693s–1700s (1999).
62. Rabkin, C.S., Hirt, C., Janz, S. and Dolken, G. t(14;18) Translocations and risk of follicular lymphoma. J. Natl Cancer Inst. Monogr. (39), 48–51 (2008).
63. Biagi, J.J. and Seymour, J.F. Insights into the molecular pathogenesis of follicular lymphoma arising from analysis of geographic variation. Blood 99, 4265–4275 (2002).
64. Bretherick, K.L. et al. Elevated circulating t(14;18) translocation levels prior to diagnosis of follicular lymphoma. Blood 116, 6146–6147 (2010).
65. Margulies, M. et al. Genome sequencing in microfabricated high-density picolitre reactors. Nature 437, 376–380 (2005).
66. McHale, C.M. et al. Chromosome translocations in workers exposed to benzene. J. Natl Cancer Inst. Monogr. (39), 74–77 (2008).
67. Walser, M. et al. Novel method for high-throughput colony PCR screening in nanoliter-reactors. Nucleic Acids Res. 37, e57 (2009).
68. Navin, N. et al. Inferring tumor progression from genomic heterogeneity. Genome Res. 20, 68–80 (2010).