
9 A Review of Tubeless Microfluidic Devices
9.1 Introduction
Microfluidics is a field of science driven by the vision of entire biological and chemical laboratories developed on a miniaturized silicon or polymer chip. Microfluidic technologies offer advantages such as reduced sample size, decreased assay times, and minimized reagent consumption, reducing experimental costs and speeds while increasing experimental precision over their macroscale counterparts. Micromachining technologies have evolved to the point where valves, mixers, and pumps can all be built. The ultimate goal has been to integrate multiple components to form ‘lab-on-a-chip’ devices, where complex tasks are performed in a miniaturized chip instead of in large laboratories that require individual systems for specific tasks. The physics that dominate at the microscale are different from the physics that dominate at the macroscale, allowing for added functionalities not possible at the macroscale.1
Surface tension, van der Waals’ forces, electrostatic force, capillary action, viscosity, laminar flow, diffusion, fluidic resistance, and surface area to volume ratios are all examples of dominant forces acting at the microscale. The macroscale is largely dominated by, for example, momentum, turbulence, and gravity. By understanding and using the unique physics at the microscale, microfluidic technologies can perform tasks not possible at the macroscale and permit new methods, ways of thinking, and solutions to emerge.1
Researchers are shifting their attention toward simplifying the way they control fluid flow inside microfluidic devices. Many different passive microfluidic devices have been successfully demonstrated in the literature, including passive valves, mixers, extractors, filters, and actuation schemes. A review of these methods can be found elsewhere.2 There are also many types of active pumps used for moving flow in microscale devices.3 These include reciprocating pumps, rotary pumps, centrifugal pumps, dynamic micropumps based on electromagnetic fields, electroosmotic pumps that use surface charge phenomena, and magnetohydrodynamic pumps. Although each type of pump has an advantage over others for any given application, most require complex manufacturing steps, while others rely on large and expensive external equipment to work.
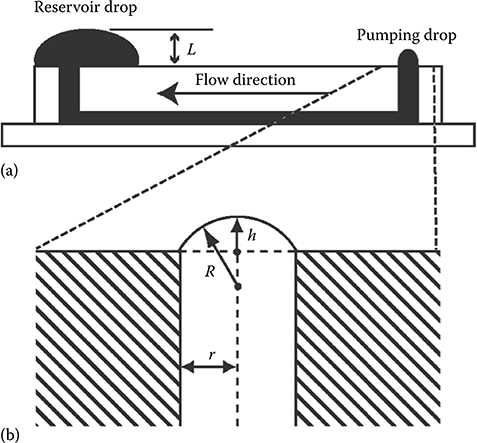
FIGURE 9.1 (a) Side view of a microchannel. An outlet port with a large drop and inlet port with a smaller drop are required to create fluid flow. (b) Description of inlet drop with height (h), drop radius (R), and inlet port radius (r). (From Walker, G. and Beebe, D.J., Lab Chip, 2, 131–134, 2002.)
Passive microfluidic devices have advantages, for instance they do not require external power sources and are easy to integrate into existing laboratory infrastructure. A category of microfluidic devices called tubeless microfluidic devices brings the added advantage of removing the dead volume that would be present in tubing. Examples of tubeless microfluidic devices include those used in surface tension passive pumping and in electroosmotic flow. Surface tension passive pumping is both passive and tubeless. With this technique, the surface tension inherent to small drops provides a means of moving fluid without using external actuation mechanisms. Surface tension passive pumping was first described by Glenn Walker and David Beebe in 2002.4 Surface tension passive pumping, from here on referred to as passive pumping, is an actuation mechanism where the surface tension in small drops is used to create flow within a microfluidic device. The Laplace law, ΔP = γ(1/R1 + 1/R2), where ∆P is a pressure differential across a droplet interface, γ is the liquid surface tension, and R1 and R2 are the principal radii of curvature, is used to describe how a small droplet contains a higher inner pressure than a larger droplet. When a small drop is connected via a microfluidic device to a larger drop, flow moves from the small to the large drop (Figure 9.1). The characterization of this flow is the focus of many works that aim to apply passive pumping to a wide range of biological and biochemical studies.
9.2 Flow Rate Analysis
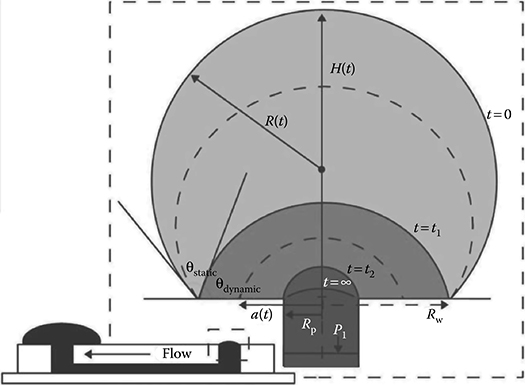
FIGURE 9.2 Two phase inlet drop collapse. (From Berthier, E. and Beebe, D.J., Lab Chip, 7, 1475–1478, 2007.)
Biological protocols require understanding of the flow rates being used during experiments or an understanding of the pressure necessary to move flow across a microfluidic device. Berthier et al. developed a mathematical model that characterizes the collapse of a drop of water placed in the inlet of a microfluidic passive pumping device.5 The drop’s collapse into the inlet of the device is composed of two phases (Figure 9.2). The first phase is characterized by a decrease in the drop’s contact angle with respect to the surface while a constant contact area with the surface is maintained. The contact angle diminishes until it reaches a critical contact angle value. The second phase starts once this critical contact angle is reached. In the second phase, the contact area between the drop and the liquid diminishes while the contact angle remains constant. Using the calculations available in this paper, one can calculate the time it takes for a drop of a given volume to collapse into the microfluidic device. Flow rates and liquid velocities can then be estimated as a function of channel dimensions and inlet drop volume. Chen et al. provided a more general numerical model of volumetric flow rate as a function of time under various experimental conditions for surface tension passive pumping.6 In their modeling, the authors consider the surface energy of small droplets, the hydrostatic pressure difference between the input and output ports of the microfluidic device, and the hydrodynamic resistance of the microfluidic channel.
9.3 Evaporation
The prelude to surface tension passive pumping was the use of a polydimethylsiloxane (PDMS) microfluidic device filled with water to show how evaporation can be used to create flow and concentrate beads.7 The PDMS device connects a reservoir port to a collection port. A large drop is placed in the reservoir port. Liquid from the collection port evaporates creating flow from the reservoir to the collection port. Fluorescent beads are carried with the flow and are concentrated at the collection port (Figure 9.3). A bead concentration gradient forms as beads are collected. The gradient becomes shorter as time progresses (tc > tb > ta).
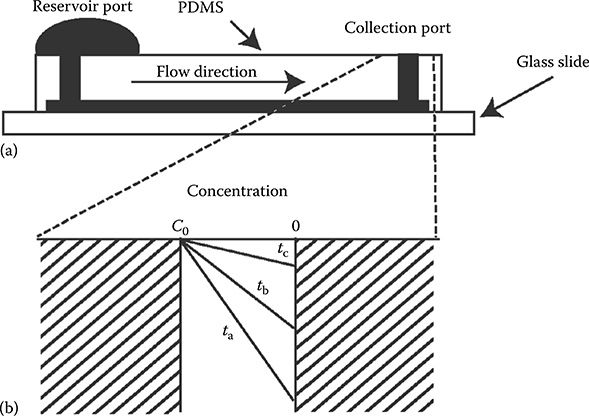
FIGURE 9.3 (a) Side view of microfluidic device. (b) Air–water interface at collection port modeled as a horizontal surface. Lines (ta, tb, tc) depict the concentration gradient of particles as evaporation progresses. (From Walker, G.M. and Beebe, D.J., Lab Chip, 2, 57–61, 2002.)
Evaporation is an important topic in tubeless microfluidics. The open air–liquid interface and the potential for large surface area to volume ratios present in tubeless microfluidic devices make evaporation a major issue. Methods to mitigate evaporation include replacing the evaporated liquid, covering the open air–liquid interface with a solid or oil, and adding a high-boiling-point component to lower the liquid’s vapor pressure. However, these methods may be too invasive or may require constant monitoring of the microfluidic device to ensure it is in working order. Berthier et al. analyzed a less invasive method where they increased the humidity in the environment by placing sacrificial drops around the device of interest (Figure 9.4).8
Berthier et al. followed this original work with a study of the interplay between convection and diffusion inside a microfluidic passive pumping channel.9 Passive pumping occurs from a small drop to a large drop; however, evaporation will cause flow from the large drop to the small drop (in the opposite direction to the passive pumping flow) during storage of the device (Figure 9.5).
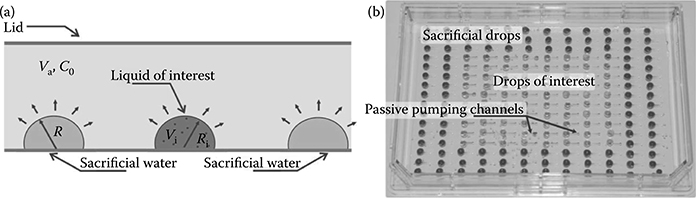
FIGURE 9.4 (a) A drop with volume Vi and radius Ri is placed in the environment of volume Va and humidity C0, surrounded by sacrificial drops of radius R. (b) Passive pumping–based assay in an Omnitray containing drops of interest and sacrificial drops for reducing volume loss on the drops of interest via evaporation. (From Berthier, E., Warrick, J., Yu, H., and Beebe, D.J., Lab Chip, 8, 852–859, 2008.)
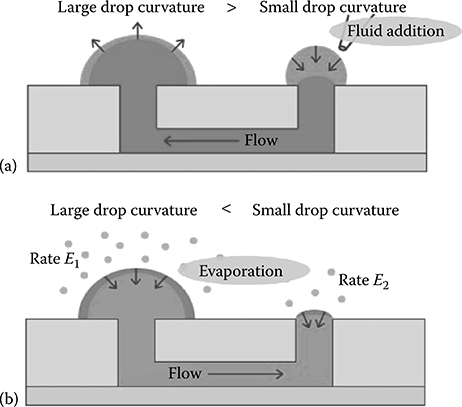
FIGURE 9.5 (a) Flow occurs from a small drop to a large drop via surface tension passive pumping. (b) Evaporation occurs at both the large and small drop; however, relative volume loss is greater in the small drop, causing flow from the large to the small drop. (From Berthier, E., Warrick, J., Yu, H., and Beebe, D.J., Lab Chip, 8, 860–864, 2008.)
The volume loss associated with evaporation is important in cell biology as it leads to changes in osmolarity and has a direct impact on cellular mechanisms. The convection caused by flow due to evaporation competes with the diffusion of soluble proteins in cell–cell interactions (Figure 9.6). The less humid the environment, the more effect evaporation will have on the liquid. Ways to mitigate convection–diffusion effects include increasing the cross-sectional area, adding alternate flow paths to reduce convection in the areas of interest, and reducing the size of the air–liquid interface at the ports. Adding sacrificial water around the device of interest will increase the humidity in the environment and decrease evaporation.

FIGURE 9.6 COMSOL simulation of the concentration of a secreted protein (D = 10−10 m2s−1) corresponding to different humidity conditions in the environment it is placed in. Lower humidity environments cause higher evaporation rates and stronger flow, effectively washing secreted protein away. RH, relative humidity. (From Berthier, E., Warrick, J., Yu, H., and Beebe, D.J., Lab Chip, 8, 860–864, 2008.)
Zhu et al.10 saw evaporation-based backward spreading of a virus while performing an infection assay using passive pumping. Lynn et al.11 used evaporation to their advantage when studying evaporation at the ports as a function of port dimensions. In their paper, they presented a two-step method to predict the liquid evaporation rates of an air–liquid interface over time. First, they determined the shape of the air–liquid meniscus created in a reservoir for a given liquid volume. Second, computational fluid dynamics (CFD) simulations were used to calculate the instantaneous rate of evaporation for the given meniscus shape. The results show that evaporation is a function of the port geometry. This is important as evaporation rates in tubeless microfluidic devices can lead to experimental error. Hence, a user should understand and control for evaporation to avoid unwanted changes in experimental conditions. Microfluidic device design should take into account local evaporation rates to avoid experimental error. Figure 9.7 shows the geometric parameters used to describe the meniscus and the microreservoir for the CFD simulations.11,12
Figure 9.8 shows the effect of reservoir liquid volume on evaporation given an expanding reservoir and a contracting reservoir.11 The result shows that the local evaporation rate is greater for greater reservoir volumes. For a given reservoir volume, the local evaporation rate is greater for an expanding reservoir than for a contracting reservoir. Less liquid volume in a reservoir means gas molecules have to travel larger diffusion distances. Hence, a lower evaporation rate is observed.
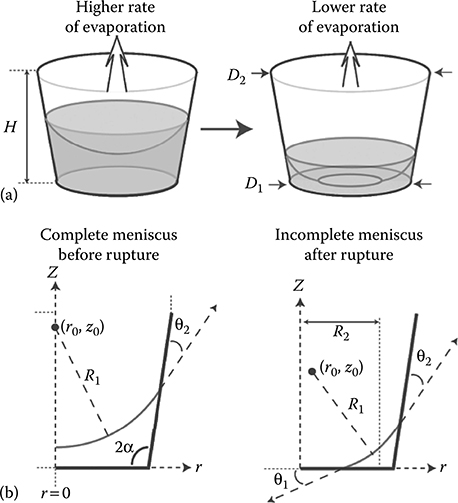
FIGURE 9.7 (a) Complete and incomplete meniscus in a microreservoir. (b) Geometric parameters used to describe the meniscus in a microreservoir. (From Lynn, N.S., Henry, C., and Dandy, D., Lab Chip, 9, 1780–1788, 2009.)
Results from Lynn et al.11 show the evaporation rate as a function of reservoir volume for different channel geometries, assuming constant contact angles and a constant microreservoir bottom diameter, D1. There is more evaporation for an expanding reservoir and more evaporation for less channel height. Less channel height means a shorter diffusion distance for gas molecules to travel, hence higher evaporation rates. An expanding reservoir has a greater air–liquid surface area (i.e., a larger evaporation area than its contracting counterpart); therefore, evaporation rates for an expanding reservoir are greater. In addition, the position of the meniscus in an expanding reservoir will be higher, reducing the gas diffusion distance and increasing evaporation rates. Results also show an increase in evaporation with a decrease in liquid–reservoir contact angle; this is mainly due to the increase in the air–liquid interface area with the decrease in liquid–reservoir contact angles.

FIGURE 9.8 CFD simulations displaying the mole fraction of water vapor in several reservoirs containing different liquid volumes (V). The rate of evaporation from the air–liquid interface (Qe) is displayed for each scenario. (From Lynn, N.S., Henry, C., and Dandy, D., Lab Chip, 9, 1780–1788, 2009.)
Lynn et al.11 continued their work by analyzing evaporation-mediated flow in a follow-up paper where capillary forces and evaporation were used as the actuation mechanism for fluid flow.12 Fluid is introduced into the microfluidic device through an inlet reservoir. Capillary forces move liquid through the hydrophobic microchannel that connects the inlet and outlet reservoirs until liquid at the outlet reservoir forms a meniscus around the corners of the reservoir. The pressure differential arising from this small, curved meniscus situated on the bottom of the outlet reservoir drives liquid through the microfluidic device (Figure 9.9). The system reaches steady state and is able to provide precise flow rates for periods of over an hour. Control over flow rate is achieved by controlling the microfluidic device and outlet reservoir dimensions.
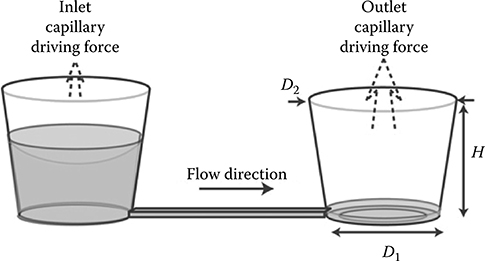
FIGURE 9.9 Diagram of the system described in Lynn et al.12 (From Lynn, N.S. and Dandy, D., Lab Chip, 9, 3422–3429, 2009.)
Surface tension passive pumping as described by Walker and Beebe4 uses the surface tension inherent in small droplets to drive flow. Evaporation is indeed an important factor in surface tension passive pumping; however, the flow caused by surface tension works in a much faster time scale than the flow obtained by evaporation. While surface tension passive pumping can be analytically described and predicted for flow occurring in seconds to minutes, Lynn et al.11,12 presented evaporation as a way to control flow for over an hour. Figure 9.10 presents experimental fluid velocity data overlaid on theoretical predictions for two reservoirs, having different volumes of 1.5 μL and 2.0 μL, using coupled capillary/evaporation effects to create fluid flow. It is important to note that surface tension passive pumping4 is different from capillary flow as defined by the filling of an empty hydrophobic channel due to intermolecular attractive forces between the liquid and the solid surrounding surfaces.

FIGURE 9.10 Experimental and theoretical predictions of average fluid velocity, v (mm s−1), as a function of time (s) using coupled capillary/evaporation effects for different initial inlet reservoir volumes, V0 = 2.0 and 1.5 μL. (From Lynn, N.S. and Dandy, D., Lab Chip, 9, 3422–3429, 2009.)
Like the Dandy laboratory, the Khademhosseini laboratory has used evaporation to their advantage. In their work, Du et al.13 created controllable concentration gradients of molecules in a microfluidic device using a tubeless passive pumping microchannel. The concentration gradient was first established using forward flow induced by passive pumping and then controlled using evaporation-induced backward flow in the same channel. The backward flow component along the microfluidic channel allowed spatial and temporal control of the gradient. Stopping the flow then stabilized the gradient profile (Figure 9.11). To demonstrate the applications of this methodology, a stabilized concentration gradient of a cardiac toxin, alpha-cypermethrin, along the microchannel was used to test the response of HL-1 cardiac cells in the microdevice, which correlated with toxicity data obtained from multiwell plates.
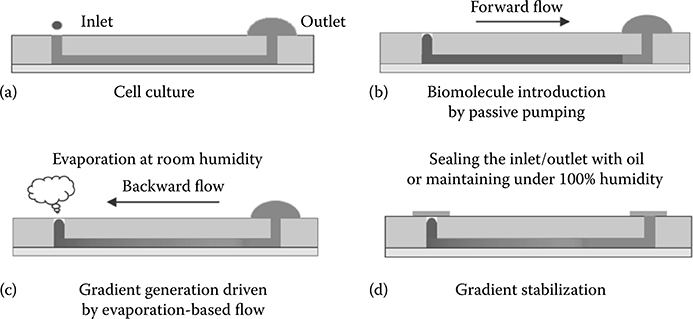
FIGURE 9.11 Schematic of the gradient device developed by Du et al.13 (a) A microfluidic channel is filled with culture medium. (b) Solution is introduced into the channel by passive pumping. (c) A concentration gradient develops due to evaporation-based backward flow. (d) The gradient profile is stabilized by sealing the inlet and outlet ports. (From Du, Y., Shim, J., Vidula, M., Hancock, M., Lo, E., Chung, B., Borenstein, J., Khabiry, M., Cropek, D., and Khademhosseini, A., Lab Chip, 9, 761–767, 2009.)
Figure 9.12a shows fluorescence images of forward fluorescein flow into microfluidic channels using a passive pump. Figure 9.12b shows fluorescence images demonstrating the generation of a dynamic gradient of fluorescein solution using evaporation-driven backward flow. Analogous results are shown in Figure 9.13, where the toxicity of a stabilized concentration gradient of alpha-cypermethrin is studied on the HL-1 cells from outlet (5 cm) to inlet (0 cm) after 4 h residence time.13
9.4 Sample Concentration
Following up on the original work with evaporation-mediated sample concentration by Walker and Beebe,7 Warrick et al.14 worked with passive pumping to concentrate cells and demonstrated the use of passive pumping to load samples into a cell concentration device (Figure 9.14). The concentrator is used to concentrate a suspension of cells and seed them into a microchannel. Passive pumping was used to drive flow. Unlike the 2002 work that used evaporation to drive flow and concentrate samples at a collection port,7 Warrick et al. flowed biological cells through channels of different sizes using small, fast channels for flow and larger, slower channels where cells concentrate and adhere to the substrate. While in the substrate, the cells can be cultured and treated. The method can be used for culture and subsequent application of treatment protocols. The authors used passive pumping as a loading mechanism since it allows control of the flow rate used for concentrating samples by changing the wetted diameter at the input and changing the volume of fluid placed at the input.

FIGURE 9.12 (a) Forward flow due to passive pumping. (b) Evaporation mediated backward flow. (From Du, Y., Shim, J., Vidula, M., Hancock, M., Lo, E., Chung, B., Borenstein, J., Khabiry, M., Cropek, D., and Khademhosseini, A., Lab Chip, 9, 761–767, 2009.)
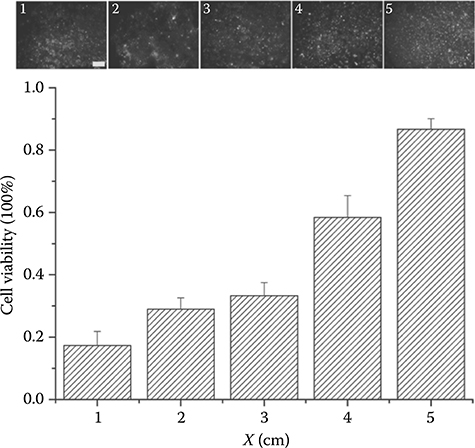
FIGURE 9.13 Top: Fluorescent imaging showing the viability of HL-1 cells along the 5 cm length of a microfluidic channel after treatment with the toxin concentration gradient (scale bar: 600 μm). Bottom: Quantification of the viability of HL-1 cells along the 5 cm long microfluidic channel after treatment with the toxin concentration gradient. (From Du, Y., Shim, J., Vidula, M., Hancock, M., Lo, E., Chung, B., Borenstein, J., Khabiry, M., Cropek, D., and Khademhosseini, A., Lab Chip, 9, 761–767, 2009.)

FIGURE 9.14 Passive pumping cell concentration device. (Reprinted adapted from Warrick, J., Casavant, B., Frisk, M., and Beebe, D.J., Anal. Chem., 82, 8320–8326, 2010. With permission.)
9.5 Concentration Gradients
Walker et al.7 mentioned a bead concentration gradient that formed at the collection port while using evaporation to concentrate samples. Concentration gradients are important for the research community because they allow the study of many biological and pathological processes, such as metastasis, embryogenesis, axon guidance, and wound healing.15 Microfluidic devices allow researchers to manipulate fluid flow and diffusion profiles to create spatiotemporal biomolecular gradients and allow cell–extracellular environment, cell–cell, cell–matrix, and cell–soluble factor interactions.15
Du et al.13 studied the viability of HL-1 cells along a 5 cm long microfluidic channel after treatment with a toxin concentration gradient (Figure 9.13). In their work, Kim et al.16 designed a device for chemotaxis based on static diffusion and passive pumping. Chemotaxis is the phenomenon in which cells, bacteria, and other organisms move according to stimuli and chemical gradients in their environment. The 2009 paper describes a chemotaxis device with an in situ nanoporous membrane that eliminates the effect of flow for chemotaxis (Figures 9.15 and 9.16).16 Passive pumping is used to fill the source channel. The nanoporous membrane was used to prevent flow from interfering with diffusion phenomena and ensures that diffusion is the only force that drives the generation of a gradient from the source to the sink channel (Figure 9.15b).17 Previously, Abhyankar et al.18 had used a membrane with high fluidic resistance to create a concentration gradient and limit flow due to pressure differentials (i.e., passive pumping) from interfering with gradient.
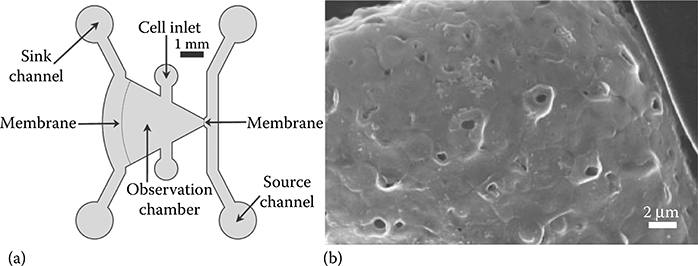
FIGURE 9.15 (a) Passive pumping chemotaxis device.16 (b) In situ nanoporous membrane.17 (From Kim, D., Lokuta, M., Huttenlocher, A., and Beebe, D.J., Lab Chip, 9, 1797–1800, 2009; Kim, D. and Beebe, D.J., J. Appl. Polym. Sci., 110, 1581–1589, 2008.)
Results from fluorescent experiments in which fluorescein was introduced into the device’s source channel by passive pumping show no flow into the observation chamber (Figure 9.16). Results demonstrate that a concentration gradient developed in the observation chamber and show neutrophil migration up a chemoattractant concentration gradient (Figure 9.17).
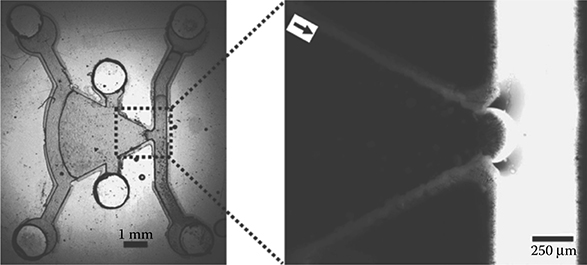
FIGURE 9.16 Nanoporous membrane prevents flow from the sink channel to the observation chamber. (From Kim, D., Lokuta, M., Huttenlocher, A., and Beebe, D.J., Lab Chip, 9, 1797–1800, 2009.)
Seidi et al.19 studied how concentration gradients of 6-hydroxydopamine (6-OHDA) triggered neuronal apoptosis in a pheochromocytoma PC12 neuronal cell line. Mimicking apoptotic cell death as it occurs in Parkinson’s disease (PD) in an in vitro model is important for developing therapeutic antiapoptotic drugs for treating PD. Such drugs can keep the disease from progressing. The goal of high-throughput screening using such a device is to create an in vitro system that achieves the highest rate of apoptosis and the minimum rate of necrosis. The concentration gradient was achieved by passively pumping a small volume of toxin through the inlet of the microchannel. The outlet drop was then aspirated in order to stop flow from the inlet to the outlet. A drop of buffer solution was placed in the outlet, reversing flow from the outlet to the inlet. Liquid was aspirated from the inlet in order to stop flow from the outlet. Both ports are sealed to prevent evaporation and flow (Figure 9.18).
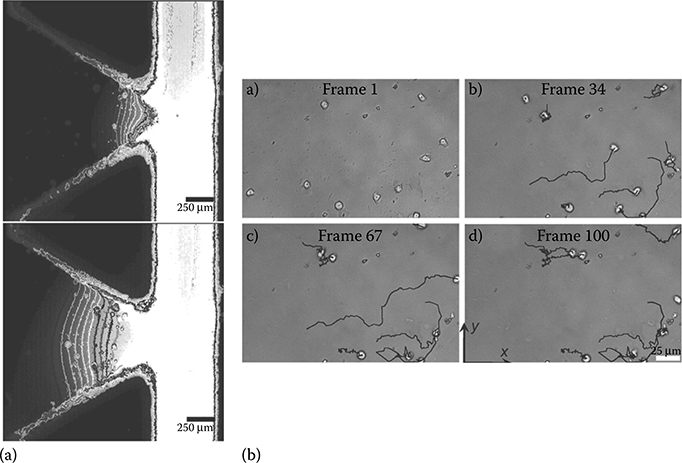
FIGURE 9.17 (a) Fluorescein concentration gradient observed after 5 and 10 min, top and bottom respectively. (b) Neutrophil migration up the concentration gradient at different time steps. (From Kim, D., Lokuta, M., Huttenlocher, A., and Beebe, D.J., Lab Chip, 9, 1797–1800, 2009.)
Live/dead staining of PC12 cells cultured over 24 h in microfluidic devices containing 6-OHDA gradients showed higher cell death at higher toxin concentrations within the channel (Figure 9.19). Low concentrations of 6-OHDA (<260 μM) along the gradient resulted in neuronal death mainly induced by apoptosis, while higher concentrations of 6-OHDA resulted in neuronal death mainly induced by necrosis. The maximum percentage of apoptotic cells was achieved at toxin concentrations of less than 300 μM. Toxin concentrations greater than 300 μM resulted in a higher percentage of necrotic events and a decline in the percentage of apoptotic cells.
Hancock et al.20 used surface tension phenomena in a different way to create flow and make a concentration gradient. They generated centimeters-long gradients of molecules and particles in less than 1 s by using a fluid stripe held in place on a glass slide by a hydrophobic boundary (Figure 9.20). Interestingly, this is not tubeless microfluidics but rather channel-less microfluidics. Gradients produced on the stripe are created in open air on a glass slide and are accessible for later processing and analysis. The flow analysis for this type of system is different from that of surface tension passive pumping as described by Beebe7 and different from that of surface tension–evaporation coupled flow as described by Dandy11,12 (Figure 9.21).

FIGURE 9.18 Microfluidic-based neurotoxin concentration gradient for the generation of an in vitro model of PD. (From Seidi, A., Kaji, H., Annabi, N., Ostrovidov, S., Ramalingam, M., and Khademhosseini, A., Biomicrofluidics, 5, 022214, 2011.)
9.6 Backflow Mechanisms
Microscale forces, such as surface tension and evaporation, can be used as an advantage to perform interesting microfluidic experiments. Evaporation has been mostly used to create flow opposite the direction of surface tension forces and to create concentration gradients and sample concentrations. Another microfluidic phenomenon of interest to researchers dealing with surface tension flow is the appearance of a backward-flow mechanism that cannot be explained by evaporation.
In their work, Walker et al.,7 Lynn et al.,12 and Du et al.13 have used evaporation to their advantage to perform a given set of experiments. However, Zhu et al.10 saw evaporation-induced backward flow play an unsolicited role in their results while investigating virus spread inside a passive pumping channel. The bias in their results was not critical; however, its very existence makes it important to understand any mechanism that can cause backflow in tubeless microfluidic devices.
To this end, Ju et al.21,22 explained a nonevaporation backward-flow mechanism occurring in passive pumping devices. By ruling out evaporation and surface tension-based inertial interactions, they discovered that rotational flow inside the outlet drop may be a source of inertia that can explain the generation of the backward flow (Figure 9.22a), and outline inlet/outlet volume ratios to prevent the occurrence of the outlet flow (Figure 9.22b). This type of backflow mechanism occurs on a time scale of tens of seconds.

FIGURE 9.19 Microfluidic devices containing 6-OHDA gradients show higher cell death at higher toxin concentrations within the channel. (From Seidi, A., Kaji, H., Annabi, N., Ostrovidov, S., Ramalingam, M., and Khademhosseini, A., Biomicrofluidics, 5, 022214, 2011.)

FIGURE 9.20 Generation of surface-tension-driven gradient in a fluid stripe held in place by a hydrophobic surrounding. (From Hancock, M., He, J., Mano, J., and Khademhosseini, A., Small, 7, 892–901, 2011.)
Besides evaporation and rotational force at the outlet drop, at least one more backflow mechanism has been discovered. In their work, Resto et al.23 observed an inertia-based backflow mechanism (Figure 9.23). Unlike the previous mechanisms, this inertia-based backflow occurs in a time scale of milliseconds. This type of back-flow is likely caused by the interplay of inertia–surface tension interactions at the inlet drop.
The setup of Resto et al. consisted of using automated micronozzles (nozzle diameter 254 μm) to eject droplets to the inlet port of a passive pumping microfluidic device (Figure 9.24). There is evidence that the inertia imparted by the ejected droplets on the liquid in the inlet port is nonnegligible. When a droplet hits the inlet port of the device, it immediately collapses. Collapse was observed to occur in approximately 30 ms with their setup.23 Within these experimental conditions, the drop at the inlet port is seen to rebound immediately after it has finished collapsing (Figure 9.23b). This rebound can be a return-to-equilibrium movement by the inlet drop after the inertia present in the incoming droplet causes the standing liquid at the inlet to overshoot a natural surface tension-dictated equilibrium position.

FIGURE 9.21 (a) Consecutive frames of dye flowing across a fluid stripe. (b) Schematic and experimental parameters involved in fluid stripe gradient generation. (From Hancock, M., He, J., Mano, J., and Khademhosseini, A., Small, 7, 892–901, 2011.)
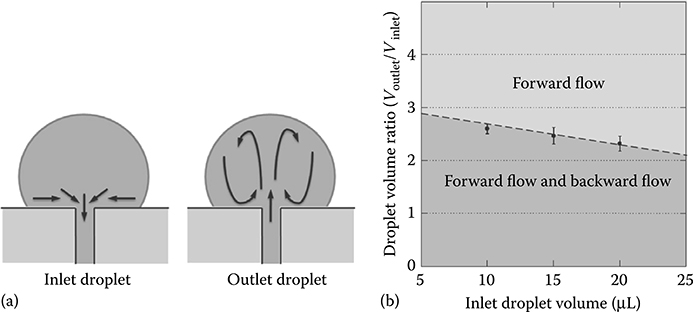
FIGURE 9.22 (a) Rotational flow in the outlet drop. (b) Volume ratios of the two drops should be in the light gray area to prevent backflow. (From Ju, J., Park, J.Y., Kim, K.C., Kim, H., Berthier, E., Beebe, D.J., and Lee, S., J. Micromech. Microeng., 18, 087002, 2008.)
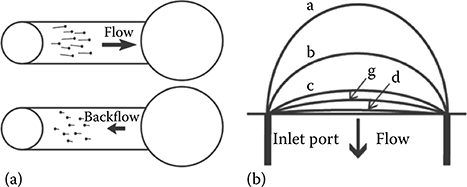
FIGURE 9.23 (a) Backflow observed in red fluorescent beads while they are flowing in a passive pumping channel. (b) Backflow is predicted to be due to inertia–surface tension interactions at the inlet drop. (From Resto, P.J., Mogen, B.J., Berthier, E., and Williams, J.C., Lab Chip, 10, 23–26, 2010.)
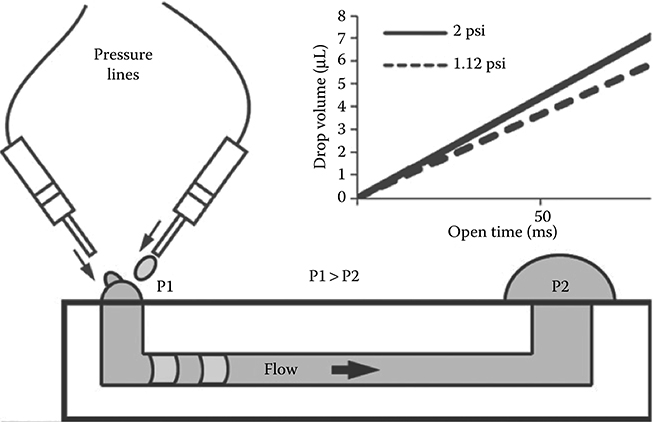
FIGURE 9.24 Microfluidic setup used by Resto et al.23 (From Resto, P.J., Mogen, B.J., Berthier, E., and Williams, J.C., Lab Chip, 10, 23–26, 2010.)
9.7 High Throughput
Fluid flow in microchannels is used to treat and wash samples for different types of experiments. An advantage of tubeless microfluidic devices is that they can be used for high-throughput applications, most of which currently use standard wells for performing assays. Therefore, an important component of analyzing tubeless microfluidic devices is to understand fluidic wash inside them. In their 2007 work, Warrick et al.24 analyzed fluidic exchange inside a passive pumping microchannel. They described a linear relationship between intrachannel concentration and the volume of an incoming fluid. One of their relevant conclusions is that it takes five times the channel volume to exchange 95% of the intrachannel liquid (Figure 9.25). They also proposed a treat-wait-treat method for more efficient channel washout, as there are convection and diffusion components to channel washout.

FIGURE 9.25 Fluidic wash inside passive pumping microfluidic devices. (a) Use of fluorescent beads to study washout. (b) Use of food coloring to study washout. (From Warrick, J., Meyvantsson, I., Ju, J., and Beebe, D.J., Lab Chip, 7, 316–321, 2007.)
Taking advantage of the simplicity and control of passive pumping, Meyvantsson et al.25 applied the principles of passive pumping for mammalian cell culture. The authors developed an array of 192 microfluidic channels, each with two access ports, to mimic the microtiter plate standard array (Figure 9.26). They demonstrated the utility of such an array used with an automated liquid handler (ALH) to culture 3T3 cells in passive pumping channels over 5 days with medium changes every 24 h (Figure 9.26).

FIGURE 9.26 Microfluidic array composed of 192 independent microfluidic devices. Insert: 3T3 cells cultured in passive pumping channels over a period of 5 days. (From Meyvantsson, I., Warrick, J., Hayes, S., Skoien, A., and Beebe, D.J., Lab Chip, 8, 717–724, 2008.)
Meyvantsson et al.25 showed that passive pumping retains the benefits of laminar flow embodied by microfluidic devices in general. They were able to pattern cells while maintaining fine fluid control inside the device (Figure 9.27). Figure 9.27a and b shows mouse mammary epithelial cells cultured in an eight-channel passive pumping device. They used an eight-channel pipette to simultaneously deliver a drop to each inlet port and maintain an even laminar boundary between the liquid from each inlet. Figure 9.27c and d shows fibroblasts (Hs578Bst) and epithelial cells (HMT-3522 S1) patterned in a three-dimensional (3D) 1rECM gel matrix. Figure 9.27e shows MCF10A patterned in the 3D 1rECM gel. Overall, the techniques outlined in their work show that passive pumping in conjunction with an ALH is capable of performing long-term cell culture. This opens the door for the use of passive pumping in high-throughput biological applications and applications that need cell culture over long periods.
Puccinelli et al.26 continued this line of work and expanded on the opportunity of using passive pumping for high-throughput assay screening. The authors used an array of passive pumping devices and an ALH to perform In-Cell Western (ICW) assays (Figure 9.28). Their aim was to validate the tubeless microfluidic platform for performing complete cell-based biological assays reliably and repeatedly, from culture to analysis, using automated liquid handling and automated analysis, and develop step-by-step protocols to mimic traditional cell culture by using an ALH (Figure 9.29).
Paguirigan et al.27 further validated passive pumping devices for use in ICW assays. This time the authors validated high-throughput ICW assays using passive pumping by comparing it directly with macroscale methods. They used transforming growth factor-β-induced epithelial-to-mesenchymal transition of an epithelial cell line as an example to validate the technique as a readout for soluble factor–based assays performed in high-throughput microfluidic channels.
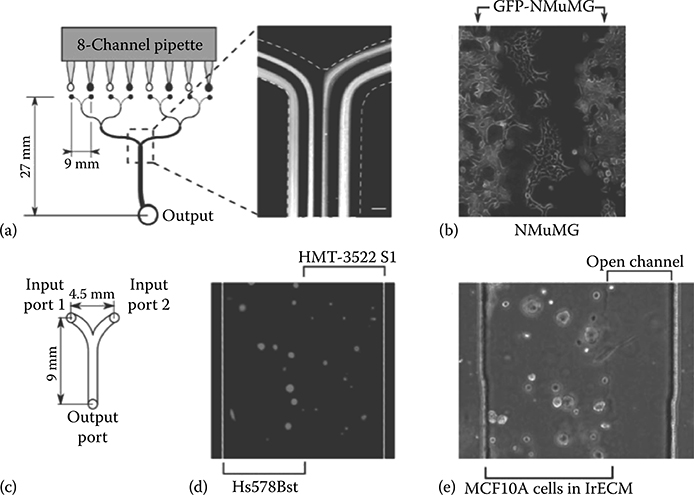
FIGURE 9.27 (a,b) Mouse mammary epithelial cells cultured in an eight-channel passive pumping device. (c,d) Fibroblasts (Hs578Bst) and epithelial cells (HMT-3522 S1) patterned in a 3D 1rECM gel matrix. (e) MCF10A patterned in the 3D 1rECM gel. (From Meyvantsson, I., Warrick, J., Hayes, S., Skoien, A., and Beebe, D.J., Lab Chip, 8, 717–724, 2008.)
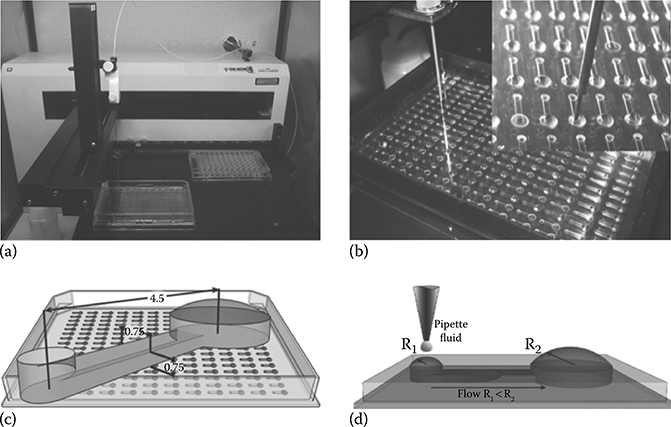
FIGURE 9.28 Passive pumping devices and an ALH used to perform ICW assays. (From Puccinelli, J.P., Su, X., and Beebe, D.J., J. Assoc. Lab. Autom., 15, 25–32, 2010.)

FIGURE 9.29 Step-by-step protocol of robotic manipulations developed by Puccinelli et al.26 for performing complete cell-based biological assays. AG, air gap; EV, extra volume; n, number of channels; CM, culture medium; PBS, phosphate-buffered saline; PFA, paraformaldehyde; BB, blocking buffer; DMSO, dimethyl sulfoxide; 1°Ab, primary antibody; 2°Ab, secondary antibody; DCV, dispense channel volume; ACV, aspirate channel volume; *Step 2 and 3 as listed, step 1 was identical to TO-PRO-3. (From Puccinelli, J.P., Su, X., and Beebe, D.J., J. Assoc. Lab. Autom., 15, 25–32, 2010.)
Resto et al.23 developed a simplified version of an ALH by using an automated micronozzle system to deliver small droplets to the inlet of a passive pumping device (Figure 9.24). Theory states that the smaller the drops, the higher their internal pressure. Therefore, high flow rates and fast fluidic exchanges are performed by delivering small droplets at a high frequency to the inlet of a microfluidic device (Figure 9.30).
Another clever example of passive pumping for automated cell manipulation was demonstrated by Ju et al. in their work using passive pumping in cell programmable assay (CPA) chips.28 The authors created CPA chips for culturing cells and automating the process of staining using surface tension passive pumping (Figure 9.31). The system was tested using human embryonic kidney (HEK) 293 cells. The rationale for this work was that interfacing robotics and culture control systems require equipment or methods that can make regular use of the device in small biology laboratories challenging. Therefore, they developed these chips to increase the throughput of common laboratory procedures without requiring the machines and equipment needed for most high-throughput approaches—for example, the high-throughput method proposed by Puccinelli et al. using ALHs.

FIGURE 9.30 High-speed fluid exchange inside an open microfluidic device using an automated micronozzle droplet delivery system. (From Resto, P.J., Mogen, B.J., Berthier, E., and Williams, J.C., Lab Chip, 10, 23–26, 2010.)
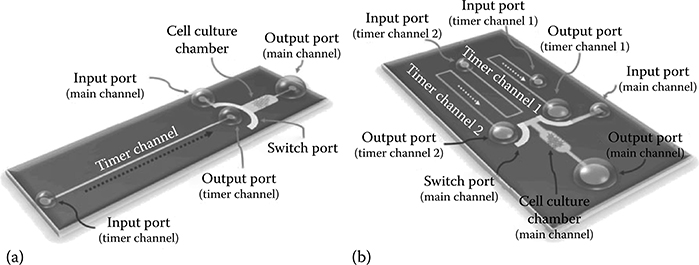
FIGURE 9.31 (a) Single timer channel CPA (sCPA). (b) Dual timer channel CPA (dCPA). (From Ju, J., Warrick, J., and Beebe, D.J., Lab Chip, 10, 2071–2076, 2010.)
Seidi et al.19 in their work on creating an in vitro model for PD, took advantage of the high-throughput potential of passive pumping. High-throughput screening assays allow researchers to conduct a large number of tests for screening the efficacy of drug concentrations on cells. Passive pumping allowed Seidi et al. to duplicate experiments typically performed in multiwell plates without the high cost of such assays.
Su et al.29 took advantage of the high-throughput capabilities of passive pumping devices to investigate the growth and culturing properties of HEK cells transfected with hERG channel protein for the development of a high-throughput platform for screening the cardiac toxicity of drug compounds. The authors performed different biological cell assays and procedures, including traditional western blots and live-cell westerns, to make sure the microchannels were a viable culturing environment for hERG-expressing cells. Patch-clamping experiments were then performed on the microchannel-cultured cells to verify that the hERG ion channels were functioning normally. After the system was validated as a growth environment, the hERG-expressing cells were treated with various drugs to determine the suitability of microchannels for drug toxicity testing. Results show that microfluidic screening is useful and that polystyrene (PS) and cyclo-olefin polymer (COP) microchannels are more appropriate than PDMS devices as they do not absorb small hydrophobic drug molecules. Passive pumping shows its usefulness in eliminating the need for external pumps and tubing and allowing the use of existing biology laboratory equipment for analysis.
9.8 Passive Washing and Logic Circuitry
A major use of microfluidic devices is to observe and analyze the effect of the micro-environment on cells and in many cases apply and wash away multiple reagents over a period of time. Warrick et al.24 studied the washing efficiency of passive pumping microchannels and concluded that introducing five times the channel volume will exchange 95% of the original liquid. Meyvantsson et al.25 kept a consistent laminar boundary layer between adjacent streams of liquid inside a multi-inlet microchannel by using an eight-channel pipette to deliver drops to the inlet simultaneously.
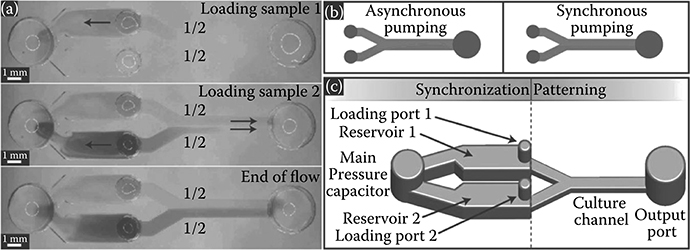
FIGURE 9.32 (a) Loading samples using LFP. (b) Asynchronous versus synchronous pumping in a Y-channel. (c) Fluidic capacitor that enables LFP with passive pumping. (From Berthier, E., Warrick, J., Casavant, B., and Beebe, D.J., Lab Chip, 11, 2060, 2011.)
Berthier et al.30 simplified the maintenance of a consistent laminar pattern within tubeless devices by developing a short-term laminar flow patterning (LFP) technique for multiple liquids using a single pipette (Figure 9.32). LFP allows two or more different solutions to flow side-by-side in a channel without convective mixing. The technique can be used to pattern cells and carry out treatments and has the potential to be used for creating chemical gradients. LFP is possible in systems that are able to deliver precise and controllable flow rates through two or more inputs. Passive pumping is capable of performing LFP as long as droplets of identical volumes can be delivered to two or more inlets at exactly the same time, which would require ALHs or other forms of precise liquid ejection systems—for example, a multichannel pipette.
Asynchronous flow in a Y-channel using passive pumping results when there is a difference in the fluid driving pressure at the inlet, due to differences in either the droplet volume or delivery time to the inlet (Figure 9.32b). To prevent asynchronous pumping, Berthier et al.30 developed a fluidic capacitor designed to allow LFP with passive pumping using nothing more than a manual pipette. The design uses a “synchronization component” that acts as an intermediate storage location for sample fluid and as a single pressure source (Figure 9.32c). The system controls LFP through the channel by allowing liquid placed at each inlet to first rush into the capacitor, creating equal pressures at each inlet; thus, liquid moving through each individual Y-branch has the same driving pressure.
Kim et al.31 devised a different approach for passive washing using tubeless devices. In their work, they combine passive pumping and a washing valve used as a fluidic regulator to control the merging of two solutions (Figure 9.33a). Essentially, they fill two channels. One is a fluidic resistor; the other is a reaction chamber. The channels are separated by a small constriction. Each channel is filled with a different solution. Eventually the two solutions will meet at the constriction and make contact. When this contact happens, fluid from the fluidic resistor will rush into the reaction chamber, thus washing away the standing liquid (Figure 9.33b).

FIGURE 9.33 (a) Schematic of passive washing microfluidic device. (b) Solution washing occurs after contact by two liquids opposing the constriction. (From Kim, B., Kim, S., Yang, S., and Yang, H., J. Micromech. Microeng., 17, N22–N29, 2007.)

FIGURE 9.34 (a,b) Microfluidic inverter. (c,d) NOR gates. (e–g) AND gates. (From Toepke, M., Abhyankar, V., and Beebe, D.J., Lab Chip, 7, 1449–1453, 2007.)
Microfluidic devices are analogous to electrical circuitry. The simplest example is the fluidic resistance inherent to microfluidic devices. Another case is the fluidic capacitor developed by Berthier et al.30 Toepke et al.32 went a step further and created microfluidic components analogous to electronic circuit components. This allows passive pumping to be used in multistep, programmable biological protocols without adding complexity to the manufacturing process while limiting the dependence on external equipment.
In microfluidics, fluidic resistance is analogous to electrical resistance, fluid flow is analogous to electrical current, and the pressure differential across a channel is analogous to voltage. Changing the dimensions of a device controls the fluidic resistance. In passive pumping, the pressure differential (i.e., voltage) is controlled by the volume of the drops placed at the inlet and the outlet. Using these concepts, the authors created three classes of logic components: OR/AND, NOR/NAND, and XNOR digital microfluidic gates (Figure 9.34). A programmable timer is constructed by using a high-resistance channel to provide slow flow, acting as a timer, and a second channel to pump the timer output droplet once its volume has achieved a critical size. A slow, perfusion rheostat can be created by using multiple inlet ports with high-resistance channels. This last scheme allows control over the flow rates during passive pumping.
9.9 Biology
Passive pumping in microfluidics is most commonly used for the study of biological systems. The majority of research in this area aims to control, manipulate, and study the environment of small living things. Meyvantsson et al.25 showed it is possible to perform cell culture in passive pumping channels. Puccinelli et al.26 followed this line of work by using an ALH to create cell-handling protocols and demonstrated their work by performing high-throughput ICW assays. Du et al.13 used passive pumping coupled with evaporation backflow to create a concentration gradient of a cardiac toxin, alpha-cypermethrin, along the microchannel to test the response of HL-1 cardiac cells in the microdevice. Kim et al.16 made a chemotaxis device that used passive pumping to load a source channel and allow diffusion to create a concentration gradient toward a sink channel. Domenech et al.33 used passive pumping to load cells into microchannels for studying soluble factor signaling. In cancer and other diseases, paracrine signaling is implicated in disease pathogenesis.34
Khnouf et al.35,36 used passive pumping for high-throughput protein expression. A passive pumping device was filled with the protein expression solution. Nutrient solution was then pumped from the inlet to the outlet of the device, where the reaction takes place. A 5 μL volume from the outlet drop was then mixed with 35 μL of lucif-erase assay reagent in an individual well of a 384-well microplate. The luminescence signal from the well was correlated with the amount of luciferase present. The method of protein expression in a passive pumping channel was compared with the same method of protein expression in a microcentrifuge tube. The authors concluded that protein expression using nutrient solution in the microfluidic device is slightly higher than that produced by the same experiment in a microcentrifuge tube (Figure 9.35). Protein expression in both scenarios using nutrient solution is much higher than protein expression in a microcentrifuge tube without the use of nutrient solution.
Protein expression yield is a function of the amount of nutrient solution and not the amount of expression solution used in the experiment (Figure 9.36). Use of passive pumping is advantageous as it allows simultaneous production of the same protein under different experimental conditions, simultaneous production of different proteins for high-throughput, high-yield protein expression, and low reagent cost since it consumes a fraction of the reagents used in a commercially available protein expression instrument.
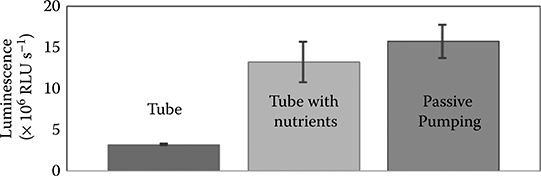
FIGURE 9.35 Amount of protein synthesized between expression in a microcentrifuge tube with and without nutrient solution and in a passive pumping device. (From Khnouf, R., Beebe, D.J., and Fan, Z.H., in Proceedings of the 12th International Conference on Miniaturized Systems for Chemistry and Life Sciences, pp. 1740–1742, 12–16 October, San Diego, CA, 2008.)
Zhu et al.10 performed flow-enhanced infection assays in microchannels using passive pumping to inoculate cell monolayers with virus and drive infection spread. Under a lack of flow, virus infections spread locally throughout the microchannels. The experiments measured virus infection levels in terms of plaque-forming units (PFU) and showed higher viral gene expression for higher virus PFU per channel (Figure 9.37).

FIGURE 9.36 (a) Protein expression is a function of the amount of nutrient solution supplied. (b) Amount of reaction, in terms of luminescence, as a function of amount of expression solution used. (From Khnouf, R., Beebe, D.J., and Fan, Z.H., in Proceedings of the 12th International Conference on Miniaturized Systems for Chemistry and Life Sciences, pp. 1740–1742, 12–16 October, San Diego, CA, 2008.)
Under flow conditions, the extent of viral infection spread correlated with the volume of virus added (Figure 9.38b). Similar results are obtained when inocula containing from 300 to 3 million virus particles (i.e., 3 × 10² to 3 × 10⁶ PFU) are added; however, infection spread dropped when the inoculum contained only 30 PFU (Figure 9.38c), suggesting that an infection of anything greater than 300 PFU is enough to saturate the infection capacity of the microfluidic device. A backward spread of infection, opposing the direction of surface tension flow, was observed and blamed on backflow due to evaporation at the inlet port. Cell death decreased accordingly when flow-enhanced infections were treated with increasing levels of antiviral drug (Figure 9.38d). The infection assay using a microfluidic device required only 1/80 of the amount of drug needed in the current gold-standard plaque-reduction assay. Assay sensitivity based on drug concentrations that reduce infection by 50% indicated that the flow-enhanced infection assay was also twice as sensitive as the gold-standard plaque-reduction assay (Figure 9.38e).
Koepsel et al.37 used passive pumping to create a rapid method for self-assembled monolayer (SAM) cell culture substrates with a functionalized carboxylic acid end that covalently links to a cell adhesion peptide in order to create cell adhesive environments (Figure 9.39). The process uses passive pumping to drive liquid flow. Passive pumping allowed rapid liquid transport and rapid local substrate modification. Use of an array of microchannels allowed for control of local substrate modifications from channel to channel.
Echeverria et al.38 performed tumor cell migration assays in a 3D extracellular matrix (ECM) inside a passive pumping channel (Figure 9.40). The protocol involved filling the channel with ECM (Matrigel) via the inlet port. The matrix moves into the channel via capillary action. After the channel was filled, the devices were incubated at 37°C for 60 min to allow the matrix to gel. Tumor cells were then added to the output port and incubated for 5 days at 37°C and 5% CO2 (Figure 9.41). The medium was changed daily by replacing the medium at the output port. The fluid content inside the channel can be exchanged without disturbing the gel by using surface tension passive pumping. Experiments were then performed to study the effect of inhibitors on PC3-M cell invasion. Results show a decrease in the invasion distance for cells under inhibitor treatment. Overall, the paper demonstrated the use of a passive pumping device in extracting quantitative data on a compound’s effect on tumor cell migration through 3D collagen.
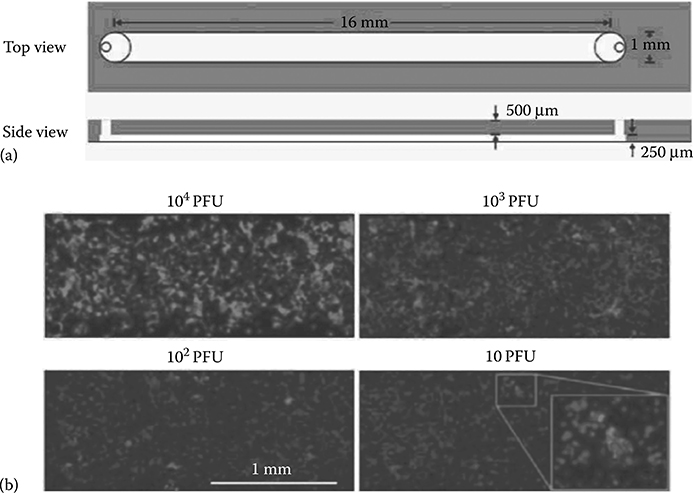
FIGURE 9.37 (a) Microfluidic channel used for cell culture and viral spread. (b) Stained virus (light gray) and stained cells (dark gray) as a function of number of plaque forming units (PFU) per channel. (From Zhu, Y., Warrick, J.W., Haubert, K., Beebe, D.J., and Yin, J., Biomed. Microdevices, 11, 565–570, 2009.)
Mohammed et al.39 developed a microfluidic brain slice device (μBSD) that integrates passive pumping technology with a standard brain slice perfusion chamber (RC-26GPL, Warner Instruments) in order to deliver fluid to regions within the brain slice perfusion chamber. They bonded the standard brain slice perfusion chamber to a custom-made PDMS microfluidic device having four independent channels, each of which uses passive pumping to drive flow (Figure 9.42). This applies microfabrication techniques and the advantages of microfluidic principles to commercially available, in vitro neurobiology equipment in order to perform microscale electro-physiology research. Caicedo et al.40 followed up this work with a simulation to characterize the flows through the μBSD by using multiphysics simulations of injections into a porous matrix and optimize the spacing of ports.
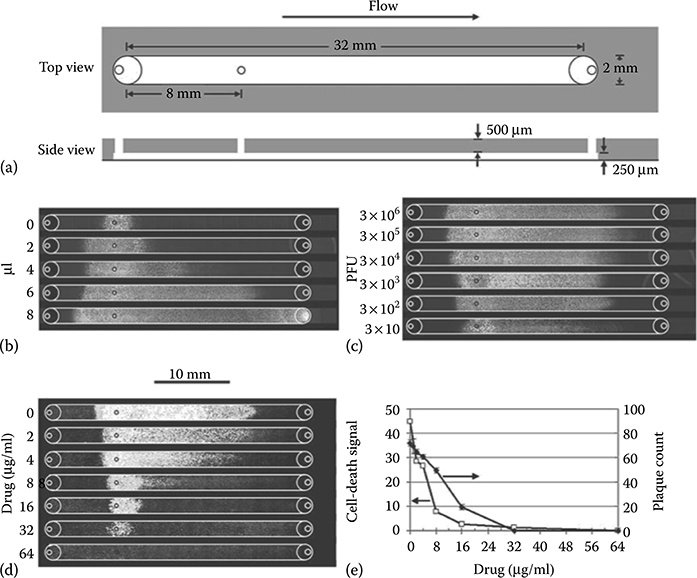
FIGURE 9.38 (a) Microfluidic channel used for cell culture and viral spread. (b) Viral infection spread correlated with the volume of virus added. (c) Infection of greater than 300 PFU is enough to saturate the infection capacity of the microfluidic device. (d) Cell death decreased accordingly when flow-enhanced infections were treated with increasing levels of antiviral drug. (From Zhu, Y., Warrick, J.W., Haubert, K., Beebe, D.J., and Yin, J., Biomed. Microdevices, 11, 565–570, 2009.)
Seidi et al.19 developed an in vitro model for PD using passive pumping. Their results show that low concentrations of 6-OHDA (<260 μM) along the gradient resulted in neuronal death mainly induced by apoptosis, while higher concentrations of 6-OHDA induced neuronal death mainly by necrosis (Figure 9.43). The maximum percentage of apoptotic cells was achieved at toxin concentrations of less than 300 μM. Toxin concentrations greater than 300 μM resulted in a higher percentage of necrotic events and a decline in the percentage of apoptotic cells. The accuracy of the gradient screening system was compared with a parallel experiment in a multi-well system. Using both systems, the highest rate of cellular apoptosis was achieved with a 6-OHDA concentration of ~260 μM. Given their low use of reagents and ability to create gradients, passive pumping gradient systems are useful in experiments for a range of drug screening applications.

FIGURE 9.39 Image result from the conjugation of functionalized fluorescein to a patterned SAM containing varied mol% of the functionalized alkanethiolate. (From Koepsel, J. and Murphy, W., Langmuir, 25, 12825–12834, 2009.)

FIGURE 9.40 Protocol for 3D tumor cell migration. (a) Passive pumping channels used for experiments. (b) Automated liquid handler for automated cell culture. (c) Channel is loaded with Matrigel through the inlet port. (d) Tumor cells are loaded through the outlet port. (e) Tumor cells migrating toward inlet port. (From Echeverria, V., Meyvantsson, I., Skoien, A., Worzella, T., Lamers, C., and Hayes, S., J. Biomol. Screen., 15, 1144–1151, 2010.)
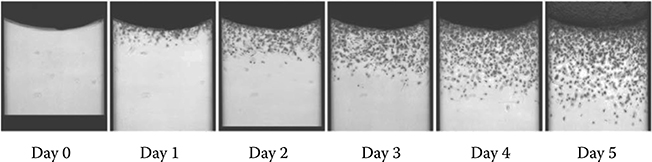
FIGURE 9.41 Tumor cells migrating from the output toward the input through the matrix over the course of 5 days. (From Echeverria, V., Meyvantsson, I., Skoien, A., Worzella, T., Lamers, C., and Hayes, S., J. Biomol. Screen., 15, 1144–1151, 2010.)

FIGURE 9.42 Microfluidic brain slice device (μBSD) integrates passive pumping technology with a standard brain slice perfusion chamber (RC-26GPL, Warner Instruments). (From Mohammed, J., Caicedo, H., Fall, C., and Eddington, D.T., Lab Chip, 8, 1048, 2008.)
Su et al.29 investigated the growth and culturing properties of HEK cells transfected with hERG channel protein. Their goal was to develop a high-throughput platform for screening the cardiac toxicity of drug compounds. Using passive pumping, they demonstrated microchannel cell culture, drug treatment, protein analysis, and immunostaining of normal and hERG-transfected HEK cells. Their results provided the groundwork for future microfluidic-based drug screening assays for hERG-related cardiotoxicity.
Sung et al.34 made an in vitro microfluidic model to study the transition of ductal carcinoma in situ (DCIS) to invasive ductal carcinoma (IDC). Use of a compartmentalized microchannel allowed seeding of epithelial cells next to stromal fibroblasts and the analysis of paracrine interaction as a function of distance; in other words, the authors were able to study interaction at and far from the interface. This is an added functionality not available in traditional coculture systems. This system is also compatible with existing high-throughput systems. The experiments utilize a Y-channel passive pumping device with two inlets and one outlet. The inlets are loaded simultaneously using a multipipette to ensure controlled loading of each type of cell to its respective side of the Y-channel. Alternatively, it would be possible to use the microfluidic capacitor developed by Berthier et al.30 A spacer gel and a channel with three and four inputs were used to study morphological changes via soluble factors by limiting contact between cells but still allowing diffusion of molecules. Results show morphological changes in mammary epithelial cells (MCF-DCIS) when human mammary fibroblasts (HMFs) were cultured some distance (0.5–1.5 mm) from the MCF-DCIS cells, suggesting interaction of soluble factors at the beginning of the transition from DCIS to IDC. Greater gap lengths with the spacer gel resulted in less cellular morphological changes. Cell–cell contact with HMFs allowed the MCF-DCIS cells to finally complete the transition to invasion.

FIGURE 9.43 (a) Cells stained to detect apoptosis and necrosis. (b) Ratio of apoptosis to necrosis as a function of higher concentrations of 6-OHDA, using passive pumping. (c) Ratio of apoptosis to necrosis as a function of higher concentrations of 6-OHDA, using a multi-well system. (From Seidi, A., Kaji, H., Annabi, N., Ostrovidov, S., Ramalingam, M., and Khademhosseini, A., Biomicrofluidics, 5, 022214, 2011.)
PDMS absorbs small hydrophobic molecules, leaches un-cross-linked oligomers into solution, and allows evaporation through the bulk material.25,33 For these reasons, PDMS has been shown to alter the biochemical microenvironment in cell cultures. This can bias results in biological experiments in in vitro experimentation. Young et al.41 used a streamlined hot-embossing process to create microfluidic devices out of PS, the most commonly used material for in vitro cell-based research (Figure 9.44).
9.10 Integrated Electrodes
Another approach to studying and manipulating cells in microfluidic devices is to integrate electrodes into the devices. This contrasts with biochemical analysis, which involves assaying and staining to obtain results from an experiment. Ju et al.42 used passive pumping as the fluid actuation mechanism for an cellular electrofusion chip (Figure 9.45). Cell fusion is an important cellular process that occurs during muscle and bone cell differentiation, during embryogenesis, and during morphogenesis. Studying fusion in vitro is important for understanding the properties of cells. The advantage of using passive pumping is that it allows for the slow delivery of cells without the need for an expensive pump, and it reduces dead volume.

FIGURE 9.44 Polystyrene (PS) microfluidic devices made with a hot-embossing process. (From Young, E.W.K., Berthier, E., Guckenberger, D.J., Sackmann, E., Lamers, C., Meyvantsson, I., Huttenlocher, A., and Beebe, D.J., Anal. Chem., 83, 1408–1417, 2011.)
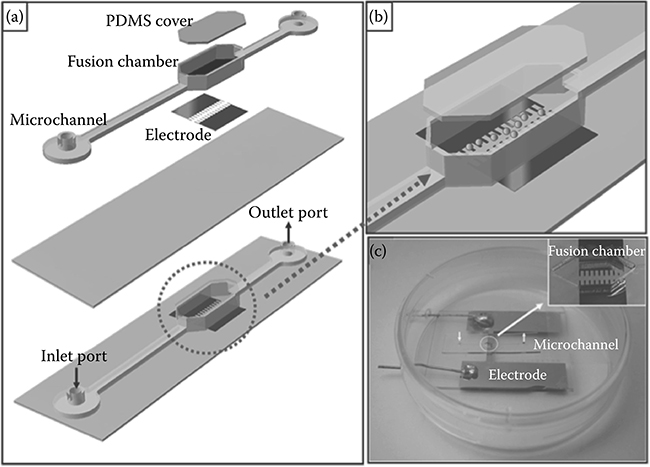
FIGURE 9.45 (a) Schematic of a 3D electrofusion chip used by Ju et al.42 (b) Region of cell fusion and integrated electrode. (c) Photograph of electrofusion chip. (From Ju, J., Ko, J.-M., Cha, H.-C., Park, J.Y., Im, C.-H., and Lee, S.-H., J. Micromech. Microeng., 19, 015004, 2009.)
The process involved filling the electrofusion chip with a hypertonic fusion solution using a micropipette. Then, 30 μL of hypertonic fusion solution was dropped into the outlet port while a mix of protoplasts and hypertonic solution was dropped into the inlet port. Passive pumping allowed the mixed protoplasts to flow into the microchannel. The flow is very slow in the fusion chamber, so an operator can monitor the movement of cells with a microscope. An ac field applied to the microelectrodes to form pearl chains between the electrodes was followed by a short, high-voltage dc pulse to fuse the cells. Finally, culture medium was flowed into the microchannel via the inlet port to wash away the hypertonic fusion solution.
The formation of the pearl chains depended on the pressure differential across the channel (Figure 9.46). A lower pressure differential between the inlet and outlet droplets allowed for better pearl chain formation. After electrofusion, fresh culture medium was flowed over the cells to provide nutrient to the fused cells. The delivery of the culture medium through passive pumping did not affect the fused cells, demonstrating the cell and medium transport capabilities of such a flow system. After electrofusion, the cells can be collected using a micropipette. Otherwise, passive pumping allows the fused cells to be cultured inside the microdevice just by replacing the cell medium.
Mohanty et al.43 used passive pumping as the flow actuation mechanism in an electrophoresis device for the injection and extraction of DNA (Figure 9.47). The use of passive pumping, along with simple microelectromechanical systems (MEMS) techniques, allows for a simple electrophoresis device suitable for research laboratories that operate on a budget.
Sample loading and extraction occurs via passive pumping (Figure 9.48). The first step is to fill the microelectrophoresis channel with separation buffer, Fluid A. A drop of sample, Fluid B, is placed in Port 1. This drop causes volume displacement into the separation channel that moves toward Port 2.
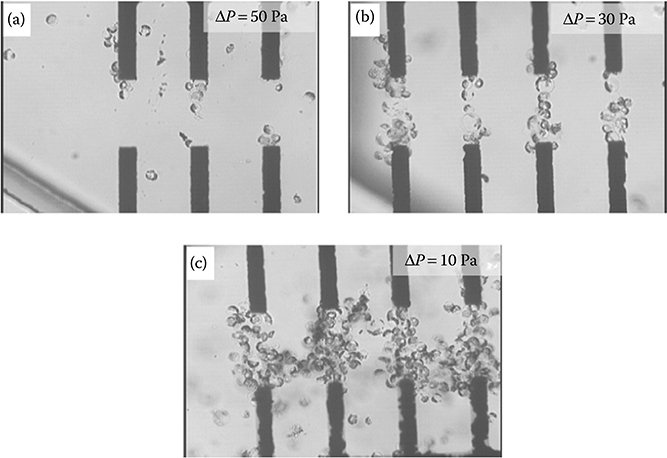
FIGURE 9.46 Formation of pearl chains as a function of the pressure differential (ΔP) across the microdevice. (a–c) Pearl chain formation at ΔP = 50, 30, and 10 Pa, respectively. (From Ju, J., Ko, J.-M., Cha, H.-C., Park, J.Y., Im, C.-H., and Lee, S.-H., J. Micromech. Microeng., 19, 015004, 2009.)
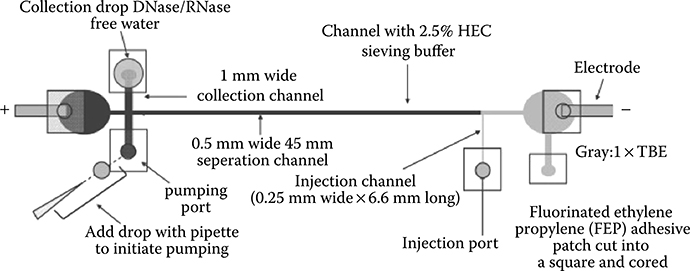
FIGURE 9.47 Device used for microcapillary electrophoresis. (From Mohanty, S.K., Warrick, J., Gorski, J., and Beebe, D.J., Electrophoresis, 30, 1470–1481, 2009.)

FIGURE 9.48 Sample loading into a microelectrophoresis device. (a) DNA is loaded into Port 1 and flows toward Port 2. (b) A electric field is applied driving the DNA down the separation channel. (From Mohanty, S.K., Warrick, J., Gorski, J., and Beebe, D.J., Electrophoresis, 30, 1470–1481, 2009.)
An electric field is applied to the sample that causes the sample to move down the separation channel (Figure 9.49). A band of sample DNA forms after some travel through the separation channel (Figure 9.49f). Passive pumping is again used to collect the sample DNA band (Figure 9.50). When the DNA band reaches the collection channel, a large drop is placed at collection Port 2 and a small drop at collection Port 1. Passive pumping is used to move the DNA band into collection Port 2. After flowing the sample DNA band into collection Port 2, a micropipette is used to remove the sample off the chip. The authors report a DNA capture efficiency of between 77% and 85% depending on the separation channel dimensions used.
Chen et al.44 studied passive pumping flow by measuring changes in chronoamperometric current using an electrochemical detector (Figure 9.51). The authors measured flow rate as a function of viscosity, as a function of the pressure difference between the inlet and the outlet generated by surface tension, and as a function of the gravity exerted by the height difference between the inlet and the outlet. Results show that flow rate increases as viscosity decreases, flow rate increases as the pressure gradient increases, and flow rate increases as the pressure generated by the height difference between the inlet and the outlet increases.

FIGURE 9.49 (a) Empty T junction, with the image taken before the DNA sample arrived. (b) DNA begins to fill the separation chamber. (c) Sample moves toward Port 2 (to the right). (d) An applied electric field causes the DNA to move down the separation channel. (e) Sample as it stacks while moving down the separation channel. (f) Band of DNA forms. (From Mohanty, S.K., Warrick, J., Gorski, J., and Beebe, D.J., Electrophoresis, 30, 1470–1481, 2009.)
To the best of our knowledge, this paper by Chen et al.44 has been the only one to mention electrical measurement of the change in current as a function of the liquid exchange between two solutions. The authors exchanged the background electrolyte for a solution of 2 μL of hexacyanoferrate(II) solution at different concentrations (Figure 9.52). Results show a linear relationship between current measurements and the addition of the hexacyanoferrate(II) solution. Hence, a electrochemical sensor inside a passive pumping device can be used to detect the real-time fluidic exchange between a resting liquid and an incoming liquid.

FIGURE 9.50 Sample collection. (a) DNA band migrating toward the collection channel. (b) Passive pumping used to move the DNA toward collection Port 2. (c) DNA band ready for collection. (From Mohanty, S.K., Warrick, J., Gorski, J., and Beebe, D.J., Electrophoresis, 30, 1470–1481, 2009.)
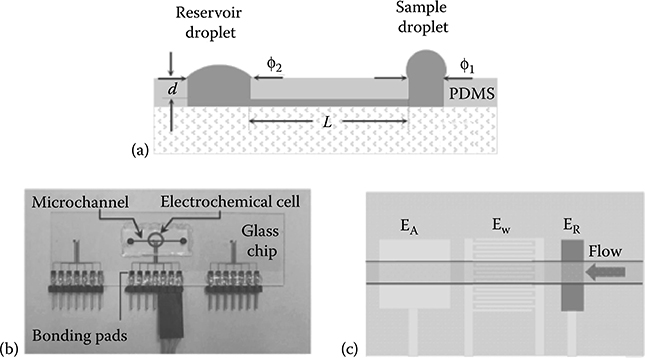
FIGURE 9.51 Electrochemical detector inside the passive pumping device. (From Chen, I. and Lindner, E., Anal. Chem., 81, 9955–9960, 2009.)
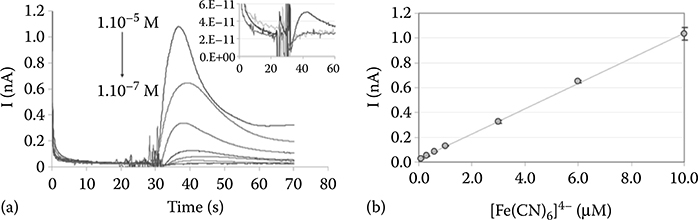
FIGURE 9.52 (a) Current–time measurements recorded with the passive-pump-driven device following the introduction of 2 μL drops of hexacyanoferrate(II) at different concentrations. (b) Correlation between the peak currents and the injected sample concentration. (From Chen, I. and Lindner, E., Anal. Chem., 81, 9955–9960, 2009.)
Another unique application of passive pumping was the conversion of a passive pumping device into a Coulter counter. A Coulter counter is an apparatus for counting and sizing particles. A microfluidic Coulter counter is appealing because it would bring the benefits of microfluidics to an already popular technique. These benefits include reduced sample volume, simplified operation, high throughput, portability, and low unit cost. Many biomedical applications would benefit from such a microfluidic particle counter. In their work, McPherson et al.45 developed such a counter, using passive pumping as the actuation mechanism for a Coulter counter device (Figure 9.53). They used hydrodynamic focusing to align the particles and maximize counting efficiency. Their results show that a microfluidic particle counter based on passive pumping is as effective as one based on a syringe pump.
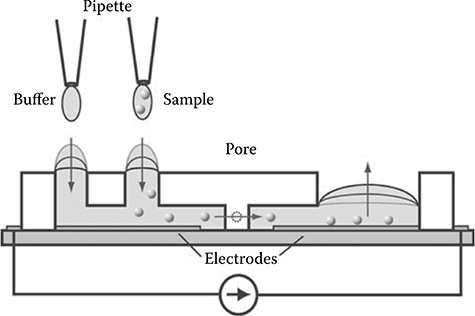
FIGURE 9.53 Passive pumping particle counter. (From Mcpherson, A. and Walker, G., Microfluid. Nanofluid., 9, 897–904, 2010.)
9.11 Other Types of Tubeless Devices
The Wheeler laboratory at the University of Toronto developed a different type of tubeless device. Their design used a digital microfluidic setup to manipulate nanoliter-sized droplets on an open surface that contains an array of electrodes46 (Figure 9.54). The authors used this system to carry out complete mammalian cell culture and obtain dose–response toxicity data for cells suspended in 150 nL droplets. Cells are seeded and grown on the digital microfluidic device by using an ECM protein coating on adhesion pads where the cells grow. Medium is exchanged by driving a droplet of new medium across the adhesion pad, thereby exchanging a portion of the old medium for new medium. Cell passaging is done by driving a droplet of trypsin over the cells, detaching the cells from the adhesion pads, and moving the suspended cells to a different adhesion pad on the electrode surface. This type of system allows for automated in vitro cell culture and assaying.
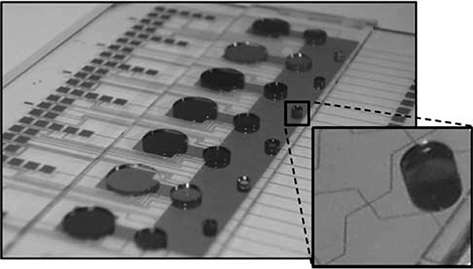
FIGURE 9.54 Digital microfluidic system for automated mammalian cell culture. (From Barbulovic-Nad, I., Au, S., and Wheeler, A.R., Lab Chip, 10, 1536–1542, 2010.)

FIGURE 9.55 Microfluidic channels made by SU-8 superhydrophobic nanocomposite. (From Hong, L. and Pan, T., Microfluid. Nanofluid., 10, 991–997, 2011.)
Other laboratories have developed surface microfluidic devices by using hydro-phobicity to contain liquid in a channel. Hancock et al.20 created a surface microfluidic stripe held in place on a glass slide by a hydrophobic boundary (Figure 9.20). They used this type of surface tension flow to generate centimeters-long gradients of molecules and particles (Figure 9.20).
Pan et al. developed another way of making surface microfluidic devices. In their works, the authors created microfluidic channels by containing liquid in hydrophilic channels surrounded by a superhydrophobic substrate. In one case, the superhydrophobic substrate was created by coating SU-8 with a photopatternable superhydrophobic nanocomposite (PSN)47,48 (Figure 9.55). The PSN was composed of inert polytetrafluoroethylene (PTFE) nanoparticles in the SU-8 matrix. In another case, superhydrophobic surface layers were formed by creating high-density nanofibrous structures on a PDMS matrix using a CO2 laser. The combination of nanostructures and the molecular properties of the laser-treated PDMS surfaces results in surface superhydrophobicity.49 Among other proposed uses, the authors showed the usability of this technology by performing surface tension passive pumping on a channel-less device.
The analogous flow rate equation based on inlet drop height is given by (4γH/H2 + r2) − P0 = (3μl/wh3 2)(H2 + r2)(dH/dt). When a superhydrophobic surrounding is used, the Laplace pressure inside a droplet sitting in a hydrophilic circle is dictated by ΔP = 2γC = (4hγ/r2 + h2), where h is the droplet height, r is the radius of the circular boundary, and γ is the surface tension.
The droplet with higher internal pressure will flow down the pressure gradient until the pressure drop across the channel is leveled. Unlike with surface tension passive pumping, the droplet with higher internal pressure using the current superhydrophobic scheme is not always coincident with a smaller liquid volume. Because of this, it is possible to create bidirectional flow by changing the volume of the droplets placed at different ends of the microchannels. Although not obvious, bidirectional flow is also possible with surface tension passive pumping, as described by Walker et al.,4 by adding a larger droplet at the receiving end.
References
1. D. J. Beebe, G. Mensing and G. Walker, Physics and applications of microfluidics in biology. Annu. Rev. Biomed. Eng., 4, 261–286, 2002.
2. C. H. Ahn, J. Choi, G. Beaucage, J. H. Nevin, J. Lee, A. Puntambekar and J. Y. Lee, Disposible smart lab on a chip for point-of-care diagnostics. Proc. IEEE, 92(1), 154–173, 2004.
3. D. Laser and J. Santiago, A review of micropumps. J. Micromech. Microeng., 14, R35–R64, 2004.
4. G. Walker and D. J. Beebe, A passive pumping method for microfluidic devices. Lab Chip, 2, 131–134, 2002.
5. E. Berthier and D. J. Beebe, Flow rate analysis of a surface tension driven passive micro-pump. Lab Chip, 7, 1475–1478, 2007.
6. I. Chen, E. Eckstein and E. Lindner, Computation of transient flow rates in passive pumping microfluidic systems. Lab Chip, 9, 107–114, 2009.
7. G. M. Walker and D. J. Beebe, An evaporation-based microfluidic sample concentration method. Lab Chip, 2, 57–61, 2002.
8. E. Berthier, J. Warrick, H. Yu and D. J. Beebe, Managing evaporation for more robust microscale assays, Part 1: Volume loss in high throughput assays. Lab Chip, 8, 852–859, 2008.
9. E. Berthier, J. Warrick, H. Yu and D. J. Beebe, Managing evaporation for more robust microscale assays. Part 2: Characterization of convection and diffusion for cell biology. Lab Chip, 8, 860–864, 2008.
10. Y. Zhu, J. W. Warrick, K. Haubert, D. J. Beebe and J. Yin, Infection on a chip: A microscale platform for simple and sensitive cell-based virus assays. Biomed. Microdevices, 11(3), 565–570, 2009.
11. N. S. Lynn, C. Henry and D. Dandy, Evaporation from microreservoirs. Lab Chip, 9, 1780–1788, 2009.
12. N. S. Lynn and D. Dandy, Passive microfluidic pumping using coupled capillary/evaporation effects. Lab Chip, 9, 3422–3429, 2009.
13. Y. Du, J. Shim, M. Vidula, M. Hancock, E. Lo, B. Chung, J. Borenstein, M. Khabiry, D. Cropek and A. Khademhosseini, Rapid generation of spatially and temporally controllable long range concentration gradients in a microfluidic device. Lab Chip, 9, 761–767, 2009.
14. J. Warrick, B. Casavant, M. Frisk and D. J. Beebe, A microfluidic cell concentrator. Anal. Chem., 82, 8320–8326, 2010.
15. B. Chung and J. Choo, Microfluidic gradient platforms for controlling cellular behavior. Electrophoresis, 31, 3014–3027, 2010.
16. D. Kim, M. Lokuta, A. Huttenlocher and D. J. Beebe, Selective and tunable gradient device for cell culture and chemotaxis study. Lab Chip, 9(12), 1797–1800, 2009.
17. D. Kim and D. J. Beebe, Interfacial formation of porous membranes with poly(ethylene glycol) in a microfluidic environment. J. Appl. Polym. Sci., 110, 1581–1589, 2008.
18. V. Abhyankar, M. Lokuta, A. Huttenlocher and D. J. Beebe, Characterization of a membrane-based gradient generator for use in cell-signaling studies. Lab Chip, 6, 389–393, 2006.
19. A. Seidi, H. Kaji, N. Annabi, S. Ostrovidov, M. Ramalingam and A. Khademhosseini, A microfluidic-based neurotoxin concentration gradient for the generation of an in vitro model of Parkinson’s disease. Biomicrofluidics, 5, 022214, 2011.
20. M. Hancock, J. He, J. Mano and A. Khademhosseini, Surface-tension-driven gradient generation in a fluid stripe for bench-top and microwell applications. Small, 7(7), 892–901, 2011.
21. J. Ju, J. Y. Park, K. C. Kim, H. Kim, E. Berthier, D. J. Beebe and S. Lee, Backward flow in a surface tension driven micropump. J. Micromech. Microeng., 18, 087002, 2008.
22. J. Ju, J. Park, E. Berthier, D. J. Beebe and S. Lee, Mathematical and experimental study on backward flow in a surface tension driven micropump. In Proceedings of the 12th International Conference on Miniaturized Systems for Chemistry and Life Sciences, 12–16 October, San Diego, CA, 2008.
23. P. J. Resto, B. J. Mogen, E. Berthier and J. C. Williams, An automated microdroplet passive pumping platform for high-speed and packeted microfluidic flow applications. Lab Chip, 10, 23–26, 2010.
24. J. Warrick, I. Meyvantsson, J. Ju and D. J. Beebe, High-throughput microfluidics: Improved sample treatment and washing over standard wells. Lab Chip, 7, 316–321, 2007.
25. I. Meyvantsson, J. Warrick, S. Hayes, A. Skoien and D. J. Beebe, Automated cell culture in high density tubeless microfluidic device arrays. Lab Chip, 8, 717–724, 2008.
26. J. P. Puccinelli, X. Su and D. J. Beebe, Automated high-throughput microchannel assays for cell biology: Operational optimization and characterization J. Assoc. Lab. Autom., 15, 25–32, 2010.
27. A. L. Paguirigan, J. P. Puccinelli, X. Su and D. J. Beebe, Expanding the available assays: Adapting and validating in-cell Westerns in microfluidic devices for cell-based biology. Assay Drug Dev. Techn., 8(5), 591–601, 2010.
28. J. Ju, J. Warrick and D. J. Beebe, A cell programmable assay (CPA) chip. Lab Chip, 10, 2071–2076, 2010.
29. X. Su, E. Young, H. Underkofler, T. Kamp, C. January and D. J. Beebe, Microfluidic cell culture and its application in high-throughput drug screening: Cardiotoxicity assay for hERG channels. J. Biomol. Screen., 16, 101–111, 2011.
30. E. Berthier, J. Warrick, B. Casavant and D. J. Beebe, Pipette-friendly laminar flow patterning for cell-basedassays. Lab Chip, 11, 2060–2065, 2011.
31. B. Kim, S. Kim, S. Yang and H. Yang, Passive washing using inlet-pressure difference and a washing valve. J. Micromech. Microeng., 17, N22–N29, 2007.
32. M. Toepke, V. Abhyankar and D. J. Beebe, Microfluidic logic gates and timers. Lab Chip, 7, 1449–1453, 2007.
33. M. Domenech, H. Yu, J. Warrick, N. Badders, I. Meyvantsson, C. Alexander and D. J. Beebe, Cellular observations enabled by microculture: Paracrine signaling and population demographics. Integr. Biol., 1, 267–274, 2009.
34. K. Sung, N. Yang, C. Pehlke, P. Keely, K. Eliceiri, A. Friedl and D. J. Beebe, Transition to invasion in breast cancer: A microfluidic in vitro model enables examination of spatial and temporal effects. Integr. Biol., 3, 439–450, 2011.
35. R. Khnouf, D. J. Beebe and Z. H. Fan, Protein expression in array devices with passive pumping. In Proceedings of the 12th International Conference on Miniaturized Systems for Chemistry and Life Sciences, pp. 1740–1742, 12–16 October, San Diego, CA, 2008.
36. R. Khnouf, D. J. Beebe and Z. H. Fan, Cell-free protein expression in a microchannel array with passive pumping. Lab Chip, 9, 56–61, 2009.
37. J. Koepsel and W. Murphy, Patterning discrete stem cell culture environments via localized SAM replacement. Langmuir, 25(21), 12825–12834, 2009.
38. V. Echeverria, I. Meyvantsson, A. Skoien, T. Worzella, C. Lamers and S. Hayes, An automated high-content assay for tumor cell migration through 3-dimensional matrices. J. Biomol. Screen., 15(9), 1144–1151, 2010.
39. J. Mohammed, H. Caicedo, C. Fall and D. T. Eddington, Microfluidic add-on for standard electrophysiology chambers. Lab Chip, 8, 1048–1055, 2008.
40. H. Caicedo, M. Hernandez, C. Fall and D. T. Eddington, Multiphysics simulation of a microfluidic perfusion chamber for brain slice physiology. Biomed. Microdevices, 12, 761–767, 2010.
41. E. W. K. Young, E. Berthier, D. J. Guckenberger, E. Sackmann, C. Lamers, I. Meyvantsson, A. Huttenlocher and D. J. Beebe, Rapid prototyping of arrayed microfluidic systems in polystyrene for cell-based assays. Anal. Chem., 83, 1408–1417, 2011.
42. J. Ju, J.-M. Ko, H.-C. Cha, J. Y. Park, C.-H. Im and S.-H. Lee, An electrofusion chip with a cell delivery system driven by surface tension. J. Micromech. Microeng., 19, 015004, 2009.
43. S. K. Mohanty, J. Warrick, J. Gorski and D. J. Beebe, An accessible micro-capillary electrophoresis device using surface- tension-driven flow. Electrophoresis, 30, 1470–1481, 2009.
44. I. Chen and E. Lindner, Lab-on-chip FIA system without an external pump and valves and integrated with an in line electrochemical detector. Anal. Chem., 81(24), 9955–9960, 2009.
45. A. Mcpherson and G. Walker, A microfluidic passive pumping Coulter counter. Microfluid. Nanofluid., 9, 897–904, 2010.
46. I. Barbulovic-Nad, S. Au and A. R. Wheeler, A microfluidic platform for complete mammalian cell culture. Lab Chip, 10, 1536–1542, 2010.
47. L. Hong and T. Pan, Surface microfluidics fabricated by superhydrophobic nanocomposite photoresist. In Proceedings of the IEEE 23rd International Conference on Micro Electro Mechanical Systems MEMS, pp. 420–423, 24–28 January, Wanchai, Hong Kong, 2010.
48. L. Hong and T. Pan, Surface microfluidics fabricated by photopatternable superhydrophobic nanocomposite. Microfluid. Nanofluid., 10, 991–997, 2011.
49. S. Xing, R. S. Harake and T. Pan, Droplet-driven transports on superhydrophobic-patterned surface microfluidics. Lab Chip, 11, 3642–3648, 2011.