
As an administrator, it’s your job to keep an eye on the network systems. The status of system resources and usage can change dramatically over time. Services might stop running. File systems might run out of space. Applications might throw exceptions, which in turn can cause system problems. Unauthorized users might try to break into the system. The techniques discussed in this chapter will help you find and resolve these and other system problems.
Any time you start an application or type a command on the command line, Microsoft Windows Server 2003 starts one or more processes to handle the related program. Generally, processes that you start in this manner are called interactive processes. That is, you start the processes interactively with the keyboard or mouse. If the application or program is active and selected, the related interactive process has control over the keyboard and mouse until you switch control by terminating the program or selecting a different one. When a process has control, it’s said to be running in the foreground.
Processes can also run in the background. With processes started by users, this means that programs that aren’t currently active can continue to operate—only they generally aren’t given the same priority as the active process. You can also configure background processes to run independently of the user logon session; the operating system usually starts such processes. An example of this type of background process is a batch file started with an AT command. The AT command tells the system to run the file at a specified time, and, if permissions are configured correctly, the AT command can do so whether or not a user is logged on to the system.
The key tool you’ll use to manage system processes and applications is Task Manager.
You can access Task Manager using any of the following techniques:
Press Ctrl+Shift+Esc.
Press Ctrl+Alt+Del and then click Task Manager.
Type taskmgr into the Run utility or a command prompt.
Right-click the taskbar and select Task Manager from the shortcut menu.
Techniques you’ll use to work with Task Manager are covered in the following sections.
The Applications tab of Task Manager is shown in Figure 3-1. This tab shows the status of the programs that are currently running on the system. You can use the buttons on the bottom of this tab as follows:
Stop an application by selecting the application and then clicking End Task.
Switch to an application and make it active by selecting the application and then clicking Switch To.
Start a new program by selecting New Task, and then enter a command to run the application. New Task functions like the Start menu’s Run utility.
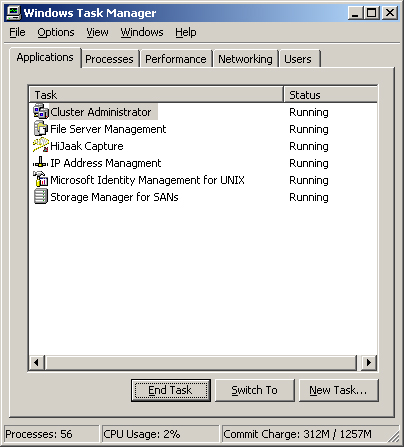
Figure 3-1. The Applications tab of the Windows Task Manager shows the status of programs currently running on the system.
Tip
The Status column tells you if the application is running normally or if the application has gone off into the ozone. A status of Not Responding is an indicator that an application might be frozen, and you might want to end its related task. However, some applications might not respond to the operating system during certain process-intensive tasks. Because of this, you should be certain the application is really frozen before you end its related task.
Right-clicking an application’s listing in the Windows Task Manager displays a shortcut menu that allows you to:
Switch to the application and make it active.
Bring the application to the front of the display.
Minimize and maximize the application.
Tile or cascade the application.
End the application.
Go to the related process in the Processes tab.
The Task Manager Processes tab is shown in Figure 3-2. This tab provides detailed information about the processes that are running. By default, the Processes tab shows only processes run by the operating system, local services, network services, and the interactive user. The interactive user is the user account logged on to the local console. To see processes run by remote users, such as those connecting using a remote desktop connection, you’ll need to select Show Processes From All Users.
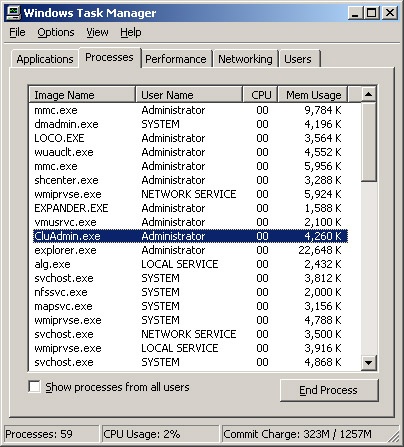
The fields of the Processes tab provide lots of information about running processes. You can use this information to determine which processes are hogging system resources, such as CPU time and memory. The fields displayed by default are:
Image Name. The name of the process or executable running the process
User Name. The name of the user or system service running the process
CPU. The percentage of CPU utilization for the process
Mem Usage. The amount of memory the process is currently using
If you click View and choose Select Columns, you’ll see a dialog box that will let you add columns to the Processes view. When you’re trying to troubleshoot system problems using process information, you might want to add these columns to the view:
Base Priority. Priority determines how much of the system resources are allocated to a process. To set the priority of a process, right-click the process, choose Set Priority, and then select the new priority. Priorities are Low, Below Normal, Normal, Above Normal, High, and Real-Time. Most processes have a normal priority by default. The highest priority is given to real-time processes.
CPU Time. The total amount of CPU cycle time used by the process since it was started. To quickly see the processes that are using the most CPU time, display this column and then click the column header to sort process entries by CPU Time.
Handle Count. The total number of file handles maintained by the process. Use the handle count to gauge how dependent the process is on the file system. Some processes, such as those used by Microsoft Internet Information Services (IIS), have thousands of open file handles. Each file handle requires system memory to maintain.
I/O Reads, I/O Writes. The total number of disk input/output (I/O) reads or writes since the process was started. Together, the number of I/O reads and writes tell you how much disk I/O activity there is. If the number of I/O reads and writes is growing disproportional to actual activity on the server, the process might not be caching files or file caching might not be properly configured. Ideally, file caching will reduce the need for I/O read and writes.
Page Faults. A page fault occurs when a process requests a page in memory and the system can’t find it at the requested location. If the requested page is elsewhere in memory, the fault is called a soft page fault. If the requested page must be retrieved from disk, the fault is called a hard page fault. Most processors can handle large numbers of soft faults. Hard faults, however, can cause significant delays.
Paged Pool, Non-paged Pool. The paged pool is an area of system memory for objects that can be written to disk when they aren’t used. The non-paged pool is an area of system memory for objects that can’t be written to disk. You should note processes that require a high amount of nonpaged pool memory. If there isn’t enough free memory on the server, these processes might be the reason for a high level of page faults.
Peak Memory Usage. The highest amount of memory used by the process. The change or delta between current memory usage and peak memory usage is important to note as well. Applications, such as Microsoft SQL Server, that have a high delta between base memory usage and peak memory usage might need to be allocated more memory on startup so that they perform better.
Thread Count. The current number of threads that the process is using. Most server applications are multithreaded. Multithreading allows concurrent execution of process requests. Some applications can dynamically control the number of concurrently executing threads to improve application performance. Too many threads, however, can actually reduce performance because the operating system has to switch thread contexts too frequently.
If you examine processes running in Task Manager, you’ll note a process called System Idle Process. You can’t set the priority of this process. Unlike other processes that track resource usage, System Idle Process tracks the amount of system resources that aren’t used. Thus, a 99 in the CPU column for the System Idle Process means 99 percent of the system resources currently aren’t being used.
As you examine processes, keep in mind that a single application might start multiple processes. Generally, these processes are dependent on a central process and from this main process a process tree containing dependent processes is formed. You can find the main process for an application by right-clicking the application in the Applications tab and selecting Go To Process. When you terminate processes, you’ll usually want to target the main application process or the application itself rather than dependent processes. This ensures that the application is stopped cleanly.
To stop the main application process and dependent processes, you have several choices. You can:
Select the application in the Applications tab, and then click End Task.
Right-click the main application process in the Processes tab, and then select End Process.
Select the main or a dependent process in the Processes tab, and then select End Process Tree.
The Task Manager Performance tab provides an overview of CPU and memory usage. As shown in Figure 3-3, the tab displays graphs as well as statistics. This information gives you a quick check on system resource usage. For more detailed information, use Performance Monitor, which will be explained later in this chapter.
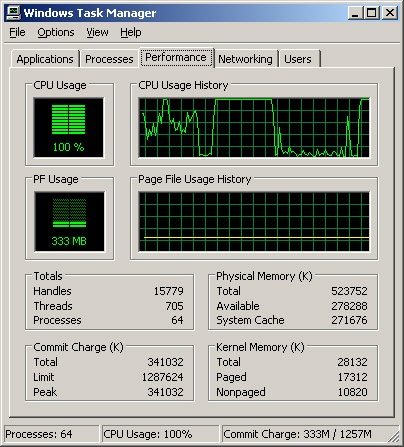
The graphs on the Performance tab provide the following information:
CPU Usage. The percentage of processor resources currently being used.
CPU Usage History. A history graph of CPU usage plotted over time. The update speed determines how often the graph is updated.
PF Usage. The amount of the paging file (or virtual memory) currently being used by the system.
Page File Usage History. A history graph of paging file usage plotted over time.
Tip
To view a close-up of the CPU graphs, double-click within the Performance tab. Double-clicking again returns you to normal viewing mode. If CPU usage is consistently high, even under average usage conditions, you might want to perform more detailed performance monitoring to determine the cause of the problem. Memory is often a source of performance problems, and you should rule it out before upgrading or adding CPUs. For more details, see the section entitled "Tuning System Performance," later in this chapter.
To customize or update the graph display, use the following options on the View menu:
Update Speed. Allows you to change the speed of graph updating as well as to pause the graph. Updates occur once every four seconds for Low, once every two seconds for Normal, and twice per second for High.
CPU History. On multiprocessor systems, allows you to specify how CPU graphs are displayed. You can, for example, display one CPU in each graph or multiple CPUs in each graph.
Show Kernel Times. Allows you to display the amount of CPU time used by the operating system kernel. Usage by the kernel is shown in red plotting (as opposed to green plotting, which is used otherwise).
Beneath the graphs, you’ll find several lists of statistics. These statistics provide the following information:
Totals. Provides information on CPU usage. Processes shows the number of processes in use; processes are running instances of applications or executable files. Threads shows the number of threads in use; threads are the basic units of execution within processes. Handles shows the number of I/O handles in use; I/O handles act as tokens that let programs access resources. I/O throughput and disk performance have more of an impact on a system than does a consistently high number of I/O handles.
Physical Memory. Provides information on the total RAM on the system. Total shows the amount of physical RAM. Available shows the RAM not currently being used and available for use. System Cache shows the amount of memory used for system caching. If the server has very little physical memory available, you might need to add memory to the system. In general, you want the available memory to be no less than 5 percent of the total physical memory on the server.
Commit Charge. Provides information on the total memory used by the operating system. Total lists all physical and virtual memory currently in use. Limit lists the total physical and virtual memory available. Peak lists the maximum memory used by the system since bootup. If the difference between the total memory used and the peak memory used is consistently large, you might want to add physical memory to the system to improve performance. If the peak memory usage is within 10 percent of the Limit value, you might want to add physical memory or increase the amount of virtual memory, or both.
Kernel Memory. Provides information on the memory used by the operating system kernel. Critical portions of kernel memory must operate in RAM and can’t be paged to virtual memory. This type of kernel memory is listed as Nonpaged. The rest of kernel memory can be paged to virtual memory and is listed as Paged. The total amount of memory used by the kernel is listed under Total.
The Task Manager Networking tab provides an overview of the network adapters a system is using. You can use the information provided to quickly determine the percent utilization, link speed, and operational status usage of each network adapter configured on a system.
If a system has one network adapter, a summary graph details the network traffic on this adapter over time. If a system has multiple network adapters, the graph displays a composite index of all network connections, which represents all network traffic. By default, the graph displays only the network traffic total byte count. You can change this by clicking View, choosing Network History, and then enabling Bytes Sent, Bytes Received, or both. Bytes Sent are shown in red, Bytes Received in yellow, Bytes Total in green.
The fields of the Networking tab provide lots of information about network traffic to and from the server. You can use this information to determine how much external traffic a server is experiencing at any time. The fields displayed by default are:
Adapter Name. Name of the network adapter in the Network Connections folder.
Network Utilization. Percentage of network usage based on the connection speed for the interface. For example, an adapter with a link speed of 100 megabits per second (Mbps) and current traffic of 10 Mbps would have a 10 percent utilization.
Link Speed. Interface connection speed as determined by the initial connection speed.
State. Operational status of network adapters.
Real World
Any time you see usage consistently approaching or over 50 percent of total capacity, you’ll want to start monitoring the server more closely and might also want to consider adding network adapters. Plan any upgrade carefully; there is a lot more planning required than you might think. Consider the implications not only for that server but also for the network as a whole. You might also have connectivity problems if you exceed the allotted bandwidth of your service provider—and it can often take months to obtain additional bandwidth for external connections.
If you click View and choose Select Columns, you’ll see a dialog box that will let you add columns to the Processes view. When you’re trying to troubleshoot networking problems, you might want to add the following columns to the view:
Bytes Sent Throughput. Percentage of current connection bandwidth used by traffic sent from the system
Bytes Received Throughput. Percentage of current connection bandwidth used by traffic received by the system
Bytes Throughput. Percentage of current connection bandwidth used for all traffic
Bytes Sent. Cumulative total bytes sent on the connection to date
Bytes Received. Cumulative total bytes received on the connection to date
Bytes Total. Cumulative total bytes on the connection to date
Remote users can connect to systems using Terminal Services or Remote Desktop. Terminal Services allow remote terminal connections to systems. Remote Desktop allows you to administer systems remotely as if you were sitting at the keyboard.
Remote Desktop connections are automatically enabled on Windows Server 2003 installations. One way to view and manage remote desktop connections is to use Task Manager. To do this, start Task Manager, and then click the Users tab. The Users tab shows interactive user sessions for both local and remote users.
Each user connection is listed with the user account name, session ID, status, originating client computer, and session type. A user logged on to the local system is listed with Console as the session type. Other users have a session type that indicates the connection type and protocol, such as RDP-TCP for a connection using the Remote Desktop Protocol (RDP) with Transmission Control Protocol (TCP) as the transport protocol. If you right-click user sessions, you have the following options:
Connect. Connects the user session if it’s inactive.
Disconnect. Disconnects the user session, halting all user-started applications without saving application data.
Log Off. Logs the user off, using the normal logoff process. Application data and system state information are saved as during a normal log off.
Remote Control. Sets the hot keys used to end remote control sessions. The default hot keys are Ctrl+*.
Send Message. Sends a console message to users logged on to remote systems.
Services provide key functions to workstations and servers. To manage system services, you’ll use the Services entry in the Computer Management console. You can start Computer Management and access the Services entry by completing the following steps:
Choose Start, then choose Programs or All Programs as appropriate, then Administrative Tools, and finally Computer Management. Or select Computer Management in the Administrative Tools folder.
Right-click the Computer Management entry in the console tree and select Connect To Another Computer on the shortcut menu. You can now choose the system on which you want to manage services.
Expand the Services And Applications node by clicking the plus sign (+) next to it, and then choose Services.
Note
Windows Server 2003 provides several other ways to access services. For example, you can also use the Services entry in the Component Services utility.
Figure 3-4 shows the Services view in the Computer Management console. The key fields of this dialog box are used as follows:
Name. The name of the service. Only services installed on the system are listed here. Double-click an entry to configure its startup options. If a service you need isn’t listed, you can install it by using the Network Connection Properties dialog box or the Windows Optional Networking Components Wizard. See Chapter 16, for details.
Description. A short description of the service and its purpose.
Status. Whether the status of the service is started, paused, or stopped. (Stopped is indicated by a blank entry.)
Startup Type. The startup setting for the service. Automatic services are started at bootup. Users or other services start manual services. Disabled services are turned off and can’t be started while they remain disabled.
Log On As. The account the service logs on as. The default in most cases is the local system account.
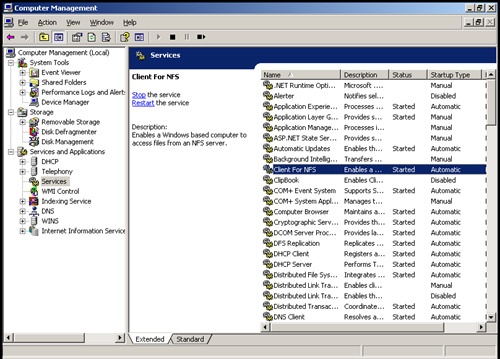
The Services area has two views: extended and standard. To change the view, click the tabs at the bottom of the Services area. In extended view, quick links are provided for managing services. Click Start to start a stopped service. Click Restart to stop and then start a service—essentially resetting that service. If you select a service in extended view, a service description is shown, which details the service’s purpose.
Note
Both the operating system and a user can disable Services. Generally, Windows Server 2003 disables services if there is a possible conflict with another service.
As an administrator, you’ll often have to start, stop, or pause Windows Server 2003 services. To start, stop, or pause a service, complete the following steps:
Start Computer Management and connect to the computer on which you want to manage services.
Expand the Services And Applications node by clicking the plus sign (+) next to it, and then choose Services.
Right-click the service you want to manipulate, and then select Start, Stop, or Pause as appropriate. You can also choose Restart to have Windows stop and then start the service after a brief pause. Additionally, if you pause a service, you can use the Resume option to resume normal operation.
Note
When services that are set to start automatically fail, the status is listed as blank and you’ll usually receive notification in a pop-up dialog box. Service failures can also be logged to the system’s event logs. In Windows Server 2003, you can configure actions to handle service failure automatically. For example, you could have Windows Server 2003 attempt to restart the service for you. For details, see the section entitled "Configuring Service Recovery," later in this chapter.
You can set Windows Server 2003 services to start manually or automatically. You can also turn them off permanently by disabling them. You configure service startup by completing the following steps:
In the Computer Management console, connect to the computer whose services you want to manage.
Expand the Services And Applications node by clicking the plus sign (+) next to it, and then choose Services.
Right-click the service you want to configure, and then choose Properties.
In the General tab, use the Startup Type drop-down list box to choose a startup option, as shown in Figure 3-5. Select Automatic to start services at bootup. Select Manual to allow the services to be started manually. Select Disabled to turn off the service. Click OK.
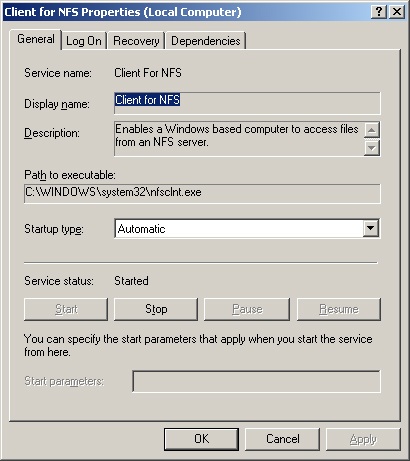
Figure 3-5. Use the General tab’s Startup Type drop-down list box to configure service startup options.
Real World
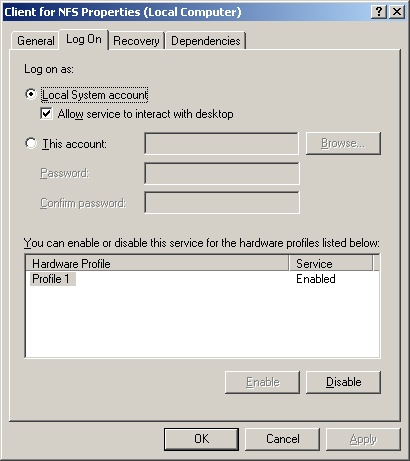
When a server has multiple hardware profiles, you can enable or disable services for a particular profile. Before you disable services permanently, you might want to create a separate hardware profile for testing the server with these services disabled. In this way, you can use the original profile to quickly resume operations using the original service status. The profile doesn’t save other service configuration options, however. To enable or disable a service by profile, use the Log On tab of the Service Properties dialog box. Select the profile that you want to work with under Hardware Profile, and then click Enable or Disable as appropriate.
You can configure Windows Server 2003 services to log on as a system account or as a specific user. To do either of these, complete the following steps:
In the Computer Management console, connect to the computer whose services you want to manage.
Expand the Services And Applications node by clicking the plus sign (+) next to it, and then choose Services.
Right-click the service you want to configure, and then choose Properties.
Select the Log On tab, as shown in Figure 3-6.
Select Local System Account if the service should log on using the system account (which is the default for most services). If the service provides a user interface that can be manipulated, select Allow Service To Interact With Desktop to allow users to control the service’s interface.
Select This Account if the service should log on using a specific user account. Be sure to type an account name and password in the text boxes provided. Use the Browse button to search for a user account, if necessary. Click OK.
Security
As an administrator, you should keep track of any accounts that are used with services. These accounts can be the source of huge security problems if they’re not configured properly. Service accounts should have the strictest security settings and as few permissions as possible while allowing the service to perform necessary functions. Typically, accounts used with services don’t need many of the permissions you would assign to a normal user account. For example, most service accounts don’t need the right to log on locally. Every administrator should know what service accounts are used (so they can better track use of these accounts), and the accounts should be treated as if they were administrator accounts. This means: secure passwords, careful monitoring of account usage, careful application of account permissions and privileges, and so on.
You can configure Windows Server 2003 services to take specific actions when a service fails. For example, you could attempt to restart the service or run an application. To configure recovery options for a service, complete the following steps:
In the Computer Management console, connect to the computer whose services you want to manage.
Expand the Services And Applications node by clicking the plus sign (+) next to it, and then choose Services.
Right-click the service you want to configure, and then choose Properties.
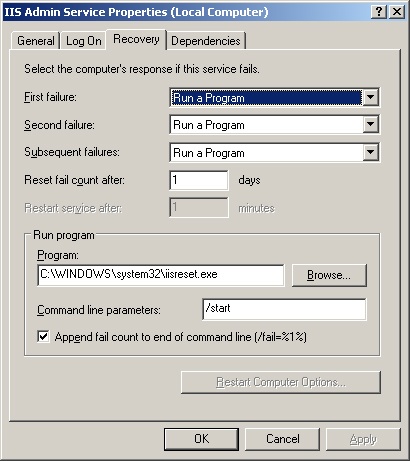
Click the Recovery tab, as shown in Figure 3-7.
Figure 3-7. Use the Recovery tab to specify actions that should be taken in case of service failure.
Note
Windows Server 2003 automatically configures recovery for some critical system services during installation. In Figure 3-7, you see that the IIS Admin service is set to run a program called Iisreset.exe if the service fails. This program is an application that corrects service problems and safely manages dependent IIS services while working to restart the service. Iisreset.exe requires the command line parameter/start as well.
You can now configure recovery options for the first, second, and subsequent recovery attempts. The available options are:
Take No Action. The operating system won’t attempt recovery for this failure but might still attempt recovery of previous or subsequent failures.
Restart the Service. Stops and then starts the service after a brief pause.
Run a Program. Allows you to run a program or a script in case of failure. The script can be a batch program or a Windows script. If you select this option, set the full file path to the program you want to run and then set any necessary command line parameters to pass in to the program when it starts.
Restart the Computer. Shuts down and then restarts the computer. Before you choose this option, double-check Startup and Recovery options as well as Hardware Profile options, as discussed in the sections entitled "Configuring System Startup and Recovery" and "Configuring the Way Hardware Profiles Are Used," respectively, in Chapter 2. You want the system to select defaults quickly and automatically.
Configure other options based on your previously selected recovery options. If you elected to run a program as a recovery option, you’ll need to set options in the Run Program panel. If you elected to restart the service, you’ll need to specify the restart delay. After stopping the service, Windows Server 2003 waits for the specified delay before trying to start the service. In most cases, a delay of 1–2 minutes should be sufficient. Click OK.
As an administrator, it’s your job to ensure server and network security, and unnecessary services are a potential source of security problems. For example, in many organizations that I’ve reviewed for security problems, I’ve found servers running Worldwide Web Publishing Service, Simple Mail Transfer Protocol (SMTP), and File Transfer Protocol (FTP) Publishing Service when these services weren’t needed. Unfortunately, these services can make it possible for anonymous users to access servers and can also open the server to attack if not properly configured.
If you find services that aren’t needed, you have several options. In the case of IIS Admin services, Domain Name System (DNS), and other services that are installed as separate Windows components, you could use the Add/Remove Programs utility in Control Panel to remove the unnecessary component and its related services. Or, you could simply disable the services that aren’t being used. Typically, you’ll want to start by disabling services rather than uninstalling components. This way, if you disable a service and another administrator or a user says they can’t perform task X anymore, you can restore the related service, if necessary.
To disable a service, follow these steps:
In Computer Management, right-click the service you want to disable, and then choose Properties.
In the General tab, select Disabled as the option for the Startup Type drop-down list box.
Disabling a service doesn’t stop a running service. It only prevents it from being started the next time the computer is booted, meaning the security risk still exists. To address this, click Stop in the Properties dialog box in the General tab, and then click OK.
Event logs provide historical information that can help you track down system and security problems. The Event Log service controls whether events are tracked on Windows Server 2003 systems. When this service is started, you can track user actions and system resource usage events with the following event logs:
Application. Records events logged by applications, such as the failure of Microsoft SQL Server to access a database. Default location is %SystemRoot%System32ConfigAppEvent.Evt.
DFS Replication. Records Distributed File System (DFS) replication activities. Default location is %SystemRoot%System32DonfigDfsr.Evt.
Directory Service. Records events logged by Active Directory directory service and its related services. Default location is %SystemRoot%System32ConfigNTDS.Evt.
DNS Server. Records DNS queries, responses, and other DNS activities. Default location is %SystemRoot%System32ConfigDNSEvent.Evt.
File Replication Service. Records file replication activities on the system. Default location is %SystemRoot%System32ConfigNtFrs.Evt.
Forwarded Events. When event forwarding is configured, records forwarded events from other servers. Default location is %SystemRoot%System32ConfigFwdEvents.Evt.
Hardware Events. When hardware subsystem event reporting is configured, records hardware events reported to the operating system. Default location is %SystemRoot%System32ConfigHwrEvents.Evt.
Security Log. Records events you’ve set for auditing with local or global group policies. Default location is: %SystemRoot%System32ConfigSecEvent.Evt.
Note
Any user who needs access to the security log must be granted the user right to Manage Auditing and the Security Log. By default, members of the administrators group have this user right. To learn how to assign user rights, see the section entitled "Configuring User Rights Policies" in Chapter 9.
System Log. Records events logged by the operating system or its components, such as the failure of a service to start at bootup. Default location is: %SystemRoot%System32ConfigSysEvent.Evt.
Security
As administrators, we tend to monitor the application and system logs the most—but don’t forget about the security log. The security log is one of the most important logs, and you should monitor it closely. If the security log on a server doesn’t contain events, the likeliest reason is that local auditing hasn’t been configured or that domain-wide auditing is configured, in which case you should monitor the security logs on domain controllers rather than on member servers. Note also that any user who needs access to the security log must be granted the user right to Manage Auditing and the Security Log. By default, members of the Administrators group have this user right. To learn how to assign user rights, see the section entitled "Configuring User Rights Policies" in Chapter 9.
You access the event logs by completing the following steps:
In the Computer Management console, connect to the computer whose event logs you want to view or manage.
Expand the System Tools node by clicking the plus sign (+) next to it, and then double-click Event Viewer. You should now see a list of logs, as shown in Figure 3-8.
Select the log you want to view.
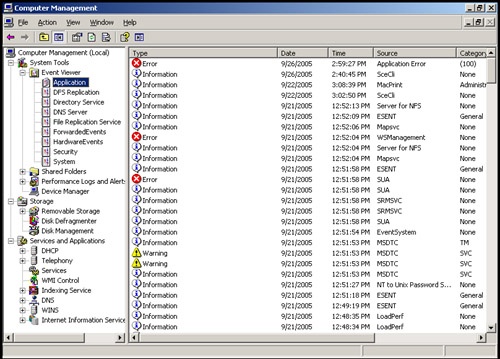
Entries in the main panel of Event Viewer provide a quick overview of when, where, and how an event occurred. To obtain detailed information on an event, double-click its entry. The event type precedes the date and time of the event. Event types include:
Information. An informational event, which is generally related to a successful action.
Success Audit. An event related to the successful execution of an action.
Failure Audit. An event related to the failed execution of an action.
Warning. A warning. Details for warnings are often useful in preventing future system problems.
Error. An error, such as the failure of a service to start.
Note
Warnings and errors are the two types of events that you’ll want to examine closely. Whenever these types of events occur and you’re unsure of the cause, double-click the entry to view the detailed event description.
In addition to type, date, and time, the summary and detailed event entries provide the following information:
Source. The application, service, or component that logged the event
Category. The category of the event, which is sometimes used to further describe the related action
Event. An identifier for the specific event
User. The user account that was logged on when the event occurred
Computer. The name of the computer where the event occurred
Description. In the detailed entries, a text description of the event
Data. In the detailed entries, any data or error code output by the event
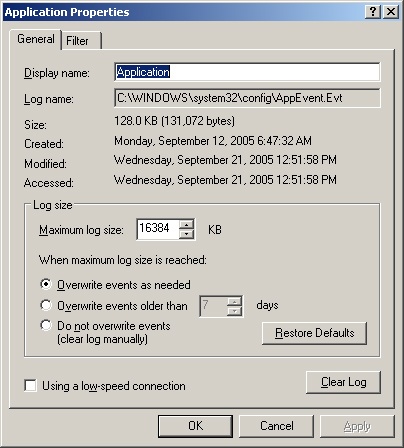
Log options allow you to control the size of the event logs as well as how logging is handled. By default, event logs are set with a maximum file size of 512 Kilobytes (KB). Then, when a log reaches this limit, events are overwritten to prevent the log from exceeding the maximum file size.
To set the log options, complete the following steps:
In the Computer Management console, double-click the Event Viewer entry. You should now see a list of event logs.
Right-click the event log whose properties you want to set and select Properties from the shortcut menu. This opens the dialog box shown in Figure 3-9.
Type a maximum size in the Maximum Log Size text box. Make sure that the drive containing the operating system has enough free space for the maximum log size you select. Log files are stored in the %SystemRoot%system32config directory by default.
Note
Throughout this book you’ll see references to %SystemRoot%. This is an environment variable that Windows Server 2003 uses to designate the base directory for the Windows Server 2003 operating system, such as C:WINDOWS. For more information on environment variables, see the section entitled "Configuring the User’s Environment Settings" in Chapter 10.
Select an event log-wrapping mode. The options available are:
Overwrite Events As Needed. Events in the log are overwritten when the maximum file size is reached. Generally, this is the best option on a low priority system.
Overwrite Events Older Than ... Days. When the maximum file size is reached, events in the log are overwritten only if they are older than the setting you select. If the maximum size is reached and the events can’t be overwritten, the system generates error messages telling you the event log is full.
Do Not Overwrite Events (Clear Log Manually). When the maximum file size is reached, the system generates error messages telling you the event log is full.
Click OK when you’re finished.
Note
On critical systems where security and event logging is very important, you might want to use Overwrite Events Older Than ... Days or Do Not Overwrite Events (Clear Log Manually). When you use these methods, you should archive and clear the log file periodically to prevent the system from generating error messages.
When an event log is full, you need to clear it. To do that, complete the following steps:
In the Computer Management console, double-click the Event Viewer entry. You should now see a list of event logs.
Right-click the event log whose properties you want to set and select Clear All Events from the shortcut menu.
Choose Yes to save the log before clearing it. Choose No to continue without saving the log file.
When prompted to confirm that you want to clear the log, click Yes.
On key systems such as domain controllers and application servers, you’ll want to keep several months’ worth of logs. However, it usually isn’t practical to set the maximum log size to accommodate this. Instead, you should periodically archive the event logs.
Logs can be archived in three formats:
Event log format for access in Event Viewer
Tab-delimited text format, for access in text editors or word processors or import into spreadsheets and databases
Comma-delimited text format, for import into spreadsheets or databases
When you export log files to a comma-delimited file, a comma separates each field in the event entry. The event entries look like this:
12/11/02,9:43:24 PM,DNS,Information,None,2,N/A,ZETA,The DNS server has
started. 12/11/02,9:40:04 PM,DNS,Error,None,4015,N/A,ZETA,The DNS server
has encountered a critical error from the Directory Service (DS). The data
is the error code.
The format for the entries is as follows:
Date,Time,Source,Type,Category,Event,User,Computer,Description
To create a log archive, complete the following steps:
In the Computer Management console, double-click the Event Viewer entry. You should now see a list of event logs.
Right-click the event log you want to archive and select Save Log File As from the shortcut menu.
In the Save As dialog box, select a directory and a log file name.
In the Save As Type dialog box, Event Log (*.evt) will be the default file type. Select a log format as appropriate and then choose Save.
Note
If you plan to archive logs regularly, you might want to create an archive directory. This way you can easily locate the log archives. You should also name the log file so that you can easily determine the log file type and the period of the archive. For example, if you’re archiving the system log file for January 2003, you might want to use the file name System Log January 2003.
Tip
The best format to use for archiving is the .evt format. Use this format if you plan to review old logs in the Event Viewer. However, if you plan to review logs in other applications, you might need to save the logs in a tab-delimited or comma-delimited format. With the tab-delimited or comma-delimited format, it’s sometimes necessary to edit the log file in a text editor in order for the log to be properly interpreted. If you have saved the log in the .evt format, you can always save another copy as tab-delimited or comma-delimited format later by doing another Save As after opening the archive in the Event Viewer.
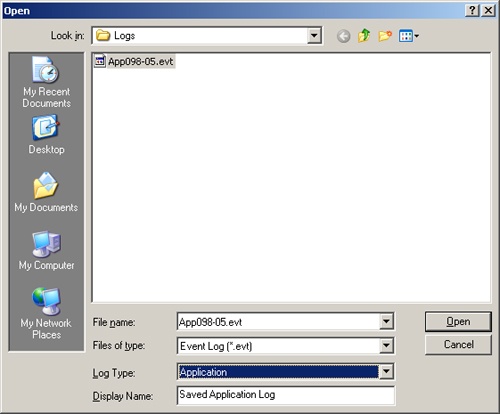
You can view log archives in text format in any text editor or word processor. You should view log archives in the event log format in Event Viewer. You can view log archives in Event Viewer by completing the following steps:
In the Computer Management console, right-click the Event Viewer entry. On the shortcut menu, select Open Log File. You should now see the Open dialog box shown in Figure 3-10.
Use the Open dialog box to select a directory and a log file name. If the log isn’t saved in Event Viewer format, select All Files from the Files Of Type selection menu.
Use Log Type to specify the type of log as Application, Directory Service, and so on.
Click Open. The archived log is displayed as a separate view in Event Viewer. Select this view to display the saved events in the log.
Monitoring a server isn’t something you should do haphazardly. You need to have a clear plan—a set of goals that you hope to achieve. Let’s take a look at the reasons you might want to monitor a server and at the tools you can use to do this.
Troubleshooting server performance problems is a key reason for monitoring. For example, users might be having problems connecting to the server and you might want to monitor the server to troubleshoot these problems. Here, your goal would be to track down the problem using the available monitoring resources and then to resolve it.
Another common reason for wanting to monitor a server is to improve server performance. You do this by improving disk I/O, reducing CPU usage, and cutting down on the network traffic load on the server. Unfortunately, there are often tradeoffs to be made when it comes to resource usage. For example, as the number of users accessing a server grows, you might not be able to reduce the network traffic load, but you might be able to improve server performance through load balancing or by distributing key data files on separate drives.
Before you start monitoring a server, you might want to establish baseline performance metrics for your server. To do this, you measure server performance at various times and under different load conditions. You can then compare the baseline performance with subsequent performance to determine how the server is performing. Performance metrics that are well above the baseline measurements might indicate areas where the server needs to be optimized or reconfigured.
After you establish the baseline metrics, you should formulate a monitoring plan. A comprehensive monitoring plan includes the following steps:
Determining which server events should be monitored to help you accomplish your goal
Setting filters to reduce the amount of information collected
Configuring monitors and alerts to watch the events
Logging the event data so that it can be analyzed
Analyzing the event data in System Monitor, which is included in the Performance console
These procedures are examined later in this chapter. Although you should usually develop a monitoring plan, sometimes you might not want to go through all these steps to monitor your server. For example, you might want to monitor and analyze activity as it happens rather than log and analyze the data later.
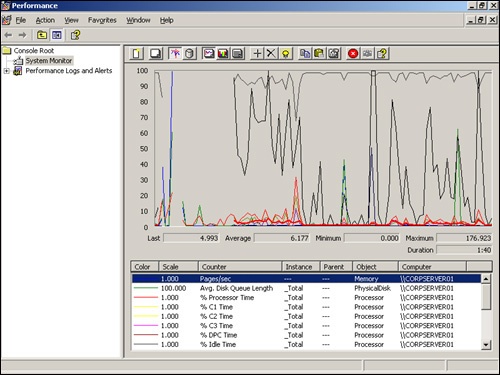
The Performance console includes the System Monitor snap-in. System Monitor graphically displays statistics for the set of performance parameters you’ve selected for display. These performance parameters are referred to as counters. You can also update the available counters when you install services and add-ons on the server. For example, when you configure DNS on a server, System Monitor is updated with a set of objects and counters for tracking DNS performance. System Monitor creates a graph depicting the various counters you’re tracking.
The update interval for this graph is completely configurable but, by default, is set to one second. As you’ll see when you work with System Monitor, the tracking information is most valuable when you record the information in a log file and when you configure alerts to send messages when certain events occur or when certain thresholds are reached, such as when the CPU processor time reaches 99 percent. The sections that follow examine key techniques you’ll use to work with performance monitor.
The System Monitor displays information only for counters you’re tracking. Dozens of counters are available, and as you add services, you’ll find there are even more. These counters are organized into groupings called performance objects. For example, all CPU-related counters are associated with the Processor object.
To select which counters you want to monitor, complete the following steps:
Select the Performance option on the Administrative Tools menu. This displays the Performance console.
Select the System Monitor entry in the left pane, as shown in Figure 3-11.
System Monitor has several viewing modes. Make sure you’re in View Current Activity and View Graph display mode by clicking the View Current Activity and View Graph buttons on the Performance Monitor toolbar.
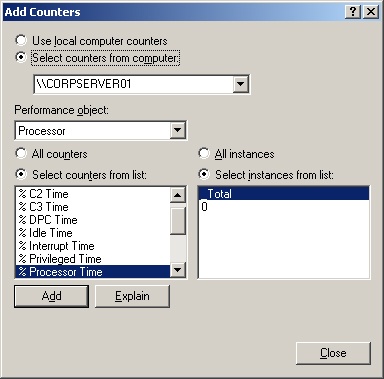
To add counters, click the Add (+) button on the System Monitor toolbar or press Ctl+L. This displays the Add Counters dialog box shown in Figure 3-12. The key fields are:
Use Local Computer Counters. Configure performance options for the local computer.
Select Counters From Computer. Enter the Universal Naming Convention (UNC) name of the server you want to work with, such as \ZETA. Or, use the selection list to select the server from a list of computers you have access to over the network.
Performance Object. Select the type of object you want to work with, such as Processor.
All Counters. Select all counters for the current object.
Select Counters From List. Select one or more counters for the current object. For example, you could select % Processor Time and % User Time.
All Instances. Select all counter instances for monitoring.
Select Instances From List. Select one or more counter instances to monitor.
When you’ve selected all the necessary options, click Add to add the counters to the chart. Then repeat this process, as necessary, to add other performance parameters.
Click Done when you’re finished adding counters.
You can delete counters later by clicking their entry in the lower portion of the Performance window and then clicking Delete displays.
You can use performance logs to track the performance of a server, and you can replay them later. As you set out to work with logs, keep in mind that parameters that you track in log files are recorded separately from parameters that you chart in the Performance window. You can configure log files to update counter data automatically or manually. With automatic logging, a snapshot of key parameters is recorded at specific time intervals, such as every 10 seconds. With manual logging, you determine when snapshots are made. Two types of performance logs are available:
Counter logs. Record performance data on the selected counters when a predetermined update interval has elapsed
Trace logs. Record performance data whenever their related events occur
To create and manage performance logging, complete the following steps:
Access the Performance console by selecting the Performance option on the Administrative Tools menu.
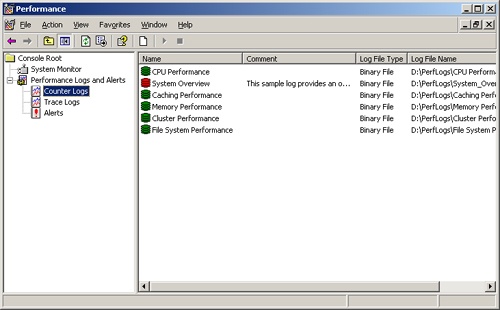
Expand the Performance Logs And Alerts node and then select either Counter Logs or Trace Logs.
As shown in Figure 3-13, you should see a list of current logs (if any) in the right pane. A green log symbol next to the log name indicates logging is active. A red log symbol indicates logging is stopped.
You can create a new log by right-clicking in the right pane and selecting New Log Settings from the shortcut menu. A New Log Settings box appears, asking you to give a name to the new log settings. Type a descriptive name here before continuing.
To manage an existing log, right-click its entry in the right pane, and then select one of the following options:
Delete. To delete the log
Properties. To display the log properties dialog box
Start. To activate logging
Stop. To halt logging
Save Settings As. Saves the log configuration as a Web page that can be viewed in a browser, such as Internet Explorer, and imported into a new counter log using New Log Settings From
Real World
The Hypertext Markup Language (HTML) page created using Save Settings As has an embedded System Monitor that you can use to view the performance data you’ve configured. If you save the settings to a folder published under IIS, you’ll be able to easily remotely view performance data. All you need to do is type the appropriate Uniform Resource Locator (URL) in the Web browser’s Address text box.
Counter logs record performance data on the selected counters at a specific sample interval. For example, you could sample performance data for the CPU every 15 minutes. To create a counter log, complete the following steps:
Right-click Counter Logs in the left pane of the Performance console, and then choose New Log Settings.
In the New Log Settings dialog box, type a name for the log, such as System Performance Monitor or Processor Status Monitor. Then click OK.
To add all counters for specific performance objects, click Add Objects, and then use the Add Object dialog box to select the objects you want to add. All counters for these objects will be logged.
To add specific counters for objects, click Add Counters, and then use the Select Counters dialog box to select the counters you want to add.
In the Sample Data Every... text box, type in a sample interval and select a time unit in seconds, minutes, hours, or days. The sample interval specifies when new data is collected. For example, if you sample every 15 minutes, the log is updated every 15 minutes.
In the Run As text box, type the name of the account under which the counter log will run, and then click Set Password. After you type the password for the account and then confirm the password, click OK to close the Set Password dialog box. To run the log under the default system account, type <Default>.
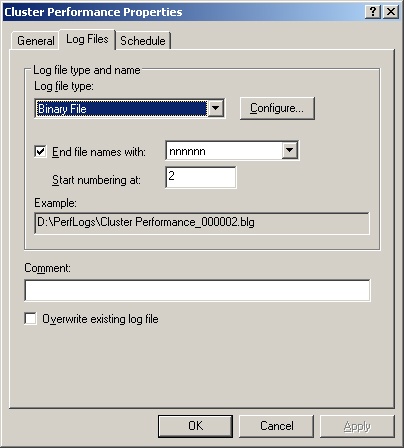
Click the Log Files tab as shown in Figure 3-14. By default, counter logs are saved as sequentially numbered binary files in the %SystemDrive%PerfLogs directory.
If desired, change the log file defaults using the following options:
Log File Type. Changes the default log type. Text File (Comma Delimited) creates a log file with comma-separated entries. Text File (Tab Delimited) creates a log file with tab-separated entries. Binary File creates a binary file that Performance Monitor can read. Binary Circular File creates a binary file that overwrites old data with new data when the file reaches a specified size limit. SQL Database writes the performance data to a SQL Database.
End File Names With. Sets an automatic suffix for each new file created when you run the counter log. Logs can have a numeric suffix or a suffix in a specific date format.
Start Numbering At. Sets the first serial number for a log that uses an automatic numeric suffix.
Comment. Sets an optional description of the log, which is displayed in the Comment column.
After you set the log file type, click Configure to configure the log file location. If you selected SQL Database as the file type, use the Configure SQL Logs dialog box to select a previously configured system data source name (DSN). The DSN is used to establish a connection to a SQL-compliant database. If you selected another file type, you’ll be able to set the log file name and folder location. With either selection you have the option of limiting the log file size to a specific value.
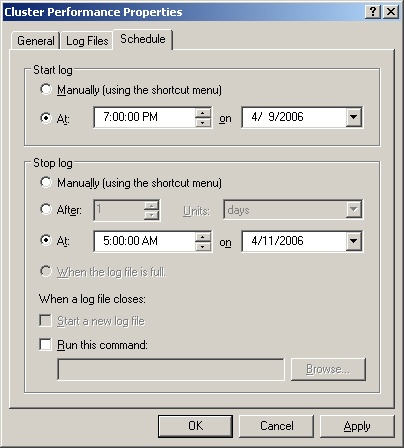
Click the Schedule tab, shown in Figure 3-15, and then specify when logging should start and stop.
You can configure the logging to start manually or automatically at a specific date. Select the appropriate option and then specify a start date if necessary.
You can configure the log file to stop manually after a specified period of time, such as seven days, at a specific date and time, or when the log file is full (if you’ve set a specific file size limit). When a log file closes, you can start a new log file or run a command automatically as well.
Click OK when you’ve finished setting the logging schedule. The log is then created, and you can manage it as explained in the section entitled "Creating and Managing Performance Logging," earlier in this chapter.
Trace logs record performance data whenever events related to their source providers occur. A source provider is an application or operating system service that has traceable events.
To create a trace log, complete the following steps:
Right-click Trace Logs in the left pane of the Performance console, and then choose New Log Settings.
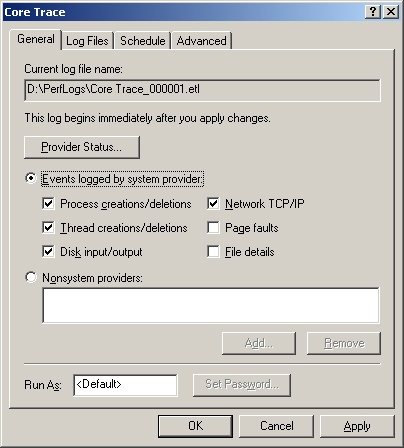
In the New Log Settings dialog box, type a name for the log, such as Logon Trace or Disk I/O Trace. Then click OK. This opens the dialog box shown in Figure 3-16.
If you want to trace operating system events, select the Events Logged By System Provider option button. As shown in Figure 3-16, you can now select system events to trace.
Collecting page faults and file details events puts a heavy load on the server and causes the log file to grow rapidly. Because of this, you should collect page faults and file details only for a limited time.
If you want to trace another provider, select the Nonsystem Providers option button and then click Add. This displays the Add Nonsystem Providers dialog box, which you’ll use to select the provider to trace.
In the Run As text box, type the name of the account under which the counter log will run, and then click Set Password. After you type the password for the account and then confirm the password, click OK to close the Set Password dialog box. To run the log under the default system account, type <Default>.
When you’re finished selecting providers and events to trace, click the Log Files tab. You can now configure the trace file as explained in Steps 7 and 8 of the section of this chapter entitled "Creating Counter Logs." The only change is that the log file types are different. With trace logs, you have two log types:
Sequential Trace File. Writes events to the trace log sequentially up to the maximum file size (if any)
Circular Trace File. Overwrites old data with new data when the file reaches a specified size limit
Click the Schedule tab, and then specify when tracing starts and stops.
You can configure the logging to start manually or automatically at a specific date. Select the appropriate option, and then specify a start date, if necessary.
You can configure the log file to stop manually, after a specified period of time (such as seven days), at a specific date and time, or when the log file is full (if you’ve set a specific file size limit). When a log file closes, you can start a new log file or run a command automatically as well.
When you’ve finished setting the logging schedule, click OK. The log is then created and you can manage it as explained in the section entitled "Creating and Managing Performance Logging," later in this chapter.
When you’re troubleshooting problems, you’ll often want to log performance data over an extended period of time and then replay the data to analyze the results. To do this, complete the following steps:
Configure automatic logging as described in the section entitled "Using Performance Logs," earlier in this chapter.
In the Performance console, select the System Monitor entry on the left pane and then right-click the System Monitor details pane. Finally, select Properties from the shortcut menu. This displays the System Monitor Properties dialog box.
Click the Source tab. Under Data Source, click Log Files and then click Add to open the Select Log File dialog box. You can now select the log file you want to analyze.
Specify the time window that you want to analyze. Click Time Range, and then drag the Total Range bar to specify the appropriate starting and ending times. Drag the left edge to the right to move up the start time. Drag the right edge to the left to move down the end time.
Click the Data tab. You can now select counters to view. Click the Add button. This displays the Add Counter dialog box, which you can use to select the counters that you want to analyze.
Only counters that you selected for logging are available. If you don’t see a counter that you want to work with, you’ll need to modify the log properties, restart the logging process, and then check the logs at a later date.
Click OK. Then, in System Monitor, use the View Graph, View Histogram, and View Report buttons on the toolbar to display information based on the counters selected.
You can configure alerts to notify you when certain events occur or when certain performance thresholds are reached. You can send these alerts as network messages and as events that are logged in the application event log. You can also configure alerts to start applications and performance logs.
To add alerts in the Performance console, complete the following steps:
Right-click Alerts in the left pane of the Performance console, and then choose New Alert Settings.
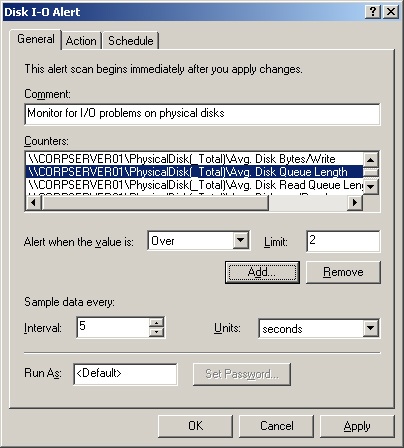
In the New Alert Settings dialog box, type a name for the alert, such as Processor Alert or Disk I/O Alert. Then click OK. This opens the dialog box shown in Figure 3-17.
In the General tab, type an optional description of the alert. Then click Add to display the Add Counters dialog box. This dialog box is identical to the Add Counters dialog box shown previously in Figure 3-12.
Use the Add Counters dialog box to add counters that trigger the alert. Click Close when you’re finished.
In the Counters panel, select the first counter and then use the Alert When Value Is ... text box to set the occasion when an alert for this counter is triggered. Alerts can be triggered when the counter is over or under a specific value. Select Over or Under, and then set the trigger value. The unit of measurement is whatever makes sense for the currently selected counter(s). For example, to alert if processor time is over 95 percent, you would select Over and then type 95. Repeat this process to configure other counters you’ve selected.
In the Sample Data Every ... text box, type in a sample interval and select a time unit in seconds, minutes, hours, or days. The sample interval specifies when new data is collected. For example, if you sample every 10 minutes, the log is updated every 10 minutes.
In the Run As text box, type the name of the account under which the counter log will run, and then click Set Password. After you type the password for the account and then confirm the password, click OK to close the Set Password dialog box. To run alert logging under the default system account, type <Default>.
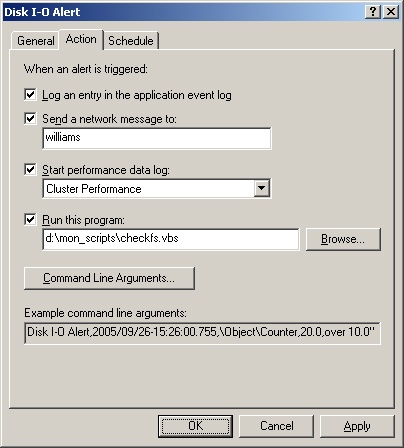
Click the Action tab, shown in Figure 3-18. You can now specify any of the following actions to happen when an alert is triggered:
Log An Entry In The Application Event Log. Creates log entries for alerts
Send A Network Message To. Sends a network message to the computer specified
Start Performance Data Log. Sets a counter log to start when an alert occurs
Run This Program. Sets the complete file path of a program or batch file script to run when the alert occurs
Note
Alerts can be configured to run executable programs with the .exe extension and batch files with the .bat or .cmd extension when an alert is triggered. Be sure to type the full path to the program or batch file you want to run. The Run This Program text box will accept only valid file paths. If you enter an invalid file path, you’ll see a warning specifying this when you click OK or try to access another tab. To pass arguments to an executable or batch file application, use the options of the Command Line Arguments panel. Normally, arguments are passed as individual strings. However, if you select Single Argument String, the arguments are passed in a comma-separated list within a single string. The Example Command Line Arguments list at the bottom of the tab shows how the arguments would be passed.
Click the Schedule tab, and then specify when alerting starts and stops. For example, you could configure the alerts to start on a Friday evening and stop on Monday morning. Then each time an alert occurs during this period, the specified action(s) are executed.
You can configure alerts to start manually or automatically at a specific date. Select the appropriate option, and then specify a start date, if necessary.
You can configure alerts to stop manually or automatically after a specified period of time, such as seven days, or at a specific date and time.
When you’ve finished setting the alert schedule, click OK. The alert is then created, and you can manage it in much the same way that you manage counter and trace logs.
Real World
Figure 3-18 shows the Run This Program text box with the path to a Windows script with the .vbs extension as the action to take. If the .vbs script exists in the location specified, this will be accepted as a valid entry. However, when the alert is triggered, the Windows script won’t run and an error will be entered in the Application event log. To run a Windows script as an action, you must follow the steps outlined in the following section, "Running Scripts as Actions."
Performance Logs And Alerts is the service responsible for handling alerts. To run batch scripts or any programs that launch command prompts or perform other actions that require access to the desktop, you’ll need to configure the service so that it can interact with the desktop. To do this, complete the following steps:
Click Start, choose Administrative Tools, and then click Services.
Right-click Performance Logs And Alerts, and then select Properties.
In the Log On tab, select the Local System Account and Allow Service To Interact With Desktop check boxes.
In the General tab, click Start, and then click OK.
This allows the Performance Logs And Alerts service to execute batch (.bat, .cmd) and script (.js, .vbs, .wsf) files interactively. However, you can’t enter the name of a Windows script directly in the Run This Program text box. Instead, you must enter the path to the Windows Script engine that you want to run when the action is triggered, such as C:WINDOWSsystem32Cscript.exe, and then set Command Line Arguments that point to the script you want to execute. To do this, follow these steps:
Set up the alert. For the alert action, select Run This Program. Click Browse. Use the Select File To Run dialog box to find the full path to the Windows Script engine you want to use, such as C:WINDOWSsystem32Cscript.exe. Click Open.
In the Action tab of the alert Properties dialog box, click Command Line Arguments. In the Command Line Arguments dialog box, select Single Argument String and Text Message. Clear all other arguments.
In the Text Message text box, type the full path to the script, such as c:scriptsTest.vbs.
Click OK twice.
Click the Schedule tab, and then specify when alerting starts and stops. For example, you could configure the alerts to start on a Friday evening and stop on Monday morning. Then, each time an alert occurs during this period, the specified action(s) are executed.
You can configure alerts to start manually or automatically at a specific date. Select the appropriate option, and then specify a start date, if necessary.
You can configure alerts to stop manually, after a specified period of time, such as seven days, or at a specific date and time.
When you’ve finished setting the alert schedule, click OK. The alert is then created, and you can manage it like a counter or trace log.
Now that you know how to monitor your system, let’s look at how you can tune the operating system and hardware performance. I’ll examine the following areas:
Memory usage and caching
Processor utilization
Disk I/O
Network bandwidth and connectivity
Memory is often the source of performance problems, and you should always rule out memory problems before examining other areas of the system. Systems use both physical and virtual memory. To rule out memory problems with a system, you should configure application performance, memory usage, and data throughput settings, and then monitor the server’s memory usage to check for problems.
Application performance and memory usage settings determine how system resources are allocated. In most cases, you want to give the operating system and background applications the lion’s share of resources. This is especially true for Active Directory, file, print, and network and communications servers. On the other hand, for application, database, and streaming media servers, you’ll want to give the programs the server is running the most resources.
To check these settings, follow these steps:
Start the System utility from the Control Panel.
Click the Advanced tab in the System utility, and then display the Performance Options dialog box by clicking Settings on the Performance panel. Click the Advanced tab.
The Processor Scheduling panel controls allocation of CPU time. To give more CPU time to the operating system and background services, select Background Services. Otherwise, select Programs.
The Memory Usage panel controls allocation of memory. To give more memory to the operating system and background services, select System Cache. Otherwise, select Programs. Click OK.
Data throughput settings control how well a server responds to user requests, file handles, and client connections. You can optimize data throughput settings in one of four ways:
Minimize Memory Used. Optimizes the server to serve a small number of users. This means very little system memory is reserved for user requests, file handles, and client connections. This allows the server to reserve memory for other purposes but doesn’t necessarily reduce the size of the system cache or reserved memory. (You’ll experience poor responsiveness and performance if there are a lot of user requests, file handles, and client connections.)
Balance. Optimizes the server for mixed usage environments where the server has multiple roles that include file and printer sharing as well as other tasks. This results in average responsiveness to requests, file handles, and client connections.
Maximize Data Throughput For File Sharing. Optimizes the server to handle file and print services. This means the server will dedicate as many resources as possible to handling user requests, file handles, and client connections, which improves responsiveness and can also improve performance for user, file, and client actions.
Maximize Data Throughput For Network Applications. Optimizes the server memory for distributed applications that manage their own memory cache, such as SQL Server and IIS. This reduces the size of the system cache and allows more memory to be allocated to applications.
To configure data throughput, complete the following steps:
Access Network Connections in Control Panel.
Right-click Local Area Connection, and then select Properties. This displays the Properties dialog box. Servers with multiple network interface cards will have multiple network connections shown in Network Connections. You should optimize each of these connections appropriately.
Select File And Printer Sharing For Microsoft Networks, and then click Properties.
In the Server Optimization tab, select the setting. Click OK.
You’ll need to reboot the server for these changes to take effect.
Now that you’ve optimized the system, you can determine how the system is using memory and check for problems. Table 3-1 provides an overview of counters that you’ll want to track to uncover memory, caching, and virtual memory (paging) bottlenecks. The table is organized by issue category.
Table 3-1. Uncovering Memory-Related Bottlenecks
Issue | Counters to Track | Details |
|---|---|---|
Physical and virtual memory usage | MemoryAvailable Kbytes MemoryCommitted Bytes | MemoryAvailable Kbytes is the amount of physical memory available to processes running on the server. MemoryCommitted Bytes is the amount of committed virtual memory. If the server has very little available memory, you might need to add memory to the system. In general, you want the available memory to be no less than 5 percent of the total physical memory on the server. If the server has a high ratio of committed bytes to total physical memory on the system, you might need to add memory as well. In general, you want the committed bytes value to be no more than 75 percent of the total physical memory. |
Memory page faults | MemoryPageFaults/sec MemoryPagesInput/sec MemoryPageReads/sec | A page fault occurs when a process requests a page in memory and the system can’t find it at the requested location. If the requested page is elsewhere in memory, the fault is called a soft page fault. If the requested page must be retrieved from disk, the fault is called a hard page fault. Most processors can handle large numbers of soft faults. Hard faults, however, can cause significant delays. Page Faults/sec is the overall rate at which the processor handles all types of page faults. Pages Input/sec is the total number of pages read from disk to resolve hard page faults. Page Reads/sec is the total disk reads needed to resolve hard page faults. Pages Input/sec will be greater than or equal to Page Reads/sec and can give you a good idea of your hard page fault rate. If there are a high number of hard page faults, you may need to increase the amount of memory or reduce the cache size on the server. |
Memorypaging | MemoryPoolPaged Bytes, MemoryPoolNonpaged Bytes | These counters track the number of bytes in the page and nonpaged pool. The paged pool is an area of system memory for objects that can be written to disk when they aren’t used. The nonpaged pool is an area of system memory for objects that can’t be written to disk. If the size of the page pool is large relative to the total amount of physical memory on the system, you might need to add memory to the system. If the size of the nonpaged pool is large relative to the total amount of virtual memory allocated to the server, you might want to increase the virtual memory size. |
The CPU does the actual processing of information on your server. As you examine a server’s performance, you should focus on the CPU after memory bottlenecks have been eliminated. If the server’s processors are the performance bottleneck, adding memory, drives, or network connections won’t overcome the problem. Instead, you might need to upgrade the processors to faster clock speeds or add processors to increase the server’s upper capacity. You could also move processor-intensive applications, such as SQL Server, to another server.
Before you make a decision to upgrade CPUs or add CPUs, you should rule out problems with memory and caching. If signs still point to a processor problem, you should monitor the performance counters discussed in Table 3-2. Be sure to monitor these counters for each CPU installed on the server.
Table 3-2. Uncovering Processor-Related Bottlenecks
Issue | Counters to Track | Details |
|---|---|---|
Threadqueuing | SystemProcessor Queue Length | This counter displays the number of threads waiting to be executed. These threads are queued in an area shared by all processors on the system. If this counter has a sustained value of two or more threads, you’ll need to upgrade or add processors. |
CPU usage | Processor\%Processor Time | This counter displays the percentage of time the selected CPU is executing a nonidle thread. You should track this counter separately for all processor instances on the server. If the % Processor Time values are high while the network interface and disk I/O throughput rates are relatively low, you’ll need to upgrade or add processors. |
With today’s high-speed disks, the disk throughput rate is rarely the cause of a bottleneck. That said, however, accessing memory is much faster than accessing disks. So, if the server has to do a lot of disk reads and writes, the server’s overall performance can be degraded. To reduce the amount of disk I/O, you want the server to manage memory very efficiently and page to disk only when necessary. You can monitor and tune memory usage as discussed in the section entitled "Monitoring and Tuning Memory Usage," earlier in this chapter.
Beyond the memory tuning discussion, you can monitor some counters to gauge disk I/O activity. Specifically, you should monitor the counters discussed in Table 3-3.
Table 3-3. Uncovering Drive-Related Bottlenecks
Issue | Counters to Track | Details |
|---|---|---|
Overall drive performance | PhysicalDisk\% Disk Time in conjunction with Processor\% Processor Time and Network Interface ConnectionBytes Total/sec | If the % Disk Time value is high and the processor and network connection values aren’t high, the system’s hard disk drives might be creating a bottleneck. Be sure to monitor % Disk Time for all hard disk drives on the server. |
Disk I/O | PhysicalDiskDisk Writes/sec, Physical DiskDisk Reads/sec, Physical DiskAvg. DiskWrite Queue Length, Physical DiskAvg. DiskRead Queue Length, Physical DiskCurrentDisk Queue Length | The number of writes and reads per second tell you how much disk I/O activity there is. The write and read queue lengths tell you how many write or read requests are waiting to be processed. In general, you want there to be very few waiting requests. Keep in mind that the request delays are proportional to the length of the queues minus the number of drives in a redundant array of independent disks (RAID) set. |
No other factor counts for more in the way a user perceives your server’s performance than the network that connects your server to the user’s computer. The delay, or latency, between when a request is made and the time it’s received can make all the difference. If there’s a high degree of latency, it doesn’t matter if you have the fastest server on the planet. The user experiences a delay and perceives that your servers are slow.
Generally speaking, the latency the user experiences is beyond your control. It’s a function of the type of connection the user has and the route the request takes to your server. The total capacity of your server to handle requests and the amount of bandwidth available to your servers are factors under your control, however. Network bandwidth availability is a function of your organization’s network infrastructure. Network capacity is a function of the network cards and interfaces configured on the servers.
The capacity of your network card can be a limiting factor in some instances. Most servers use 10/100 network cards, which can be configured in many ways. Someone might have configured a card for 10 Mbps, or the card might be configured for half duplex instead of full duplex. If you suspect a capacity problem with a network card, you should always check the configuration.
To determine the throughput and current activity on a server’s network cards, you can check the following counters:
NetworkBytes Received/sec
NetworkBytes Sent/sec
NetworkBytes Total/sec
Network Current Bandwidth
If the total bytes per second value is more than 50 percent of the total capacity under average load conditions, your server might have problems under peak load conditions. You might want to ensure that operations that take a lot of network bandwidth, such as network backups, are performed on a separate interface card. Keep in mind that you should compare these values in conjunction with PhysicalDisk\% Disk Time and Processor\% Processor Time. If the disk time and processor time values are low but the network values are very high, there might be a capacity problem. Solve the problem by optimizing the network card settings or by adding a network card. Remember, planning is everything—it isn’t always as simple as inserting a card and plugging it into the network.