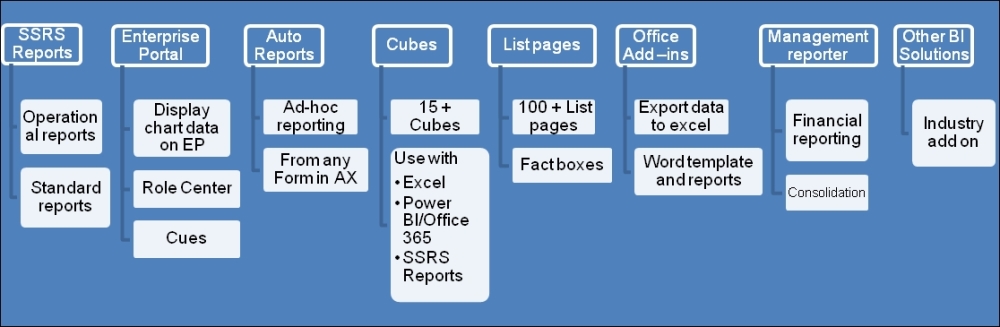
Microsoft Dynamics AX provides various tools for reporting. It is important to get familiar with all these tools in your Dynamics AX toolbox so that you can use them appropriately.
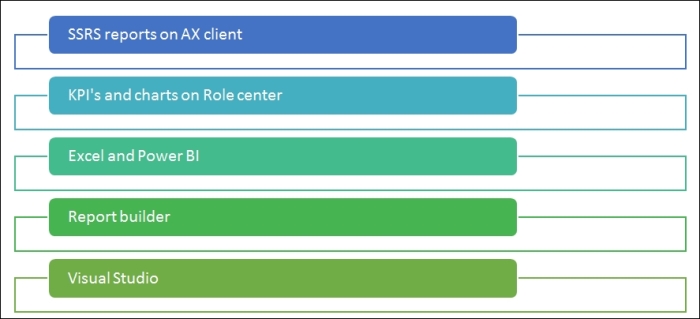
The following diagram shows the various reporting tools available for reporting in Dynamics AX.
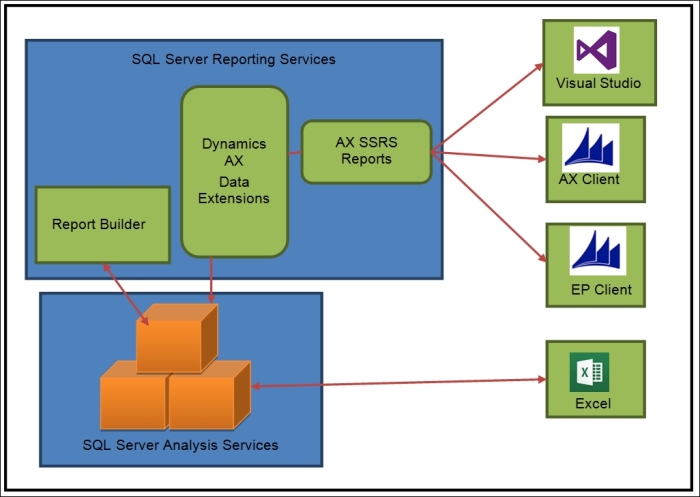
The Microsoft SQL Server Reporting server is the Server report platform for Dynamics AX. Dynamics AX delivers hundreds of reports out of the box, which can be deployed on the SQL Server reporting services. The following diagram shows the basic architecture and the data flow between the Dynamics AX Client, Report server, and the Application Object Server (AOS):
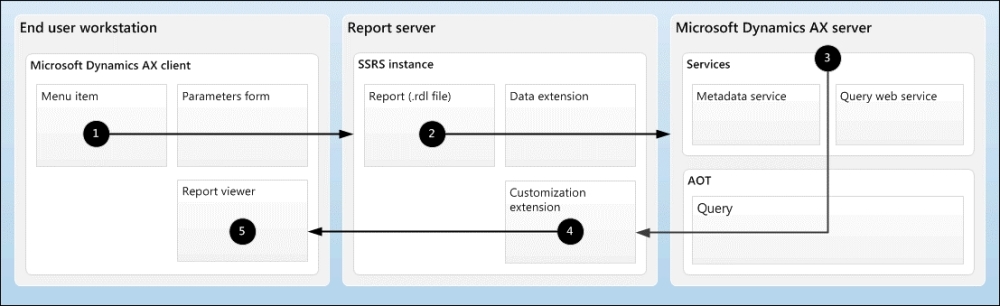
As shown in the preceding diagram, when a report is accessed via the AX Client, the following events happen:
- The AX client first opens the parameter form to gather the input criteria for the report and makes a request to the report server for report definition (an RDL file).
- The Report server retrieves the report request and retrieves the metadata and data from the AOS server.
- AOS examines the request, validates the security, and retrieves data for the query and returns the metadata and data to reporting services.
- The Report server customization extension renders and formats the report and sends a visual representation to the Dynamics AX client.
- The AX client displays the report on the report viewer control.
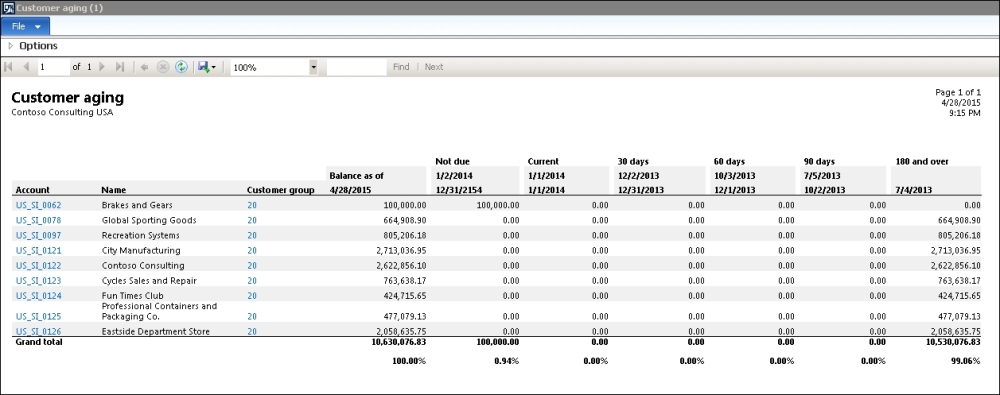
Dynamics AX ships with thousands of prebuilt SSRS reports, ranging from simple master data reports to complex reports with chart controls and graphs. There are more than a thousand out-of-the-box SSRS reports delivered with the Dynamics AX installation. There are several hundred country-specific reports available as well for local government and legal compliance.
The following screenshot displays a few sample SSRS reports in Dynamics AX:
The key features of SSRS reports are as follows:
- 1000-plus out-of-the-box reports
- The Dynamics AX batch framework can be utilized to schedule reports and save the output
- Export to the Excel, PDF, CSV, and e-mail attachments
SSRS reports are useful for predefined purposes/layouts and ongoing operational reporting, such as customer aging, vendor aging, ledger account statement, customer statement, Subledger/GL reconciliation reports, shipped not invoiced, accrued purchases, and inventory value reporting.
SSRS reports are not useful for very large datasets and ad hoc needs, such as adding columns and grouping by different fields. In some cases, export to Excel while using SSRS reports may not be very user friendly.
You can refer to https://technet.microsoft.com/en-us/library/hh334471.aspx for more details about the out-of-the-box delivered reports in Dynamics AX.
EP chart controls can be used to display chart data on the Dynamics AX Enterprise Portal (EP). Chart controls provide better performance than SSRS reports for reporting on EP. Chart controls can display data using the report data provider class or analysis server cubes.
EP is deployed with many predefined charts that are associated with user profiles. In addition to this, new charts can be developed. The following chart shows an example chart control on an EP page:
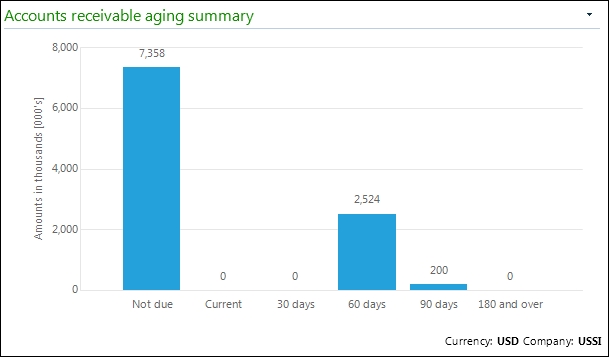
EP chart controls are useful for the light-reporting option on the enterprise portal and Role Center pages to build dashboards for executive users.
EP chart controls are useful to perform operational reporting.
Cues allow users to see their work queue and continue to execute tasks rather than run and review reports to search for transactions that require action. It is a powerful tool that should be leveraged to avoid the expense of creating custom-reporting solutions.
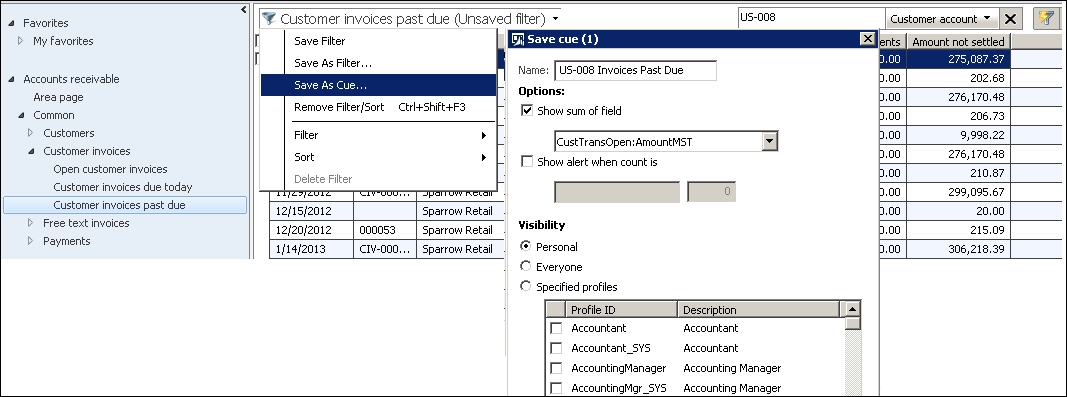
Cues can be created by the users based on the filters that they use to filter the transactions that need their attention in List Pages. This is the best way to work on exceptions that the business needs to manage, such as purchase orders due but not received (buyers in purchasing need to stay on top of such POs and get new ETA from vendors), customer invoices past their due dates, project activities assigned to me, and back orders past due.
The following screenshot shows how simple it is to create a new queue and how the cue information is displayed on the Role Center page:
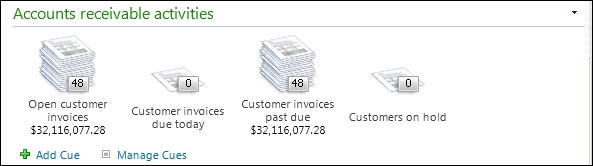
Cues are good for building and managing work cues, adding all the cues to the home page rather than the users going to multiple forms to track them.
Data on the cues are loaded every time the user opens the Role Center page. Cues with complex calculations can cause performance issues on loading the page.
The AX auto-report wizard is an ad hoc reporting option that can be used by business users to print the data displayed on the form. Using this option, the user can generate an auto-report for one-time use, or you can create and save a custom auto-report that can be reused later.
The following screenshot illustrates how to generate an auto-report from the Vendor list page:
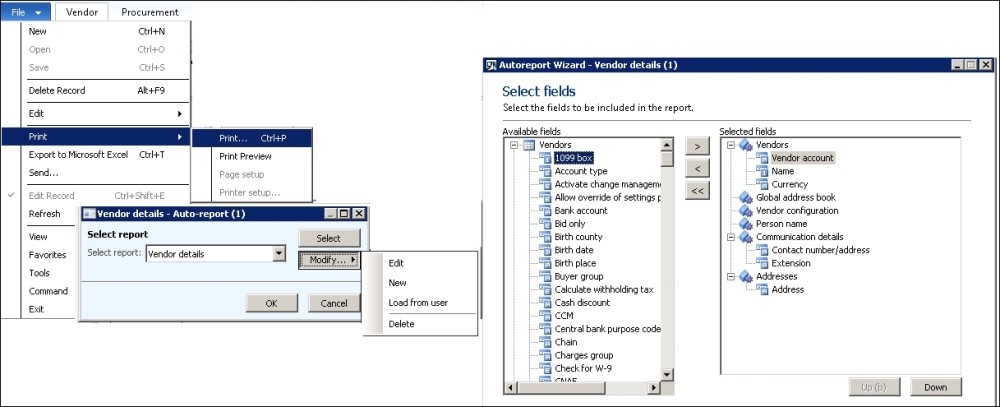
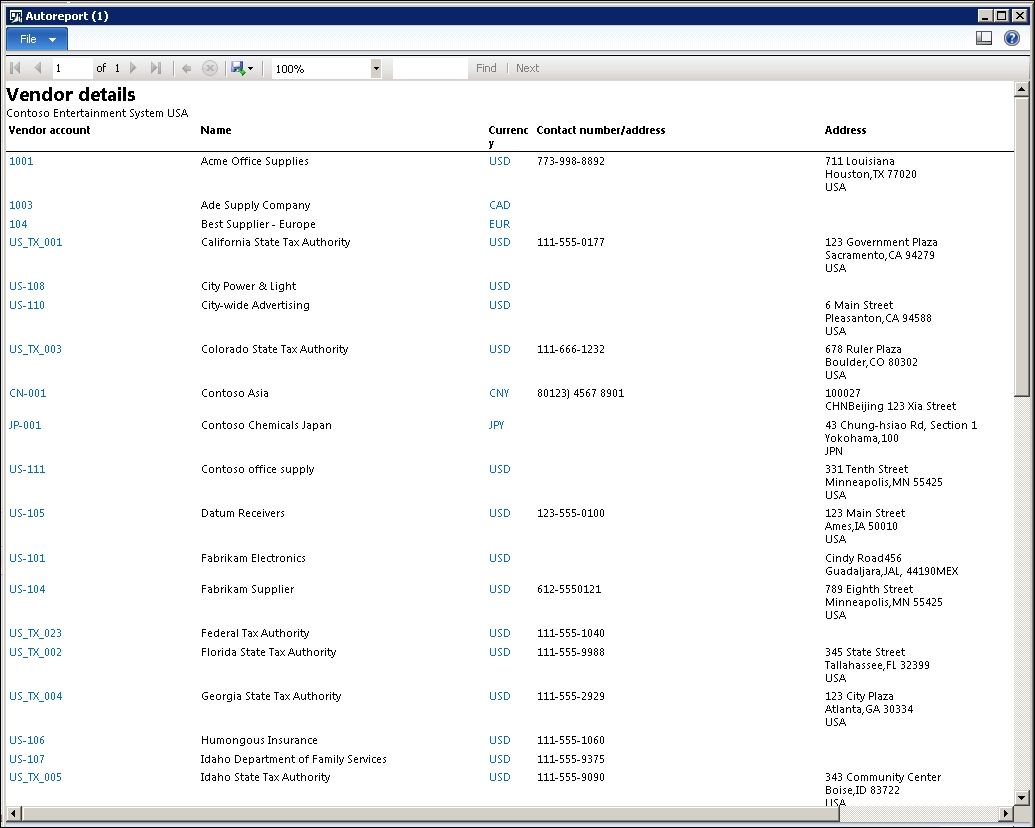
This is useful to perform ad hoc reporting from the AX client and printing the data available on the form for analysis. For example, printing vendor details in a report format.
Complex report layouts and calculations are not possible using AX auto-reports. You can just print data in a basic, tabular report layout.
The TechNet article at https://technet.microsoft.com/en-us/library/gg213177.aspx explains the step-by-step instructions to use the AX Auto report wizard to generate custom ad hoc reports.
Dynamics AX allows you to apply filters and sort rows based on specific criteria. Users can add more fields to form the layout through personalization.
Once you have all the data points on the form, export to Excel (Ctrl + T) can be used to get the data in Excel for further review. The following screenshot shows this:
This is useful when reviewing data such as ledger account transactions, customer transactions, and so on for ad hoc purposes.
This is not useful for large datasets and data with complex calculations—you do not want to start using Excel to build complex macros and formulae to get the results you are looking for.
Microsoft Dynamics AX uses the SQL Server Analysis Services (SSAS) platform for business intelligence and analytics reporting. The Dynamics AX database has been highly normalized with the release of Dynamics AX 2012. This helps with the performance and scaling of OLTP databases. However, it creates challenges for reporting. Hence, cubes are the best way to put together data in flat table formats, making it easy for reporting.
Dynamics AX provides several default cubes out of the box, which can be used as they are or customized as per your specific reporting needs.
The following diagram shows the high-level architecture of Dynamics AX analytics and components to access cube data:
Here are a few considerations to note while building your cubes:
- Full refresh versus incremental updates: Consider the frequency of updates and the volume/projected growth of data. You don't want cube refresh taking an exponentially longer amount of time as the data grows in volume.
- Building new versus modifying the existing cubes provided by Microsoft: Every business has their unique requirements of reporting. You can use Standard Dynamics AX as a starting point and build on top of that.
- Performance considerations: You may need a completely different set of indexes based on the searches that would be performed by the end users.
- Consider using 64-bit Excel for power users: Super users may end up analyzing large volumes of data in Excel. Plan to make 64-bit Excel versions available to them locally or through a terminal server to support high resource utilization of Excel.
- Cubes to reference data sources outside Dynamics AX: For example, the CRM system, or the legacy data warehouse (and it would save the efforts for data migration).
- Data Security: Exposure to sensitive information stored in Cubes.
This is useful to perform analytical reporting, such as Sales by region, Sales by quarters, Spend Analysis, and so on. This supports ad hoc reporting and the analysis needs of marketing, sales users, and controllers especially. This is not useful for reports that require real-time data.
For more information about the default cubes that are included with Dynamics AX, refer to https://technet.microsoft.com/en-us/library/jj710378.aspx.
There are a number of ways in which you can use cubes provided with Dynamics AX. The following are some common ways to access cube data:
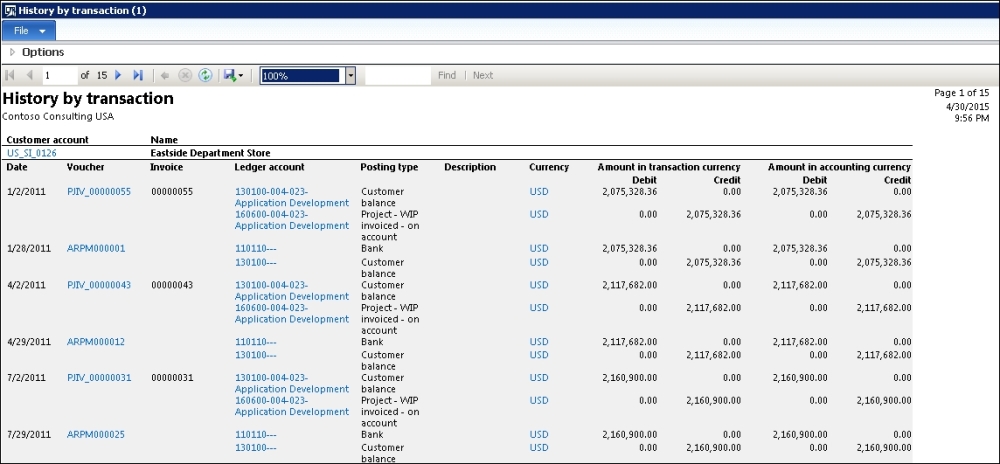
There are several existing standard AX SSRS reports utilizing the existing cube data to display reports within the Dynamics AX client.
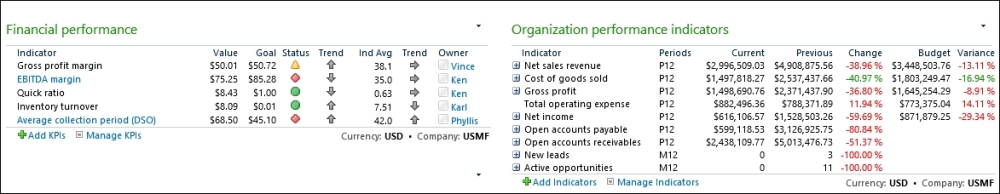
You can add Cubes KPIs on the AX Role Center pages. The following screenshot shows KPIs on AX Role Center:
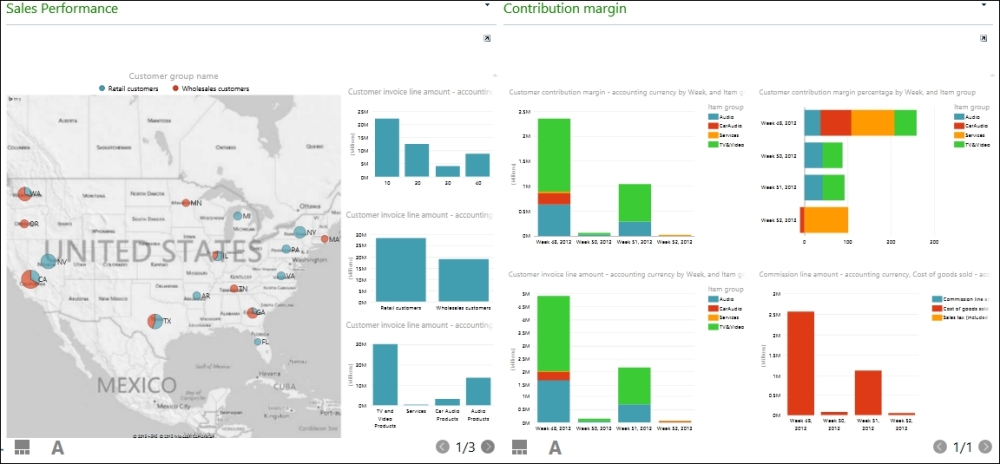
Business users can use Excel to import cube data and create pivot tables. They can also use Power BI for Office 365 to build interactive reports and embed in role center pages as shown in the following screenshot:
The Report Builder is a tool within the SQL server reporting services and can be used to build ad hoc reporting using the Dynamics AX analysis cube data.
Management Reporter is an embedded Financial reporting tool provided by Microsoft Dynamics AX. Microsoft has made significant investments in Management Reporter in recent years, and it has paid off with this enterprise-ready tool meant to replace the Financial Statement setup in the General Ledger module.
The following are the key features of Management Reporter:
- Flexible report design
- Saves dimension combinations, and reuses the dimension for multiple reports
- Controls dimension descriptions and formatting
- The Missing account analysis feature to identify accounts or dimensions that have been omitted from the report building blocks
- Format headers to roll forecasts
- Default report definitions that offer predefined reports for the balance sheet, income statement, and cash flow statement, as well as other financial reports that can be modified to meet customer requirements
- Interactive reporting
- Creates a chart based on selected report rows and columns
- Drills down to the original transaction in Dynamics AX
- Views or shares reports in a web browser
- End user tool: Finance team can make report designs and changes as needed
- Tight integration with Microsoft Dynamics AX
- Defines rollups (reporting tree) across financial dimensions or legal entities. You can use organizational hierarchies defined in Dynamics AX.
- Supports multicurrency, multi-company reporting along with eliminations and consolidations.
- Has its own data warehouse and does not impact the OLTP database for reporting. Very useful for organizations with high volume transactions.
- Financial report collaboration
- Schedules reports to automatically generate on a daily, weekly, monthly, or yearly basis
- Generates a report in multiple formats, such as XPS, Excel, and so on
- Publishes reports to SharePoint or a network drive
- Shares reports using e-mail with a link to report
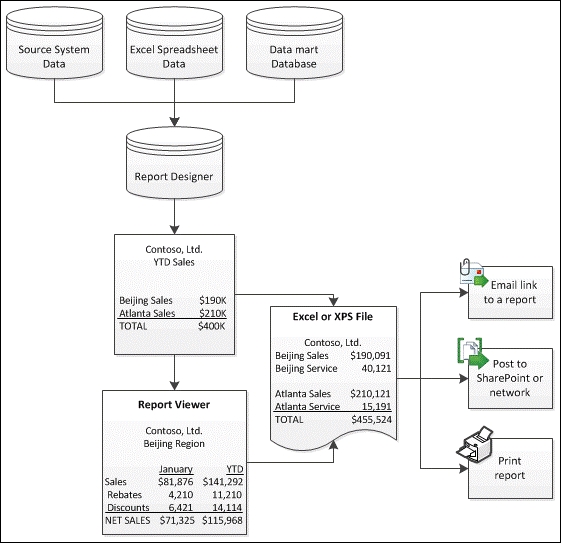
The following diagram shows the high-level flow of financial information data in the management reporter:
This is useful when performing financial reporting, such as generating the balance sheet, profit and loss statement, cash flow statement, budget versus actual analysis, and others.
This is also used to perform consolidated financial reporting (soft consolidation and eliminations in management reporter).
This is useful when performing management reporting based on segments and posting layers (operations and tax layers in Dynamics AX allow maintaining multiple sets of books for management and tax reporting).
This is not useful if you want to perform sub-ledger and operational reporting.
List pages provide a quick and easy way to view a group of similar records. There are two types of list pages—primary and secondary. Primary list pages display a set of records and the secondary list pages display a subset of those records. List pages also contain fact boxes that typically display information related to the selected records.
List pages are a great alternative to operational reports as they display the relevant data on a single screen and provide the quick-filter ability.
The following screenshot shows list pages in the Account Receivable module of the AX client. As you can see, All sales orders is a primary list page that displays all the sales orders in the selected legal entity. There are several secondary list pages, as shown in the image to display the subsets of the sales orders:
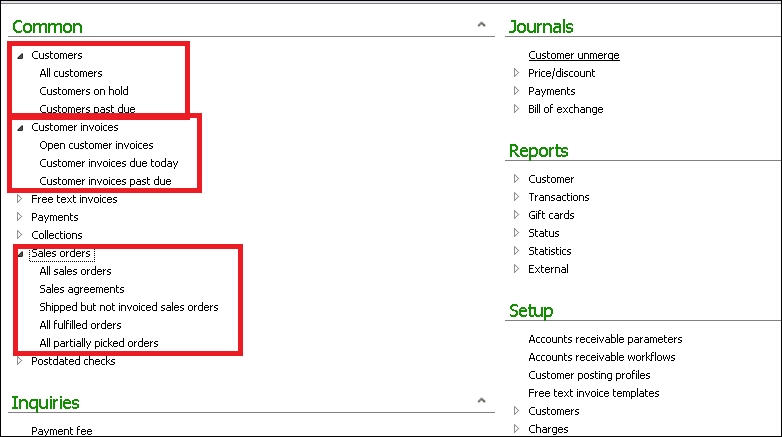
This is useful for day-to-day operational reporting, such as list of open sales orders, delivered sales orders/not yet invoiced, and so on.
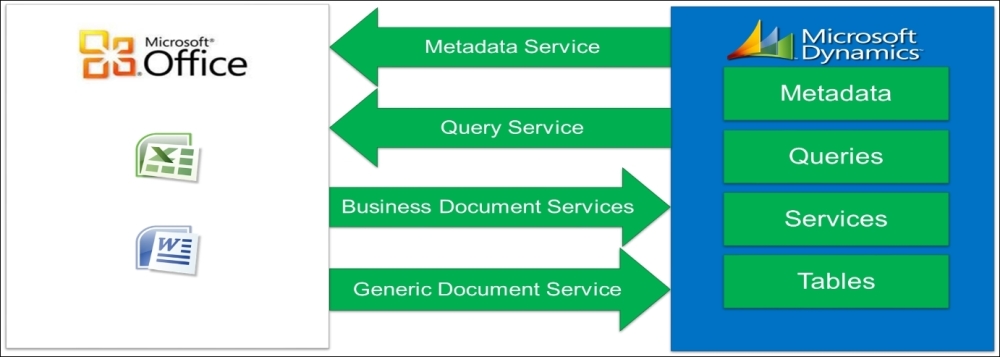
Office Add-ins for AX 2012 is a great tool to work with Dynamics AX data. Office add-ins provide the ability to generate documents based on the AX data and can be used to perform ad hoc reporting by business users. Excel add-ins also provides the ability to manipulate and import data back into Dynamics AX. The following diagram shows the high-level architecture of Office Add-Ins with Dynamics AX:
Word add-ins can be used to create a document template and can be used for light reporting based on the templates personalized for the customer.
The following screenshot shows the use of Word add-ins to generate a personalized sales quotation using the AX data:
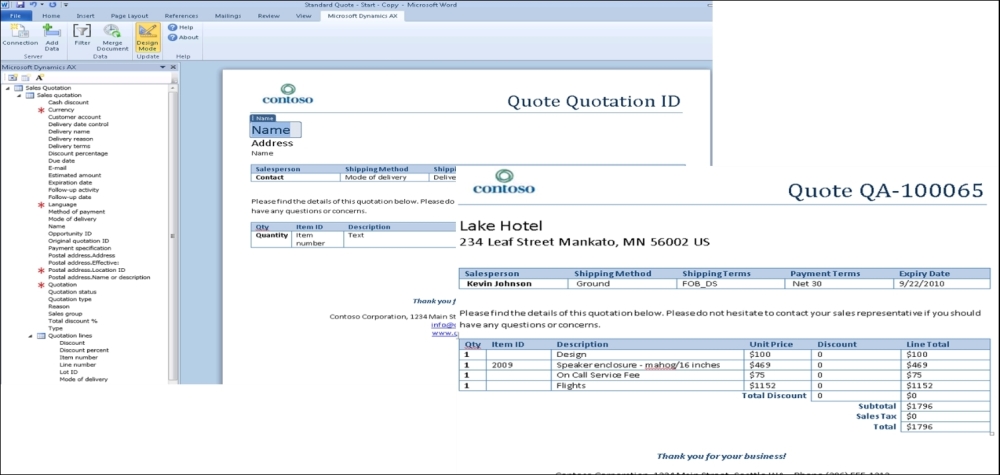
This is useful for performing light manual reporting based on custom templates.
This is not useful if you want to perform high-volume reporting.
Refer to the TechNet article for a step-by-step guide to using Word Add-ins at https://technet.microsoft.com/en-us/library/hh781090.aspx.
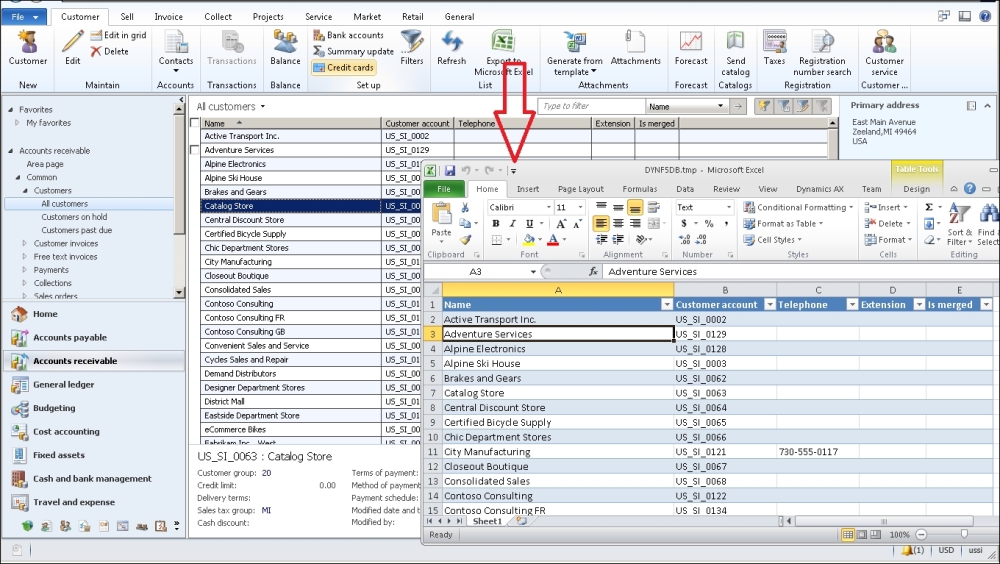
Excel add-ins can be used as another powerful, ad hoc reporting tool with Dynamics AX. A user can export data from any Dynamics AX form with just a click of a single button. AX 2012 Excel add-ins enables users to add additional columns, formatting, and to refresh data within Excel. The following screenshot shows the use of Excel add-ins to export the AX form data into Excel, adding additional fields, and formatting in the design mode:
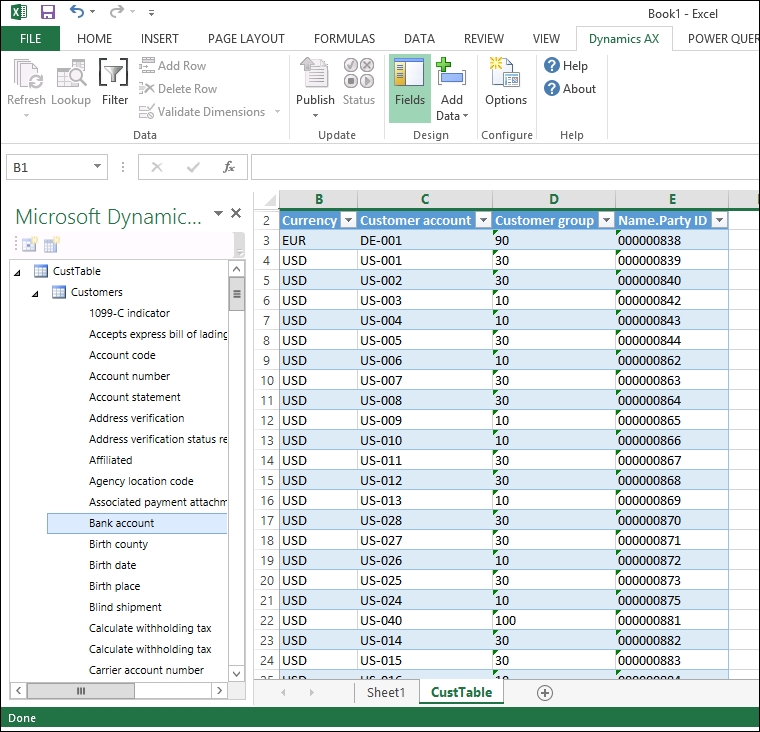
Using Excel Add-in, a user can also create an Excel template and share it with a coworker. This is also useful when performing ad hoc reporting and data analysis. This is not useful for high-volume data, complex design, and calculations.
For complete information on what the users can do using the Excel add-ins, refer to the TechNet article at https://technet.microsoft.com/en-us/library/hh781099.aspx.
There are several independent and partner software vendors providing specialized BI solutions for Dynamics AX. The following table shows vendors providing add-on BI solutions for Dynamics AX:
|
Vendor Name |
Solution |
References |
|---|---|---|
|
Microsoft |
Power BI | |
|
ZAP BI |
ZAP for Microsoft Dynamics AX |
http://www.zapbi.com/DiscoverZAP/BYAPPLICATION/MicrosoftDynamicsAX.aspx |
|
TargIT |
TARGIT Accelerators | |
|
BI4Dynamics |
BI for Dynamics AX | |
|
Solver BI360 |
BI 360 | |
|
Globe Software |
Atlas-Desktop |
These are useful for when you want to perform advanced and specialized BI reporting.