Stepping through the code line-by-line or function-by-function can take forever. Luckily, there is an easy way to tell the debugger to stop right where we want it to.
- Create and save the same codeunit discussed in the Using the debugger recipe in this chapter.
- Design the codeunit.
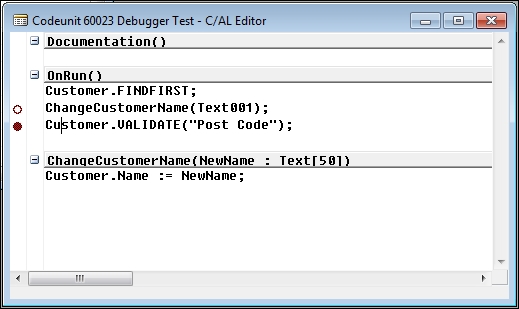
- Go to the following line of code in the
OnRuntrigger:ChangeCustomerName(Text001);
- Press F9 twice.
- Then go to the following line of code in the
OnRuntrigger:VALIDATE("Post Code"); - Press F9 once.
- Your window should look like the following screenshot:
- Save and close the codeunit.
- From the Tools menu of the Microsoft Dynamics NAV Development Environment page, navigate to Debugger | Debug Session (Shift + Ctrl + F11).
- From the debugger window, select the user session and click on Debug (Ctrl + Shift + S) to activate the debugger.
- On execution of the codeunit, the system will take you to the debugging window; the debugging screen should be identical to the following screenshot:

While running the debugger on this codeunit, it should stop on the Customer.VALIDATE ("Post Code") line of code. This is because we have set a breakpoint here, which was the filled red circle at the left of that line. The debugger stops right where we tell it to, that is, right before that line of code executes. There is another mark; it is a red circle that is not filled. This is used to mark old breakpoints that we are not currently using. This is useful when we are trying to debug large amounts of code and want to temporarily remove a breakpoint or remember where we had one.
The debugger is not perfect by any means. Some might even say it has a mind of its own sometimes. It doesn't always stop exactly where you want it to. It is a common practice to set a breakpoint on a few successive lines of code in order to ensure that you stop in the general area.
The NAV 2013 debugger is pretty advanced as compared to the old versions. It provides some nice options related to breakpoints.
By selecting the Toggle action, we can add or remove breakpoints while debugging:

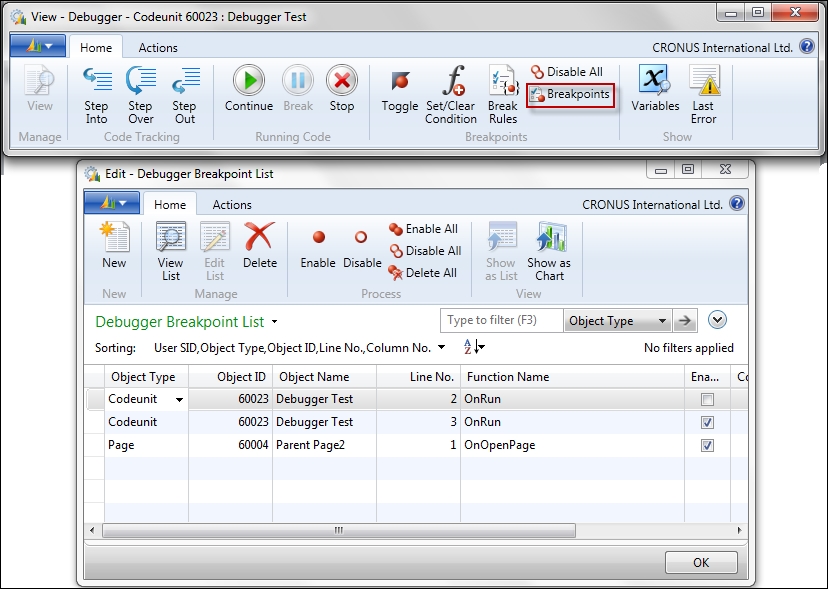
The Breakpoints action will provide the list of all breakpoints and options to enable or disable them:
The following three options are provided under the Break Rules action:
- Break on Error: Debuggers break the execution when an error occurs.
- Break on Record Changes: If a record is going to be changed by using
INSERT,MODIFY,MODIFYALL,DELETE, andDELETEALL, this option will break the execution before the change happens. - Skip Codeunit 1: The codeunit
1is the base set of functions for NAV, which is used in almost all actions/executions. This option will skip the codeunit1from the debugger.
The following screenshot shows the options in the Break Rules action:
