9
Data Cleansing in the Cloud with Dataflows
Power BI dataflows are a new, robust, self-service extract, transform, load (ETL) option in the Power BI service. Dataflows allow you to use the Power Query Editor online and leverage your transformational work in a reusable format, both individually and with other people. Currently, you can save dataflows in your Power BI workspaces and your organization’s Azure Data Lake Storage account. When created in Power BI, dataflows are always categorized as analytical dataflows, in contrast to the dataflows created in “Power Apps”, which may be analytical or standard. These are saved in Microsoft’s Dataverse. In this chapter, we cover analytical dataflows created in the Power BI service.
Dataflows help organizations unify data from disparate sources and prepare it for modeling. They provide the familiarity of the Power Query Editor experience using a GUI with M code in the background so that you can create reusable, scalable, and extensible data source solutions for your organization.
Analysts can easily create dataflows using familiar self-service tools. Dataflows are used to ingest, transform, integrate, and enrich big data by defining data source connections, ETL logic, refresh schedules, and more. Power BI dataflows operate with a new model-driven calculation engine based on Microsoft’s Common Data Model in the backend. Power BI dataflows make the process of data preparation more manageable, more deterministic, and less cumbersome for data analysts and report creators alike. In simplistic terms, Power BI dataflows allow analysts and report creators to create a self-service data mart solution with a few clicks.
In this chapter, we will get you started on your Power BI dataflow journey, covering the following topics on the way:
- Getting started with dataflows
- Creating a dataflow
- Using dataflows as a data source in the desktop
Let’s start by covering the basics to build a strong foundation of knowledge that you can build on in your projects!
Getting started with dataflows
Power BI dataflows can be simple or complex depending on your needs—and licensing. Licensing and workspace capacity are key factors in how you can leverage Power BI dataflows. It is important to research your organization’s governance and overall architecture to conform to best practices. Below is a table from the Microsoft documentation that outlines the features and type of Power BI license needed.
|
Feature |
Power BI |
|
Store data in Dataverse tables (standard dataflow) |
N/A |
|
Store data in Azure Data Lake Storage (analytical dataflow) |
Power BI Pro / Power BI Premium |
|
Store data in customer-provided Azure Data Lake Storage (analytical dataflow; bring your own Azure Data Lake Storage) |
Power BI Pro / Power BI Premium |
|
The enhanced compute engine (running on Power BI Premium capacity / parallel execution of transforms) |
Power BI Premium |
|
DirectQuery connection to dataflow |
Power BI Premium |
|
AI capabilities in Power BI |
Power BI Premium |
|
Linked entities |
Power BI Premium |
|
Computed entities (in-storage transformations using M) |
Power BI Premium |
|
Schedule refresh |
Power BI Pro / Power BI Premium |
|
Dataflow authoring with Power Query Online |
Power BI Pro / Power BI Premium |
|
Dataflow management |
Power BI |
|
Feature |
Power BI |
|
New connectors |
Power BI Pro / Power BI Premium |
|
Standardized schema, built-in support for Common Data Model |
Power BI Pro / Power BI Premium |
|
Dataflow data connector in Power BI Desktop |
Power BI Pro / Power BI Premium |
|
Dataflow incremental refresh |
Power BI Premium |
For the sake of simplicity, we are giving the basic features with the Power BI Pro license; however, it may be worth a deeper dive into Microsoft’s documentation to truly uncover all the dataflow features and administrative requirements needed to use all the Power BI Premium features (find out more at https://learn.microsoft.com/en-us/power-bi/transform-model/dataflows/dataflows-introduction-self-service).
In the next section, we will create a practical, reusable dataflow. But before moving to that step, let’s review the key differences between a dataflow and a datamart, a new preview feature that will soon be generally available.
Exploring datamarts
Datamarts are available as a preview feature with Power BI Premium (capacity or per user), and it is a self-service, no-code solution that allows citizen developers and business report writers to create a relational database through a GUI in the Power BI service. It allows business groups to bypass the barriers of standard development, while still giving developers the ability to query the data and access it through standard developer tools.
Rather than view dataflows and datamarts as totally disparate options that compete, it’s important to recognize that they may work together right now. Microsoft provides the following guidelines for when to use each feature:
- Use dataflows when you need to build reusable and shareable data prep for items in Power BI. This may feed your datamart, or it may stand alone. Great use cases are calendars, HR employee lists, location tables, and so on.
- Use datamarts when you need to:
- Sort, filter, and do simple aggregation visually or through expressions defined in SQL
- Provide outputs that are results, sets, tables, and filtered tables of data
- Provide accessible data through a SQL endpoint
- Enable users who don’t have access to Power BI Desktop
This next step in Power BI’s digital revolution is meant to bridge the gap between IT and business report creators who may not have all the skills, but certainly have the need, for the benefits of a relational database. These benefits include creating row-level security, synching refresh schedules, incremental refreshes, and decoupling the data storage from the report package. Datamarts leverage Azure SQL Database for backend storage of the data, and this is in contrast with dataflows, which are stored as flat files in Azure Data Lake Storage Gen2.
Datamarts use a special dataflow that sends data to a fully managed and automatically provisioned Azure SQL database, which then creates a DirectQuery dataset from Azure SQL Database as its source data. This is all done through a single web UI in the Power BI service and exists as one package. It’s suggested that this integrated experience of data modeling and DAX authoring may allow MAC users to more easily leverage Power BI, because it’s all online.
Now that we have covered the newest evolution in the Power BI service, let’s continue to build our dataflow.
Creating a dataflow
A very common reason to use dataflows is the reusability of data among team members. Consistency and having a single source of truth is the main goal for many analysts, and a great application of this is a Date table. For this exercise, a Pro license with no additional premium capacity is necessary. In this section, we will explore the Power BI service to see where dataflows are created and then use simple code to produce a dataflow that will work in many different data models.
Dataflows are reusable extract, transform, and load (ETL) packages created and managed in the Power BI service, while the data you bring into a Power BI dataflow is stored as entities—basically flat tables—in the Common Data Model folders in Azure Data Lake Storage Gen2. These files are stored as CSVs with JSON files containing all the metadata and rules, which unify and standardize your self-service data warehouse. Once created, these dataflows then serve as a data source for Power BI reports, and can also be used with other Azure data services if you bring your own data lake.
In order to create a Power BI dataflow, you need a new workspace experience. This has been the default for some time now—you cannot use Power BI dataflows in much older workspaces. When creating the workspace, there are advanced options to set up dedicated dataflow storage capacity—in other words, to connect your own data lake for additional storage capacity and options within the Azure ecosystem. Be sure to read the extensive admin documentation if your goal is to use your own data lake as the backend storage, rather than leveraging the default experience.
One key point is that you will want to ensure your capacity is set to the same region as your other Azure resources. Using My Workspace will never work, regardless of the region and capacity, because My Workspace is a personal folder that’s not designed for sharing data organizationally.
First, create a new workspace in your version of Power BI. A key detail is that the creator of the dataflow becomes the owner by default. Previously, ownership could not be transferred, but now there is an option to pass dataflow ownership to another Power BI user. The dataflow owner is the primary admin for dataflow functionality and permissions.
Note in Figure 9.1 that you are given the option to bring your own storage, versus the default option of using Microsoft’s general Azure Data Lake that you cannot customize or monitor:
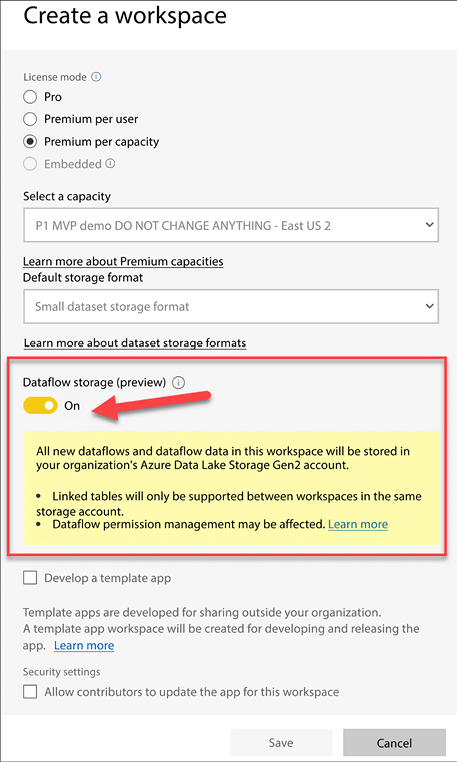
Figure 9.1: Exploring the dataflow settings when creating a PBI workspace
Once the workspace is created (we’ve created one here called Dataflow Test 2022), there is an option for Dataflow under + New toward the upper-left corner of your workspace, as shown in Figure 9.2:

Figure 9.2: Locate the Dataflow option in your workspace
When this option is selected, you will see a popup related to the new datamarts feature:

Figure 9.3: Confirm your selection to create a dataflow
Confirm that you want to create a dataflow and not a datamart, to get started. After selecting No, create a dataflow, more options appear:

Figure 9.4: Dataflow options
It’s worth describing the various options:
- Define new tables: Once a dataflow contains data, you can create computed tables. Computed tables perform in-storage computations and they may be custom, or they can map to the Common Data Model standards.
- Link tables from other dataflows: Link to tables that have branched off from existing tables in the same or different workspaces. They are branches that allow transformation, but one key point is that they do not store data. If linked tables exist in the same workspace as the original tables, refreshes may be coordinated between them. However, different workspaces lead to different refresh schedules.
- Import Model: Import an existing dataflow from its locally stored JSON file.
- Attach a Common Data Model folder (preview): This is the “bring your own data lake” option.
For the Date table dataflow, there is no need for an enterprise Power BI gateway, because it is a Blank query option and the M code will create the table in the Power Query Editor’s native language. In almost all other cases, an Enterprise data gateway is needed, which means a Pro license is also needed—although Premium licenses and capacities offer significantly more analytical resources for your dataflows. Power BI dataflows do not work in My Workspace or with a free license.
When defining the new entity, choosing the data source is the first step. For the M code-scripted date table, selecting Blank query, one of the options toward the bottom, is key.

Figure 9.5: Choose the Blank query option to create this dataflow
At that point, copy the following script, which lets you create a date table, into the Power Query Editor, replacing the default query formula:
//Create Date Dimension
(StartDate as date, EndDate as date)=>
let
    //Capture the date range from the parameters
    StartDate = #date(Date.Year(StartDate), Date.Month(StartDate),
    Date.Day(StartDate)),
    EndDate = #date(Date.Year(EndDate), Date.Month(EndDate),
    Date.Day(EndDate)),
    //Get the number of dates that will be required for the table
    GetDateCount = Duration.Days(EndDate - StartDate),
    //Take the count of dates and turn it into a list of dates
    GetDateList = List.Dates(StartDate, GetDateCount,
    #duration(1,0,0,0)),
    //Convert the list into a table
    DateListToTable = Table.FromList(GetDateList,
    Splitter.SplitByNothing(), {"Date"}, null, ExtraValues.Error),
    //Create various date attributes from the date column
    //Add Year Column
    YearNumber = Table.AddColumn(DateListToTable, "Year",
    each Date.Year([Date])),
    //Add Quarter Column
    QuarterNumber = Table.AddColumn(YearNumber , "Quarter",
    each "Q" & Number.ToText(Date.QuarterOfYear([Date]))),
    //Add Week Number Column
    WeekNumber= Table.AddColumn(QuarterNumber , "Week Number",
    each Date.WeekOfYear([Date])),
    //Add Month Number Column
    MonthNumber = Table.AddColumn(WeekNumber, "Month Number",
    each Date.Month([Date])),
    //Add Month Name Column
    MonthName = Table.AddColumn(MonthNumber , "Month",
    each Date.ToText([Date],"MMMM")),
    //Add Day of Week Column
    DayOfWeek = Table.AddColumn(MonthName , "Day of Week",
    each Date.ToText([Date],"dddd"))
in
    DayOfWeek
You can also go to https://devinknightsql.com/2015/06/16/creating-a-date-dimension-with-power-query/ to access this code.
After pasting, click Next:

Figure 9.6: Paste the M code and select Next
Clicking Next will take us to a screen where date parameters may be specified to determine the length of the table. Take the following steps:
- Input a date range.
- Name the query.
- Select Invoke to create the date table.
- Click Save & close:

Figure 9.7: Set the data range and name the table
Once the date table is created, the data type can be set using the little icon in the top-left corner of the columns, as shown in Figure 9.8. The layout and options of the online Power Query Editor should generally mirror the Power Query Editor in Power BI Desktop:

Figure 9.8: Set the data type on the column in the online Power Query Editor
The graphical user interface (GUI) is being updated regularly to make the dataflow experience more and more like the Power BI Desktop experience. It is worth taking time to look at the top ribbon with its Home, Transform, Add column, and View options to explore the GUI because many options are similar, and some are new, such as Map to entity and AI insights, as shown in Figure 9.9.
AI insights is fully leveraged under a Premium license and provides out-of-the-box artificial intelligence options to analyze your data, with things such as sentiment analysis, keyphrase extraction, language detection, and image tagging:

Figure 9.9: New options available for dataflows in Power BI Desktop that are not in the Power Query Editor
Here is the dialog box for the Map to entity option, which allows users to take the existing fields in the entities and map them to common data model attributes. Users can choose from a list of common tables (entities) and leverage that metadata if they want:

Figure 9.10: New option to map dataflows to the Common Data Model structure
Map to entity does not apply to this date table, but it can be a useful option for other tables, such as sales or accounting tables, where the data types and tables are often very similar across companies, departments, and so forth.
After exploring the options, save the dataflow by selecting the OK button in the bottom-right corner. You will see if your query meets all the criteria in a confirmation box, as shown below:
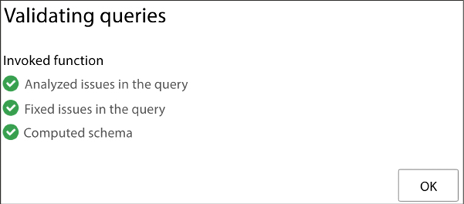
Figure 9.11: Query validation confirmation
Saving will prompt you to enter a name, but does not actually finish the saving process because data is not fully loaded into the dataflow until after it is saved and refreshed:
- Name the dataflow.
- Provide a Description.
- Save the dataflow:
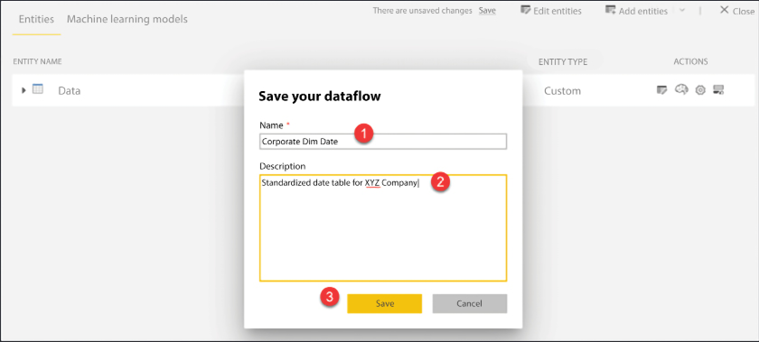
Figure 9.12: Save the dataflow
A pop-up box like the one shown in Figure 9.13 will appear to load the data and finalize the dataflow for use. Refresh now is a one-time option that manually loads the latest data. Dataflows can leverage multiple data sources and allow the unification of disparate sources.
Under a Premium license, incremental data refreshes can be set with Set a refresh schedule to manage the performance impact of data sources that update at different times and rates:

Figure 9.13: Popup with refresh options
If you miss the pop-up option, simply find the dataflow in your workspace and click on one of the refresh icons to set up a schedule or perform a single refresh.
Now that we’ve created a Power BI dataflow that will provide a consistent and standard date table for ourselves and others, we can easily connect to this data source from Power BI Desktop.
Using dataflows as a data source in Power BI Desktop
Power BI dataflows act like any other imported data source. In Power BI Desktop, simply select Get data and then connect to the Dataflows option. From there, all the available dataflows will be available and organized. Once we click Get data and select the dataflow option, a familiar dialog box will appear that shows all the available dataflows we can use.

Figure 9.14: Get data to choose dataflows
As shown in Figure 9.15 below, your table options appear in a list on the left-hand side. Expand the folders and choose the Date table, then select Load to immediately use the table, or select Transform Data if you have more work to do in the Power Query Editor:

Figure 9.15: Expand the folder options and choose the Date dataflow, then Load to use it immediately
It is important to remember that dataflows are not datasets. Datasets are semantic models on top of data, whereas dataflows are built on top of the dataset in a reusable schema. Additionally, dataflows do not truly replace a data warehouse, but they do allow for lighter self-service “data warehousing” tasks for various integration scenarios.
Summary
Congratulations on exploring an exciting option for reusable, standardized data that can bring great benefits to teams who need single sources of truth. In this chapter, we created a date table dataflow using M code and learned about the mechanics of using the Power Query Editor online.
Join our community on Discord
Join our community’s Discord space for discussions with the authors and other readers:
