2
Connecting to Data
Power BI may very well be one of the most aptly named tools ever developed by Microsoft, giving analysts and developers a powerful business intelligence and analytics playground while still packaging it in a surprisingly lightweight application. Using Microsoft Power BI, the processes of data discovery, modeling, visualization, and sharing are made elegantly simple using a single product. These processes are so commonplace when developing Power BI solutions that this book has adopted sections that follow this pattern. However, from your perspective, the really exciting thing may be that development problems that would have previously taken you weeks to solve in a corporate BI solution can now be accomplished in only hours.
Using the Power BI Desktop application enables you to define your data discovery and data preparation steps, organize your data model, and design engaging data visualizations based on your reports. In this chapter, the development environment will be introduced, and the data discovery process will be explored in depth. The topics detailed in this chapter include the following:
- Getting started
- Importing data
- DirectQuery
- Composite models
- Live connection
- Choosing a data connection method
Let’s first start by learning about Power BI at a high level, and understanding what you need on your machine to get started.
Getting started
Power BI is a Software as a Service (SaaS) offering in the Azure cloud and, as such, the Microsoft product team follows a strategy of cloud first as they develop and add new features to the product. Power BI is also one of five members of Microsoft’s Power Platform:

Figure 2.1: Microsoft’s Power Platform suite of tools
Each of the tools within the Power Platform solves distinctly different problems, but what they have in common is who their core user audience is intended to be. The Power Platform and all the tools included within it are designed and built so business users can solve and design solutions on their own rather than relying solely on their IT department. All five tools within the Power Platform leverage Microsoft’s cloud architecture and allow for seamless integration between the different tools. Leveraging the features of each Power Platform tool (Power BI, Power Apps, Power Pages, Power Automate, and Power Virtual Agents) can give your business incredible advantages over the competition.
However, since this book’s focus is on Power BI, if you’re interested in learning more about the other members of the Power Platform, we would recommend reviewing other titles by Packt to explore each.
While Power BI is primarily a cloud application, this does not mean that Power BI is only available in the cloud. Microsoft presents two options for sharing your results with others. The first, most often utilized method is the cloud-hosted Power BI service, which is available to users for a low monthly subscription fee. The second option is the on-premises Power BI Report Server, which can be obtained through either your SQL Server Enterprise licensing with Software Assurance or a subscription level known as Power BI Premium. Both solutions require a development tool called Power BI Desktop, which is available for free, and is generally where you will start to design your solutions.
Power BI Desktop can be found via a direct download link at Power BI (https://powerbi.microsoft.com/en-us/desktop/), or by installing it as an app from the Microsoft Store. There are several benefits of using the Microsoft Store Power BI Desktop app, including automatic updates, no requirement for admin privileges, and making it easier for a planned IT rollout of Power BI.
If you are using the on-premises Power BI Report Server for your deployment strategy, then you must download a different Power BI Desktop, which is available by clicking the advanced download options link at https://powerbi.microsoft.com/en-us/report-server/. A separate installation is required because updates are released less frequently to the non-cloud version of Power BI (Power BI Report Server). This book will be written primarily under the assumption that you are using the cloud-hosted Power BI service as your deployment strategy.
Once you’ve downloaded, installed, and launched Power BI Desktop, you will likely be welcomed by the start-up screen, which is designed to help new users find their way.
Close this start-up screen so that we can review some of the most commonly used features of the application:
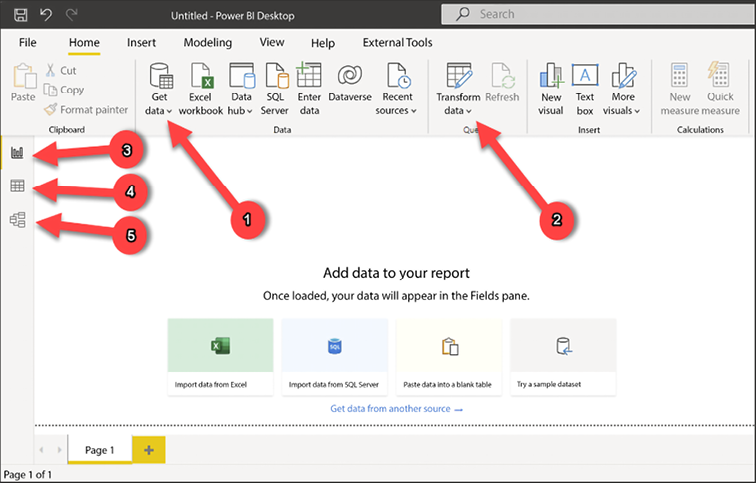
Figure 2.2: First view of the Power BI Desktop
Following the preceding screenshot, let’s learn the names and purposes of some of the most important features in Power BI Desktop:
- Get data: Used for selecting data connectors and configuring data source details.
- Transform data: Launches the Power Query Editor, which is used to apply data transformations to incoming data.
- Report view: Report canvas used for designing data visualizations. This is the default view that’s open when Power BI Desktop is launched.
- Data view: Provides a view of the data in your model. This looks similar to a typical Excel spreadsheet, but it is read-only.
- Model view: Primarily used when your data model has multiple tables and relationships that need to be defined between them.
Now that you have a little familiarity with the basic controls within Power BI Desktop, let’s learn about the options you have for connecting to your various data sources. Power BI is best known for the impressive data visualizations and dashboard capabilities it has. However, before you can begin building reports, you first need to connect to the necessary data sources.
Within Power BI Desktop, a developer has many unique data connectors to choose from, including traditional file types, database engines, big data solutions, cloud sources, data stored on a web page, and other SaaS providers. This book will not cover all the connectors that are available, but it will highlight some of the most popular and common ways to connect to data.
When establishing a connection to a data source, you may be presented with one of three different options regarding how your data will be treated: Import, DirectQuery, or Live Connection. The sections that follow will focus specifically on these options.
Importing data
Choosing to import data, which is the most common option and default behavior, means that Power BI will physically extract rows of data from the selected source and store it in an in-memory storage engine within Power BI. Power BI Desktop uses a special method for storing data, known as xVelocity, which is an in-memory technology that not only increases the performance of your query results but can also highly compress the amount of space taken up by your Power BI solution. In some cases, the compression that takes place can even lower the required disk space by up to one-tenth of the original data source size. This data compression occurs automatically, meaning there is no required configuration step you must do to receive this benefit. The xVelocity engine uses a local unseen instance of SQL Server Analysis Services (SSAS) to provide these in-memory capabilities.
There are consequences to using the Import option within Power BI that you should also consider. These consequences will be discussed later in this chapter, but as you read on, consider the following:
- How does data that has been imported into Power BI get updated?
- What if I need a dashboard to show near real-time analytics?
- How much data can really be imported into an in-memory storage system?
Now that you are familiar with the underlying mechanics of importing data, let’s try it out with a few of the most common data source types, starting with Excel.
Excel as a source
Believe it or not, Excel continues to be the most popular application in the world and, as such, you should expect that at some point, you will be using it as a data source:
- To get started, open Power BI Desktop and close the start-up screen if it automatically appears.
- Under the Home ribbon, you will find the Get data button, which you already learned is used for selecting and configuring data sources. Selecting the down arrow next to the button will show you the most common data connectors, but selecting the center of the button will launch the full list of all available connectors. Regardless of which way you select the button, you will find Excel workbook at the top of both lists.
- Navigate to and open the file called
AdventureWorksDW.xlsxfrom this book’s resources. This will launch the Navigator dialog, shown in the following screenshot, which is used for selecting the objects in the Excel workbook you wish to take data from:

Figure 2.3: The Navigator dialog is used for selecting spreadsheets or tables
- In this example, you can see six separate spreadsheets you can choose from. Clicking once on the spreadsheet name will give you a preview of the data it stores, while clicking the checkbox next to the name will include it as part of the data import. For this example, select the checkboxes next to all of the available objects, then notice the options available at the bottom right.
- Selecting Load will immediately take the data from the selected spreadsheets and import them as separate tables into your Power BI data model. Choosing Transform Data will launch an entirely new window called the Power Query Editor, which allows you to apply data cleansing business rules or transforms to your data prior to importing it. You will learn much more about the Power Query Editor in Chapter 3, Data Transformation Strategies. Since you will learn more about this later, simply select Load to end this example.
Another topic you will learn more about in Chapter 8, Using a Cloud Deployment with the Power BI Service, is the concept of data refreshes. This is important because, when you import data into Power BI, that data remains static until another refresh is initiated. This refresh can either be initiated manually or set on a schedule. This may also require the installation of a data gateway, the application in charge of securely pushing data into the Power BI service. Feel free to skip to Chapter 8, Using a Cloud Deployment with the Power BI Service, if configuring a data refresh is a subject you need to know about now.
SQL Server as a source
Another common source designed for relational databases is Microsoft SQL Server:
- To connect to SQL Server, select the Get data button again, but this time choose SQL Server.
- On your first use of SQL Server, you are asked to choose the type of Data Connectivity mode you would like. As mentioned previously, Import is the default mode, but you can optionally select DirectQuery. DirectQuery will be discussed in greater detail later in this chapter. Expanding the Advanced options provides a way to insert a SQL statement that may be used as your source.
The following screenshot shows that you must provide the server, but the database is optional and can be selected later. For the following example, the Server name property is the only property populated before clicking OK:
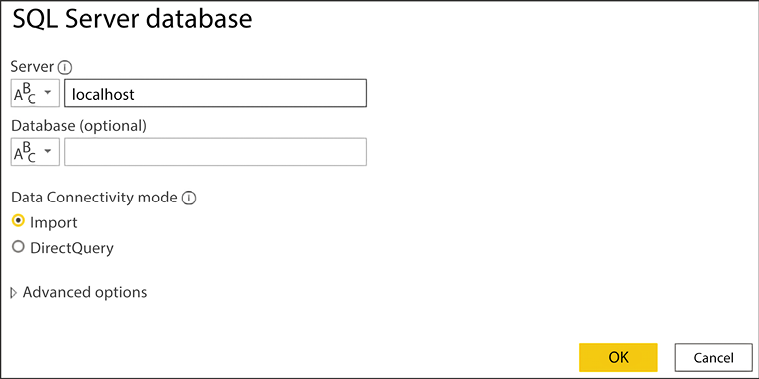
Figure 2.4: Establishing a connection to SQL Server
- Next, you will be prompted, as shown in the following screenshot, to provide the credentials you are using to connect to the database server you provided on the previous screen:
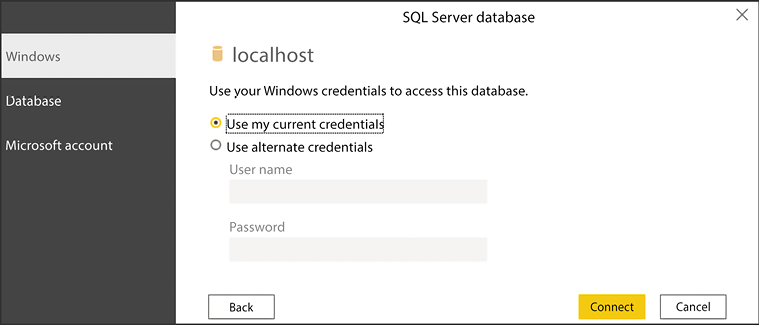
Figure 2.5: Providing credentials to SQL Server
- Click Connect after providing the proper credentials. You may be prompted with a warning stating that Power BI is only able to access the data source using an unencrypted connection. Click OK if you encounter this to launch the same Navigator dialog that you may remember from when you connected to Excel. Here, you will select the tables, views, or functions within your SQL Server database that you wish to import into your Power BI solution. Once again, the final step in this dialog allows you to choose to either Load or Transform Data.
Dataverse as a source
Microsoft Dataverse is becoming an increasingly popular data source to use within Power BI. You can think of Dataverse as the database of Dynamics 365 as well as the Power Platform. Often, Power Apps developers will leverage Dataverse for storing the data they collect from users during their usage of the apps they design. Let’s review the process of connecting to Dataverse within Power BI:
- To connect to Dataverse, select the Get data button and choose Dataverse.
- Next, you will be prompted to sign in with your organization’s Azure Active Directory account. After providing your account details you will click Connect.
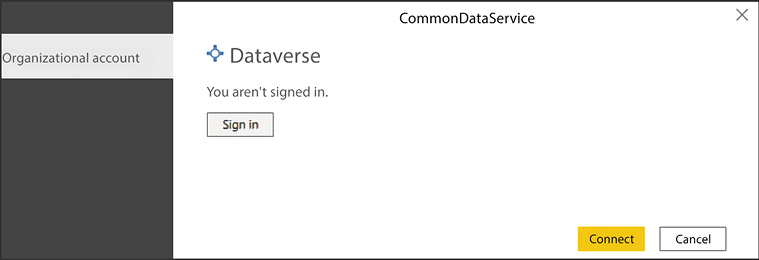
Figure 2.6: Authenticating to Dataverse
- This will yet again bring you to the Navigator dialog where you can choose from your Dynamics 365 or Power Platform Dataverse database that you have permission to access. After choosing a database, you can then choose which tables you wish to bring into Power BI from this same screen.
Now that you have a better understanding of how to connect to some of the most common data sources, let’s look at one that is rather unique.
Web as a source
One pleasant surprise to many Power BI developers is the availability of a web connector. Using this connection type allows you to source data from files that are stored on a website, or even data that has been embedded into an HTML table on a web page. Using this type of connector can often be helpful when you would like to supplement your internal corporate data sources with information that can be publicly found on the internet.
For this example, imagine you are working for a major automobile manufacturer in the United States. You have already designed a Power BI solution using data internally available within your organization that shows historical patterns in sales trends. However, you would like to determine whether there are any correlations between periods of historically higher fuel prices and lower automobile sales. Fortunately, you found that the United States Department of Labor publicly posts the historical average consumer prices of many commonly purchased items, including fuel prices:
- Now that you understand the scenario within Power BI Desktop, select the Get data button and choose Web as your source. You will then be prompted to provide the URL where the data can be found. In this example, the data can be found by searching on the website https://www.data.gov/. Alternatively, to save you some time, use the direct link: https://download.bls.gov/pub/time.series/ap/ap.data.2.Gasoline. Once you provide the URL, click OK, as shown in the following screenshot:
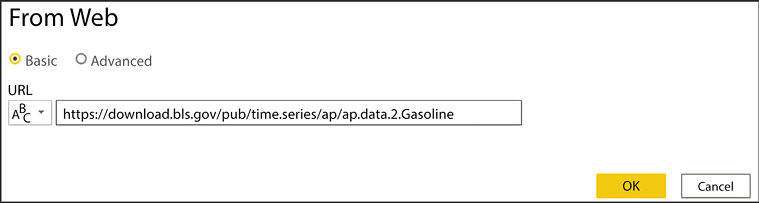
Figure 2.7: Providing the URL where your data can be found
- Next, you will likely be prompted with an Access Web content dialog box. This is important when you are using a data source that requires someone to log in to access it. Since this data source does not require a login to find the data, you can simply select Anonymous access, which is the default, and then click Connect.
- Notice on the next screen that Power BI Desktop recognizes the URL you provided as a tab-delimited file. This can now easily be added to any existing data model you have designed by selecting Load:
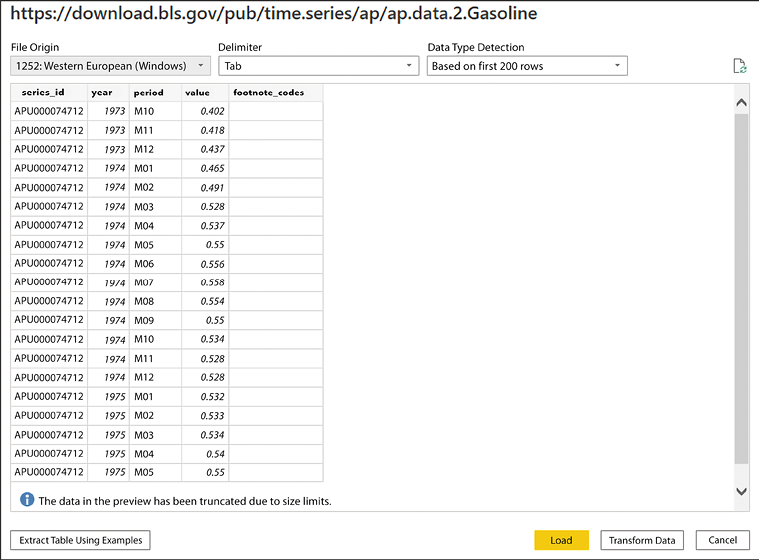
Figure 2.8: A preview of the data is shown before you import it into Power BI
Now that you’ve learned how to connect to various data sources, it is important to discuss in more depth the different data storage modes.
DirectQuery
Many of you have likely been trying to envision how you may implement these data imports in your environment. You may have asked yourself questions such as the following:
- If data imported into Power BI uses an in-memory technology, has my company provided me with a machine that has enough memory to handle this?
- Am I really going to import my source table with tens of billions of rows into memory?
- How do I handle the requirement of displaying results in real time from the source?
These are all excellent questions that would have many negative answers if the only way to connect to your data was by importing your source into Power BI. Fortunately, there is another way. Using DirectQuery, Power BI allows you to connect directly to a data source so that no data is imported or copied into Power BI Desktop.
Why is this a good thing? Consider the questions that were asked at the beginning of this section. Since no data is imported to Power BI Desktop, this means it is less important how powerful your personal laptop is. This is because all query results are now processed on the source server instead of your laptop. As you can imagine, a database server likely has far more resources than your personal workstation. It also means that there is no need to refresh the results in Power BI since any reports you design are always pointing to a live version of the data source. That’s a huge benefit!
The following screenshot shows a connection to a SQL Server database with the DirectQuery option selected:
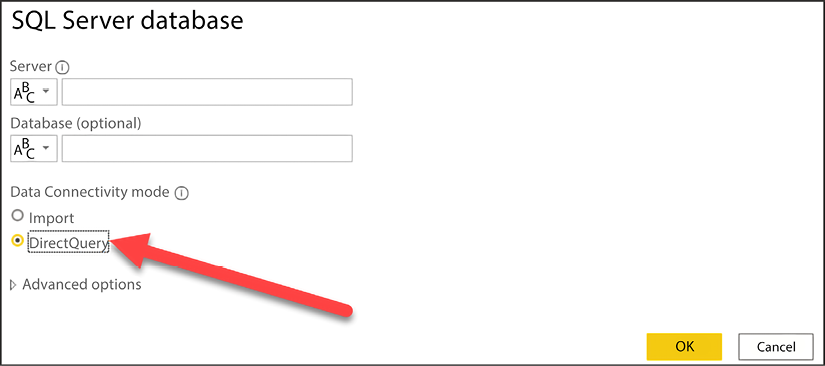
Figure 2.9: SQL Server Data Connectivity mode allows you to switch to DirectQuery mode
Earlier in this chapter, the on-premises data gateway application was mentioned as a requirement for scheduling data refreshes for sources that used the Import option. This same application is also needed with DirectQuery if your data is an on-premises source. Even though there is no scheduled data refresh, the on-premises data gateway application is still required to access on-premises data in the cloud. Again, this will be discussed in more depth in Chapter 8, Using a Cloud Deployment with the Power BI Service.
Limitations
So, if DirectQuery is so great, why not choose it every time? Well, with every great feature, you will also find limitations. The first glaring limitation is that not all data sources support DirectQuery. At the time this book was written, the following data sources support DirectQuery in Power BI:
|
Actian |
IBM Netezza |
|
Amazon Athena |
Impala |
|
Amazon Redshift |
Indexima |
|
AtScale cubes |
Intersystems IRIS |
|
Azure Analysis Services |
Jethro ODBC |
|
Azure Data Explorer (Kusto) |
Kyligence Enterprise |
|
Azure Databricks |
MariaDB |
|
Azure HDInsight Spark |
MarkLogic ODBC |
|
Azure SQL Database |
Oracle |
|
Azure Synapse |
PostgreSQL |
|
BI Connector |
Power BI datasets |
|
Data Virtuality LDW |
QubolePresto |
|
Microsoft Dataverse |
SAP Business Warehouse Message Server |
|
Denodo |
SAP Business Warehouse Server |
|
Dremio |
SAP HANA |
|
Essbase |
Snowflake |
|
Exasol |
Spark |
|
Google BigQuery |
SQL Server |
|
Hive LLAP |
Starburst Enterprise |
|
HDInsight Interactive Query |
Teradata Database |
|
IBM DB2 |
Vertica |
Note that this list will be updated from time to time. The most up-to-date list of the data sources supported by DirectQuery can be found here: https://docs.microsoft.com/en-us/power-bi/connect-data/power-bi-data-sources
Depending on the data source you choose, there is a chance of slower query performance when using DirectQuery compared to the default data import option. Keep in mind that when the Import option is selected, it leverages a highly sophisticated in-memory storage engine. When selecting DirectQuery, performance will depend on the source type you have chosen from the preceding list.
Another limitation worth noting is that not all Power BI features are supported when you choose DirectQuery. For example, depending on the selected source, some of the Power Query Editor features are disabled and could result in the following message: This step results in a query that is not supported in DirectQuery mode. The following screenshot shows this response:
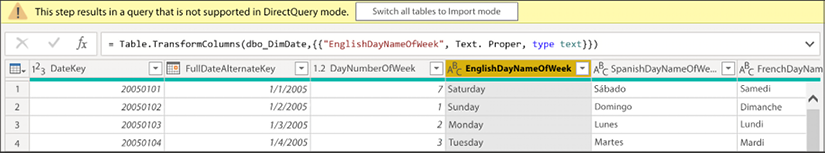
Figure 2.10: Certain transforms may force a user out of DirectQuery mode
The reason for this limitation is that DirectQuery automatically attempts to convert any Power Query steps into a query in the data source’s native language. So, if the source of this solution was SQL Server, then Power BI would attempt to convert this data transformation into a comparable T-SQL statement. Once Power BI realizes the Power Query Editor used a function that is not compatible with the source, the error is generated. There are other less notable limitations found when working with DirectQuery that you can find by reviewing Microsoft’s documentation on DirectQuery.
Composite models
Occasionally, you may find it helpful for your data model to take a hybrid approach regarding how it stores data. For example, you want sales transactions to be displayed in near real time on your dashboard, so you set your SalesTransaction table to use DirectQuery. However, your Product table rarely has values that are added or changed. Having values that do not change often makes it a great candidate for the imported data storage method to take advantage of the performance benefits.
This describes a perfect scenario for utilizing a feature called composite models. Composite models allow a single Power BI solution to include both DirectQuery and import table connections within one data model. From the Power BI developer’s perspective, you can take advantage of the best parts of each data storage mode within your design.
Another effective use case for composite models is found when using the feature called aggregations. Leveraging aggregations is one of the best ways to manage extremely large datasets in Power BI. You will learn more about designing aggregations in Chapter 4, Building the Data Model.
Within the Power BI Desktop, it is clear a solution is leveraging composite models if we view the storage mode in the bottom-right corner of the tool. Clicking the text Storage Mode: Mixed, shown in the following screenshot, will allow you to switch all tables to Import mode instead. Optionally, if you need to change the storage mode of individual tables, this can be accomplished in the Model view by selecting individual tables:

Figure 2.11: The bottom-right corner allows you to switch storage modes for the entire model
While composite models give you the best of DirectQuery and import models, there’s a third storage mode that is often used for data sources that are highly groomed by IT.
Live connection
The basic concept of live connection is very similar to that of DirectQuery. Just like DirectQuery, when you use a live connection, no data is actually imported into Power BI. Instead, your solution points directly to the underlying data source and leverages the Power BI Desktop simply as a data visualization tool. So, if these two things are so similar, why give them different names? The answer is that even though the basic concept is the same, DirectQuery and live connection vary greatly.
One difference that should quickly be noticeable is the query performance experience. It was mentioned in a previous section that DirectQuery can often have poor performance, depending on the data source type. With live connection, you generally will not have any performance problems because it is only supported by the following types of data sources:
- SQL Server Analysis Services database
- Azure Analysis Services database
- Power BI datasets
The reason performance does not suffer with these data sources is that they either use the same xVelocity engine that Power BI does or another high-performance storage engine. To set up your own live connection to one of these sources, you can choose the SQL Server Analysis Services database from the list of connectors after selecting Get data. The following screenshot shows that you can specify that the connection should be set to Connect live:

Figure 2.12: SQL Server Analysis Services Data Connectivity mode allows you to switch to Connect live mode
Of course, these benefits don’t come without a cost. Let’s discuss some of the limitations of live connection.
Limitations
So far, this sounds great! You have now learned that you can connect directly to your data sources without importing data into your model and that you won’t face significant performance consequences. Of course, these benefits don’t come without giving something up, so what are the limitations of a live connection?
What you will encounter with live connections are limitations that are generally a result of the fact that Analysis Services is an Enterprise BI tool. Thus, if you are going to connect to it, then it has probably already gone through significant data cleansing and modeling by your IT team.
Modeling capabilities such as defining relationships are not available because these would be designed in an Analysis Services model. Also, Power Query Editor is not available at all against a live connection source. While, at times, this may be frustrating, it does make sense that it works this way. This is because any of the changes you may desire to make to relationships or in the Power Query Editor should be done in Analysis Services, not Power BI.
Choosing a data connection method
Now that you have learned about the three different ways to connect to your data, you are left wondering which option is best for you. It’s fair to say that the choice you make will really depend on the requirements of each individual project you have.
To summarize, some of the considerations that were mentioned in this chapter are listed in the following table:
|
Consideration |
Import Data |
DirectQuery |
Live connection |
|
Best performance |
Yes |
No |
Yes |
|
Best design experience |
Yes |
No |
No |
|
Best for keeping data up to date |
No |
Yes |
Yes |
|
Data source availability |
Yes |
No |
No |
|
Most scalable |
No |
Yes |
Yes |
Some of the items you’ll consider may be more important than others. So, to make this more personal, try using the Data Connectivity - Decision Matrix file that is included with this book.
In this file, you can rank (from 1 to 10) the importance of each of these considerations to help you choose which option is best for you.
Since the Import Data option presents the most available features, going forward, this book primarily uses this option. In Chapter 3, Data Transformation Strategies, you will learn how to implement data transformation strategies to ensure all the necessary business rules are applied to your data.
Summary
Often, Power BI developers have questions concerning various data sources and what unique challenges come with each connection. The great news is once you have established a connection to your data source, regardless of which one it is, everything after that point typically follows that same pattern of steps. The point is don’t let any one data source overly intimidate you. Once you connect to it, the rest of your Power BI solution design will follow the same processes mentioned earlier in this chapter: data discovery, data modeling, data visualization, and sharing.
Power BI provides users with a variety of methods for connecting to data sources with natively built-in data connectors. The connector you choose for your solution will depend on where your data is located. Once you’ve connected to a data source, you can decide on what type of query mode best suits your needs. Some connectors allow for little to no latency in your results with options like DirectQuery or live connection. In this chapter, you learned about the benefits and disadvantages of each query mode, and you were given a method for weighting these options using a decision matrix. In the next chapter, you will learn more about how data transformations may be applied to your data import process so that incoming data will be properly cleansed.
Join our community on Discord
Join our community’s Discord space for discussions with the authors and other readers:
