Some photographs are not homogeneously light because the photographed object was not homogeneously illuminated. Fine details in the dark area of such photographs are hardly recognizable. We suggest a method to improve the quality of such images.
A known method used for correcting digital photographs taken by automatic devices installed on space probes on other planets uses the subtraction of the local mean lightness from the lightness of the pixels of the original image:
GVnew[x, y] = GVold[x, y] – Mean[x, y] + Const
where GVold[x, y] is the lightness of the pixel with coordinates (x, y), Mean[x, y] is the mean lightness in the neighborhood of the pixel (x, y), Const is a value of lightness not depending on the coordinates, and GVnew is the lightness of the pixels of the resulting image.
This method gives mostly sufficient results. However, I suggest a slightly different method. Consider the lightness L(x, y) of the light reflected from a surface with reflectance R(x, y) illuminated by a light source producing an illumination I(x, y):
L(x, y) = R(x, y)⋅I(x, y)⋅cosφ
where φ is the angle between the direction of the falling light and the normal to the surface. If we have an estimate E(x, y) of the illumination of the surface and we are interested in knowing the reflectance R(x, y) of the surface and we suppose cosφ = 1, then we could obtain a function providing a value proportional to the reflectance R(x, y) by dividing the observed lightness L(x, y) by E(x, y) and not by subtracting E(x, y) from L(x, y).
The illumination I(x, y) is mostly a function slowly changing its value as the coordinates x and y change while the reflectance R(x, y) of the surface changes rapidly. Therefore an estimate of the illumination can be obtained by calculating the mean value of L(x, y) in the neighborhood of each point (x, y). In the case of digital photography, the lightness of the pixels of a digital photo is proportional to L(x, y) and we are interested in the function R(x, y). Therefore, to obtain a function proportional to R(x, y), we should calculate E(x, y) as the local mean of the lightness of the photo and divide L(x, y) by E(x, y). It is also possible to get an estimation of R(x, y) by subtracting E(x, y) from L(x, y). This is correct if all the values L(x, y), R(x, y), I(x, y), and E(x, y) are proportional to the logarithm of the corresponding physical values. However, it sometimes gives good results with usual values of L(x, y), R(x, y), I(x, y), and E(x, y). Therefore we use in our projects both subtraction and division. The user can compare the results and choose the best one.
I present here the project WFshadingBin performing shading correction (see our software in the Internet) and the thresholding of the shading-corrected image.
The local mean of the given image can be calculated by means of the method Averaging described in Chapter 2. However, modern digital photos are large. Most photos contain more than 1,000 ⋅ 1,000 = 106 pixels. The size of the window in which the mean should be calculated for the shading correction of typical images must have a size of at least 100 ⋅ 100 = 10,000 pixels. The Averaging method would be too slow for this size. It is better to use a method providing fast averaging, like FastAverageM, described in Chapter 2. The width of the averaging window is specified by the tool numericUpDown1 with label Window as a part of the width of the image. This is more convenient for users who generally do not know the size of the processed image.
On the other side, for shading correction of photographs of drawings we need a window of the local averaging that has a width a little greater than the width of the lines in the drawing. The latter width is generally between four and nine pixels. This can be less than 1 percent of the width of the image, which can be as large as 2,000 pixels. Therefore we have decided to specify the width of the averaging window in per mille of the width of the image.
Even for color images, we only need the local mean of the lightness, not that of the color channels. Therefore we must transform a color image into a grayscale image containing in its pixels the lightness of the trio (R, G, B). The method ColorToGrayMC performs this transformation while computing for each pixel of a color image the value
Lightness = max(R*0.713, G, B*0.527)
calculated with our method MaxC (see Chapter 3). Then it is possible to use the method FastAverageM to calculate the local mean value of a grayscale image.
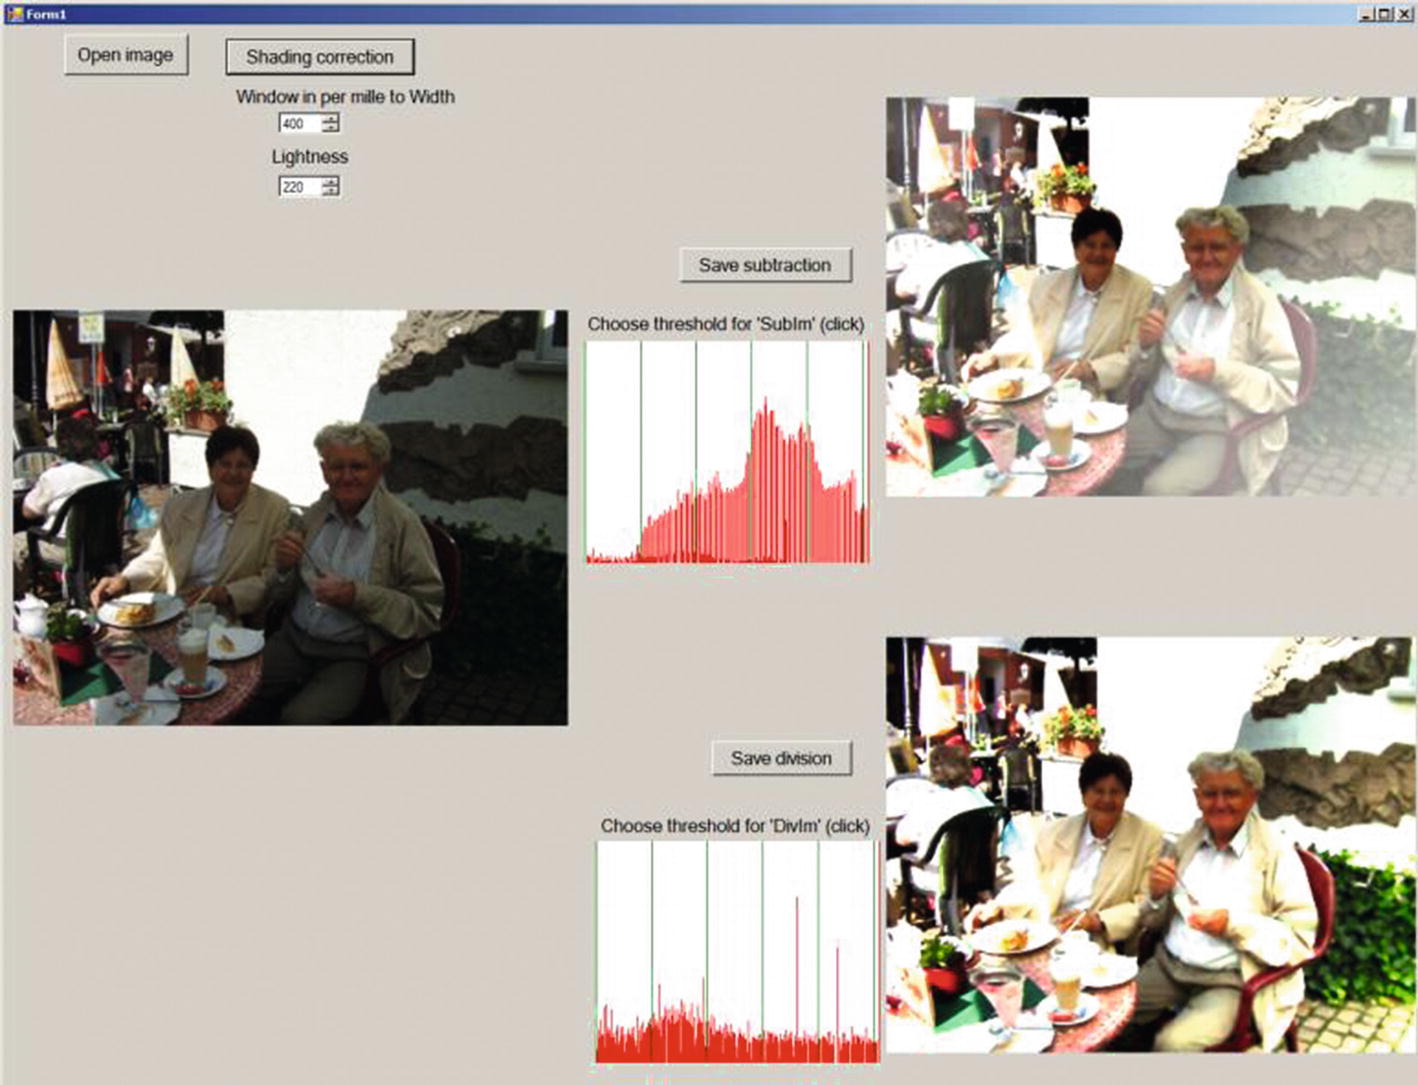
I next describe the project WFshadingBin. The form for this project is shown in Figure 4-1.
Figure 4-1
Form for the project WFshadingBin after shading correction
It contains five picture boxes, four buttons, and two tools of the type numericUpDown. The first button, Open image starts the first part of the project, which is similar to the first part of the project WFpiecewiseLinear with the difference that here seven images—OrigIm, SigmaIm, SubIm, DivIm, GrayIm, MeanIm, and BinIm—are defined. The image SigmaIm contains the results of filtering the original image by means of the sigma filter. The images are used to perform the shading correction by means of subtraction and division and the thresholding of the images SubIm and DivIm. The thresholding is described in the next section.
The Shading correction button starts the corresponding part of the project. It contains the method CorrectShading presented here.
public void CorrectShading()
{
int c, i, x, y;
bool ROWSECTION = false; // used to show the values of images in one row.
int[] color = {0, 0, 0};
int[] color1 = {0, 0, 0};
int Lightness=(int)numericUpDown2.Value;
int hWind = (int)(numericUpDown1.Value * width / 2000);
int ym = 0, ymOld = 256 - MeanIm.Grid[0 + width * y];
for (x = 1; x < width; x++)
{
xs = marginX + (int)(x * Scale1);
yd = 256 - DivIm.Grid[x + width * y];
ys = 256 - SubIm.Grid[x + width * y];
yg = 256 - GrayIm.Grid[x + width * y];
ym = 256 - MeanIm.Grid[x + width * y];
g0.DrawLine(redPen, xold, ymOld, xs, ym);
g0.DrawLine(yellowPen, xold, ydOld, xs, yd);
//g0.DrawLine(bluePen, xold, ysOld, xs, ys);
xold = xs;
ydOld = yd;
ysOld = ys;
ygOld = yg;
ymOld = ym;
}
g0.DrawLine(bluePen, marginX, 256 - Threshold,
marginX + (int)(width * Scale1, 256 - Threshold);
}
} //************** end CorrectShading ***********************************
The method FastAverageM obtains the parameter hWind from the tool numericUpDown1 with the label Window in per mille to Width. The method calculates the local mean of the grayscale image GrayIm. Note that to obtain good results in the case of photographs of drawings it is sometimes necessary to choose rather small values of Window. Still better results can be obtained with the project WFshadBinImpulse described later.
The contents of the shading-corrected images SubIm and DivIm are calculated in the loops with the variables y and x.
As you can see, the method CorrectShading calculates the image with corrected shading in two ways. The first way consists of the division of the values of the original image OrigIm by the local mean lightness saved in the image MeanIm and in multiplication with the value Lightness, which is manually specified by means of the tool numericUpDown2. The second way consists of subtracting the local mean lightness saved in MeanIm from the original image OrigIm and adding Lightness. It is important to use both methods because experiments have shown that the results of the division method are not always better than those of the subtraction method. The method CorrectShading calculates two images, DivIm and SubIm, in the two ways just described. Both results are shown to the user, and he or she can decide which of the two results should be saved.
The quality of the corrected images depends on two parameters: Window and Lightness. It is possible to change these parameters by means of the tools with the corresponding labels and to immediately see the results. The parameter Lightness specifies the mean lightness of the image. The parameter Window defines the size of the gliding window in which the mean lightness of the original image is calculated. This parameter must be chosen so that it is approximately equal to the size of the spots in the original image occurring due to the inhomogeneous lightness. For example, the optimal value of the window for the image shown in Figure 4-1 earlier is about 200 pixels. This value should be set in per mille of the width of the image. In this case 200 pixels make 500 per mille from the width = 400. The user must define Window=500. The view of the form after shading correction is shown in Figure 4-1.
When the user is satisfied with the results of shading correction he or she can either save the image SubIm or the image DivIm, or threshold these images. The process for thresholding is described next.
Thresholding the Images
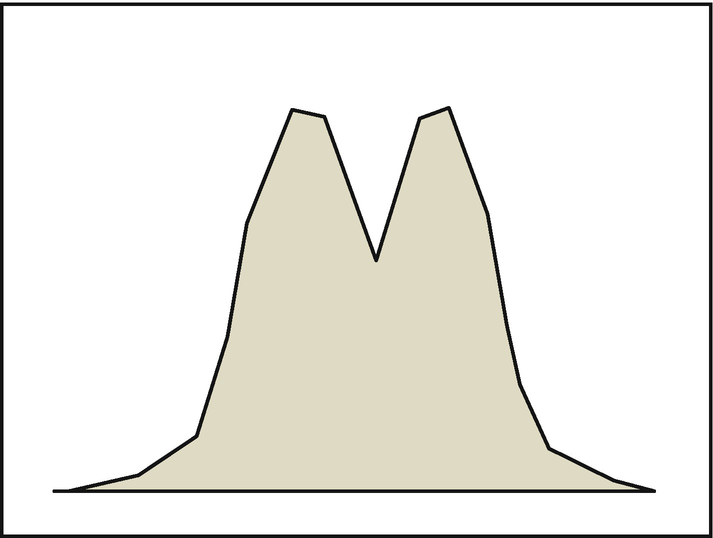
The commonly used method of choosing the optimal threshold for thresholding grayscale images consists of using the gray value corresponding to the histogram minimum as the threshold. The justification is as follows: The histogram of an image with two regions, each having a constant gray level, looks like two columns. If noise is present, the histogram looks like two hills with a valley in between (Figure 4-2).
Figure 4-2
Example of a histogram of an image with two regions
The optimal threshold corresponds to the local minimum of the histogram, but not always to the global minimum. Therefore, it is necessary to restrict the area of the search for the minimum to guarantee that at least some predefined portion of the image will be black or white. For example, if you want at least 5 percent of the image to be black, you must find such a gray value minGV that 5 percent of the histogram area is to the left of minGV. Only minima to the right of minGV must be considered. Similarly, the choice of maxGV can guarantee that at least the desired portion of the area is white.
Sometimes the histogram has more than one local minimum and the deepest one is not always the one corresponding to your desired outcome. It is appropriate in that case to display small binary images for the thresholds corresponding to all local minima and to choose the best one.
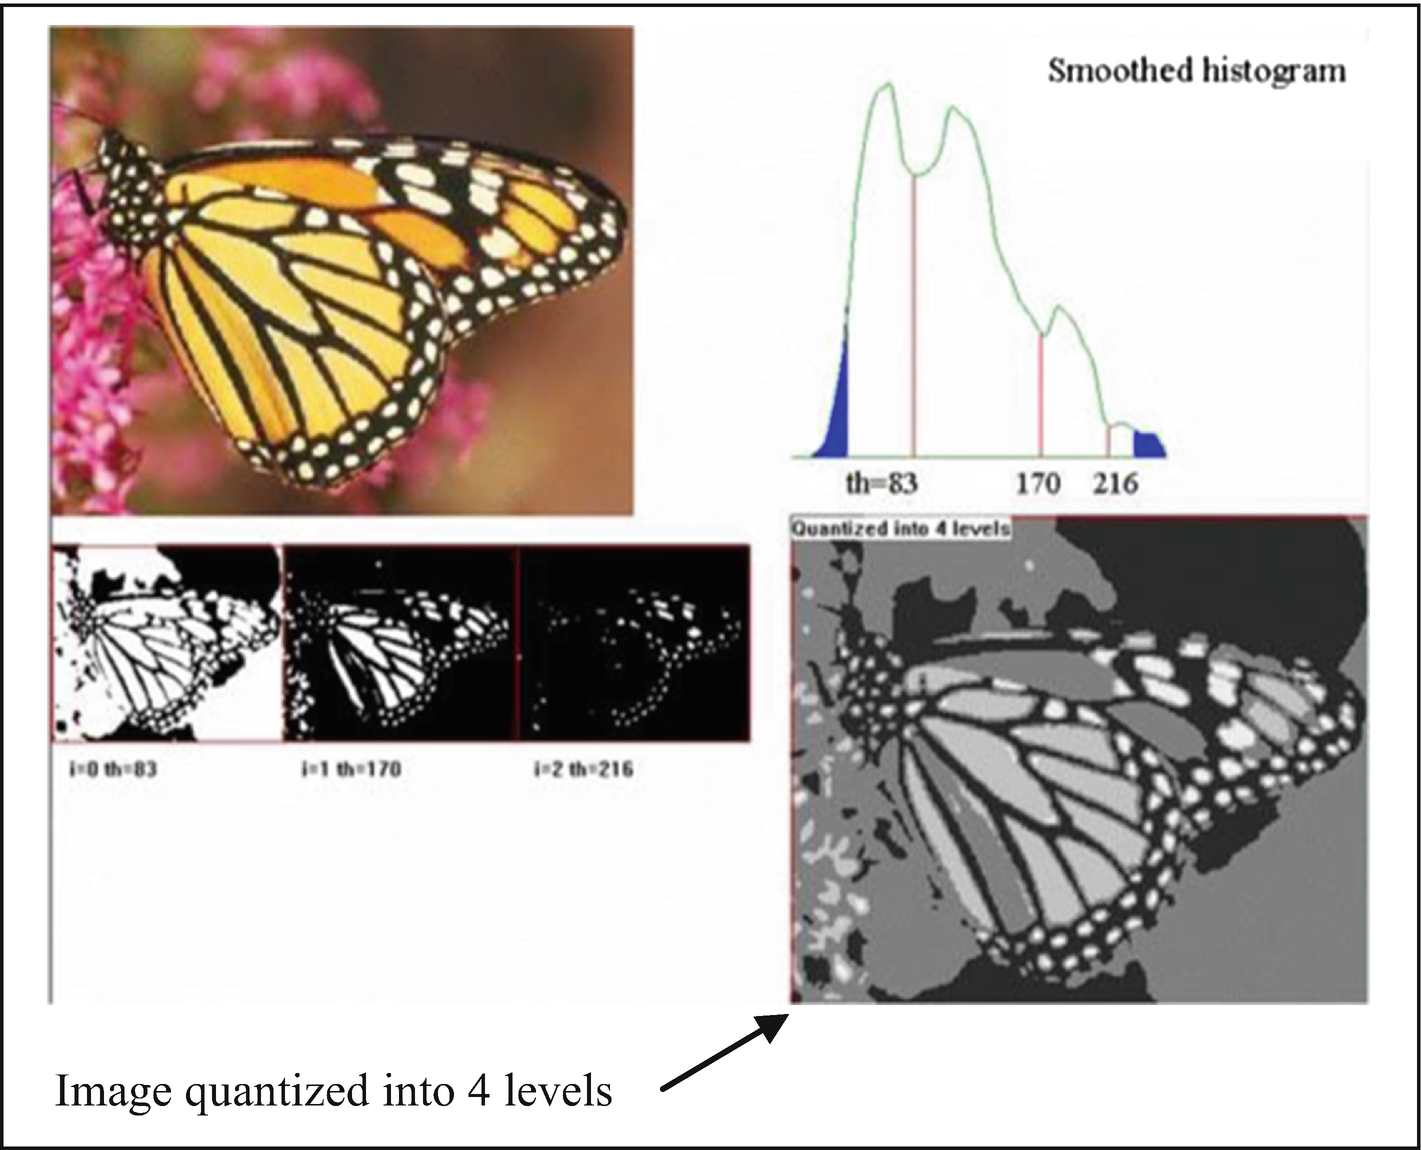
Another possibility is to produce a multilevel image, with each level corresponding to a space between two thresholds. Levels corresponding to the gray values less than the first and greater than the last threshold must also be provided. This means that the lightness equal to 0 and the lightness equal to 255 should also be considered thresholds. Producing a multilevel image means that the image is quantized: All pixels with the lightness between thresholds Ti and Ti+1 obtain the value (Ti + Ti+1)/2. To make the search for the local minima more certain, it is necessary to smooth the histogram because it can have many very small local minima due to noise. Figure 4-3 shows an example of an image with four levels and the results of thresholding with three different thresholds corresponding to the local minima of the histogram.
Figure 4-3
Choice among three threshold candidates
Many different methods of choosing the optimal threshold are suggested, but I suggest another approach: Our project suggests the possibility of manually changing the threshold and immediately seeing the result. Thus the user can choose the result that seems optimal.
Some images to be thresholded have strong shading, which means that the local average lightness changes gradually from one part of the image to another. If the light side of the darker area is brighter than the dark side of the lighter area then there exists no constant threshold separating these two areas. In such cases the shading correction is very useful. The procedure of shading correction was already described. As you already know, there are two methods of shading correction: It is possible to use either subtraction or division by the local mean value. The user can choose between thresholding the result of the shading correction with subtraction or with division. Our project WFshadingBin performs thresholding after shading correction. It shows the histograms of the shading-corrected images. The user can choose the threshold by clicking the histogram (e.g., in a local minimum) and immediately sees the result. The chosen threshold is shown in the histogram as a vertical blue line. Figure 4-4 shows the form of the project WFshadingBin again.
Figure 4-4
The form of the project WFshadingBin
The thresholded image sometimes contains dark spots in a homogeneous white area. If this happens, the Window parameter must be increased.
This project can be used for correcting poorly illuminated photographs of drawings. In such cases the best size of the averaging window can be very small, for example six or nine pixels. This is less than 1 percent of the width, which is usually greater than 1,000 pixels. Therefore we have decided to define the size of the averaging window in this project in per mille rather than in percent of the width of the image.
The results of the thresholding with the WFshadingBin project are quite satisfactory. Figure 4-5a shows the result obtained for the image presented on Wikipedia.en in the article “Otsu’s Method,” describing a rather complicated method developed by a Japanese scientist Nobuyuki Otsu for choosing the optimal threshold. Figure 4-5b shows the result obtained by Otsu’s method.
Figure 4-5
Wikipedia image thresholded by (a) WFshadingBin, and (b) Otsu’s method
As you can see, the results are similar. However, our method has the advantage that the user can easily and quickly change the threshold and immediately see the resulting image.
The method CorrectShading used in our project was described in the previous section. Here we present the part of the source code drawing the blue line showing the threshold and performing the thresholding.
Div_Bitmap.SetPixel(x, y, Color.FromArgb(BinIm.Grid[i], BinIm.Grid[i],
BinIm.Grid[i]));
}
}
pictureBox3.Image = Div_Bitmap;
Threshold = -1;
} //****************** end pictureBox5_MouseClick ***********************
The project WFshadingBin is especially effective in improving photographs of historical images. Figure 4-6 is one more example of processing the photograph of a fragment of a historical image.