One of the fundamental truths of computer programming (and life) is that not everything works perfectly. No matter how much you plan, and no matter how long you've been programming, it's rare for an application you write to work perfectly the first time and forever under all circumstances and possible uses. Knowing how to properly architect your application and write well-formed code is important. Knowing how to find out why things aren't working the way they're supposed to, and fixing them, is equally important. This last part of the coding cycle, as you're probably well aware, is a process called debugging.
When it comes to mastering the process of debugging, experience is far and away the best teacher. Each time you fix a specific problem with your code, you're just a little less likely to make that same mistake in the future. In addition, with experience, the next time you encounter that mistake, you're probably going to find and fix the problem a little bit faster than you did the last time you encountered it. Obviously, we can't give you experience, but we can take you through the basic tools used to debug iPhone applications and show you a few of the most common types of bugs you will encounter.
In this chapter, we're not going to build and debug a complex application. Instead, we're going to create a project from a template, then show you different debugging techniques, one at a time, by adding code to demonstrate specific problems.
We're going to start by taking a brief tour covering the general process of debugging, then take a quick look at breakpoints, which allow you to pause the execution of a running program at a pre-specified point. We'll see how to look at the value of variables in a currently running program, and how to step through the program line by line using the debugger.
Next, we'll talk about static analysis, a new feature of Xcode available only in Snow Leopard, which analyzes your code for common problems and mistakes. Finally, we'll spend some time looking at several of the most common types of bugs you will encounter and talk about techniques for finding and fixing them.
Before we get started, let's create an Xcode project that we'll use to demonstrate debugging techniques. Use the Navigation-based Application project template and select the check box called Use Core Data for storage. Name the project DebugMe. Once the project is opened up, expand the Classes and Resources folders in the Groups & Files pane.
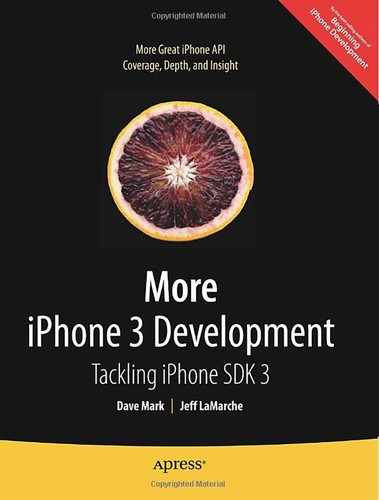
As you probably have noticed, when you create a project in Xcode, the project defaults into what's called the debug configuration. If you've ever compiled an application for the App Store or for ad hoc distribution, then you're aware of the fact that applications usually start with two configurations, one called debug and another called release. If you look in the upper-left corner of your project window, you should see a pop-up menu that says something like Device – 3.1.2 | Debug (Figure 15-1). This tells us that our project is set to run on the device in debug mode.
So, how is the debug configuration different than the release or distribution configuration? There are actually a number of differences between them. The release configuration, for example, is set up so that the generated application will be optimized to be as small and fast as possible. But the key difference between them is that the Debug configuration builds debug symbols into your application. These debug symbols are like little bookmarks in your compiled application that make it possible to match up any command that fires in your application with a specific piece of source code in your project. Xcode includes a piece of software known as a debugger, which uses the debug symbols to go from bytes of machine code to the specific functions and methods in source code that generated that machine code.
Warning
If you try to use the debugger with the release or distribution configuration, you will get very odd results since those configurations don't include debug symbols. The debugger will try its best, but ultimately will become morose and limp quietly away.
Like the compiler that Xcode uses (GCC), the debugger used in iPhone development is actually a separate piece of software called GDB, which is a quasi-acronym that stands for Gnu debugger. Xcode launches GDB for you when it's needed. You don't have to ever interact with GDB directly if you don't want to, though there are some neat things you can do with it that can't be done otherwise, as you'll see a little later. Whenever you launch an application using Build and Debug from the Build menu or Debug from the Run menu, either in the simulator or on the device, you are both building debug symbols into your application and launching GDB along with your application. When you launch your application in this way, GDB is said to be attached to your application. Being attached to your project is what allows it do the cool things it does.
Xcode features a window called the debugger console (Figure 15-1), which you can bring forward by pressing
Figure 15.1. The debugger window is actually an interface to the command-line program GDB, which is the debugger used by Xcode
Probably the most important debugging tool in your arsenal is the breakpoint. A breakpoint is an instruction to the debugger to pause execution of your application at a specific place in your code and wait for you. By pausing, but not stopping, the execution of your program, you can do things like look at the value of variables and step through lines of code one at a time. A breakpoint can also be set up so that instead of pausing the program's execution, a command or script gets executed and then the program resumes execution. We'll look at both types of breakpoints in this chapter, but you'll probably use the former a lot more than the latter.
The most common breakpoint type that you'll set in Xcode is the line number breakpoint. This type of breakpoint allows you to specify that the debugger should stop at a specific line of code in a specific file. To set a line number breakpoint in Xcode, you just click in the space to the left of the source code file in the editing pane. Let's do that now so you can see how it works.
Single-click RootViewController.m. Look for the method called viewDidLoad. It should be one of the first, if not the first method in the file. On the left side of the editing pane, you should see a column with numbers, as in Figure 15-2. This is called the gutter, and it's one way to set line number breakpoints.
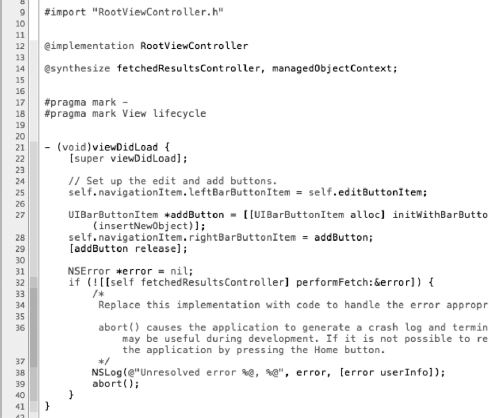
Figure 15.2. To the left of the editing pane is a column that usually shows line numbers. This is where you set breakpoints
Tip
If you don't see line numbers or the gutter, open Xcode's preferences and go to the Text Editing section. The first two check boxes in that section are Show gutter and Show line numbers. It's much easier to set breakpoints if you can see the gutter and the line numbers. Regardless of whether you have Show Gutter checked, the gutter will appear while debugging.
Look for the first line of code in viewDidLoad, which should be a call to super. In Figure 15-2, this line of code is at line 22, though it may be a different line number for you. Single-click in the gutter to the left of that line, and a little arrow should appear in the gutter pointing at the line of code (Figure 15-3). You now have a breakpoint set in the RootViewController.m file, at a specific line number.
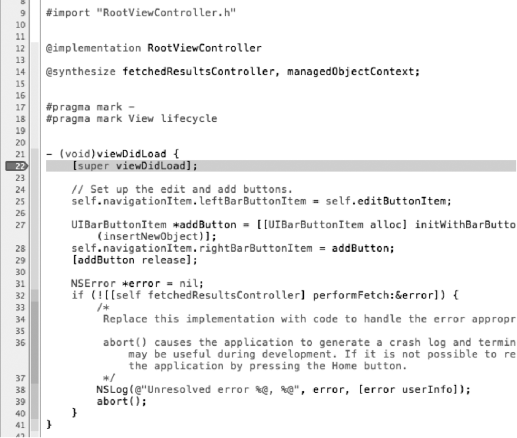
Figure 15.3. When a line number breakpoint is set, it will appear in the gutter next to the line of code where it will pause the program's execution
You can also remove breakpoints by dragging them off of the gutter, and move them by dragging them to a new location on the gutter. You can temporarily disable existing breakpoints by single-clicking them, which will cause them to change from a darker color to a lighter color. To re-enable a disabled breakpoint, you just click it again to change it back to the darker color.
Before we talk about all the things you can do with breakpoints, let's try out the basic functionality. Select Build and Debug – Breakpoints On from the Build menu or press
Note
In the toolbar at the top of the debug and project windows is an icon labeled Breakpoints. As its name implies, clicking that icon toggles between breakpoints on or breakpoints off. This allows you to enable or disable all your breakpoints without losing them. Note that Build and Debug – Breakpoints On forces this setting to on and then launches the debugger. The Build and Debug menu item launches the debugger with or without breakpoints, depending on this setting.
Let's bring the debugger into the mix. Select Debugger from the Run menu, or type
At the bottom of the debugger and most other Xcode windows, you'll see a message along the lines of:
GDB: Stopped at breakpoint 1 (hit count : 1)- '-viewDidLoad - Line 22'
That's Xcode passing along a message from the debugger, telling us that execution has paused at line 22 of RootViewController.m. That bottom portion of the window (you'll find it in the project and console windows as well) is called the c, and it's a good idea to keep an eye on it while debugging, as it will tell you the last status message from the debugger.
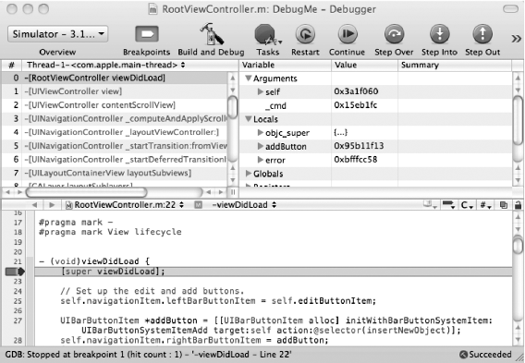
The bottom pane of the debugger window is an editing pane, just like the one in your project. You can edit your project's source code here. But notice that there's also a red arrow and a highlighted line in the source. That's our visual indication that we are currently stopped and using the debugger. The program is still running, but it's paused so we can see what's going on. This red arrow and highlighted line will start at a breakpoint, but as you'll see in a few minutes, you can continue the execution of the program one command at a time.
The upper-left pane of the debugger window is called the stack trace, and it shows the method and function calls that got us here. The call immediately previous to the call to viewDidLoad was a call to the view accessor method on an instance of UIViewController. You might be confused to see an instance of UIViewController in the stack trace. Don't be. Since we didn't override view, the UIViewController version of view was called and, therefore, that version of view was placed in the stack trace. When a class doesn't override a method implemented by its superclass, the superclass's version of the method shows up in the stack trace. In this case, that call to view was actually made on RootViewController, even though the stack trace is reporting it's being called on UIViewController. That's because the stack trace is showing you not what the object instance is, but where the code that was called exists, and the accessor method view exists on UIViewController.
The method before that was the method contentScrollView, also on an instance of UIViewController. The methods before that in the stack trace all have underlines at the beginning of their names, which tells us that those are Apple's super-secret internal methods that we don't have access to and should never, ever call.
Methods in the stack trace that are listed in black are ones for which we have access to the source code. Generally, these will be methods we've written, or at least that are contained in our project. Methods in the stack trace that are in gray are ones that are contained in frameworks or libraries that we've linked against and for which we don't have access to the source code. At our current breakpoint, only the method we're in is our own, the rest are gray, meaning we didn't write those methods.
If you click on a black row in the stack trace, the editing pane will show you the source code for that method. If you click on a gray row, then it will just show you the disassembly (the assembly language representation of machine code) for the listed method. You can step through disassembly, but unless you understand assembly language for the processor being used, it probably won't make much sense.
Note
The disassembly you see will look very different when running on the device and when running in the simulator. In the simulator, you're looking at Intel X86 assembly, but when working on a device, you're looking at ARM assembly. A discussion of assembly language is way beyond the scope of this chapter, but you can find out more about ARM assembly by reading http://www.arm.com/miscPDFs/9658.pdf and you can learn more about Intel assembly by going to http://www.intel.com/products/processor/manuals/index.htm.
Although simpler bugs are often self-contained with a single-method, more complex bugs rarely are, and being able to track the flow of method and function calls that led up to a problem can be incredibly useful.
The upper-right pane of the debugger window is the variable list, and it displays all of the variables that are currently in scope. A variable is in scope if it is an argument or local variable from the current method, or is an instance variable from the object that contains the method. In fact, if you look at the variable list, you'll see that they're divided by type.
Note
The variable list will also let you change a variable's value. If you double-click any value, it will become editable, and when you press return to commit your change, the underlying variable will also change in the application.
Global variables are also in scope for any function or method, but they are treated a little differently. By default, no global variables are included in the variable list. The reason for this is that there are potentially an awful lot of global variables spread throughout the various frameworks that you might link into your program. Even if your program doesn't explicitly declare any global variables, there could still be dozens, maybe even hundreds, of global variables, most of which you'll never care about. As a result, global variables are opt-in. You have to specifically tell Xcode you want to see a specific global variable in the list. If you click the disclosure triangle next to the Globals row in the variable list, instead of revealing a list of variables, it will pop up a new window (Figure 15-5).
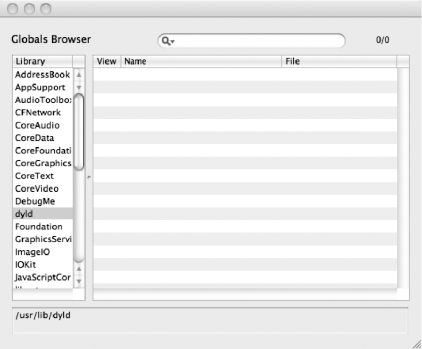
Figure 15.5. Globals are opt-in. You select them from this window, either by browsing a specific framework or library, or by using the search field.
This window is showing you a list of all the frameworks and libraries that are available to your application. If a framework hasn't been loaded or doesn't contain any global variables, that framework will have an empty list of global variables. Among the list of libraries and frameworks is one with the same name as our application. In our case, that would be a listing for a framework called DebugMe. That is where you would find any global variables declared in our application. When a global variable exists, it will be listed and will contain a checkbox to the left of it. If you check the box, the selected global variable will become visible in the variable list.
After the global variables are a number of other sections for processor registers. Registers are small amounts of storage on the processor that you can access very quickly. Unless you're hand-coding assembly, you won't generally be using registers directly. If you understand the architecture of the processors on your devices, these can yield some useful information, but generally you won't need these until you get to the point where you're doing some pretty advanced work, far beyond the scope of this chapter.
In the toolbar of the debugger window, you'll see several buttons that you can use to control the execution of your program when stopped at a breakpoint (Figure 15-5).
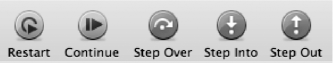
The leftmost button, when pressed, will restart your program. This is functionally equivalent to quitting your program and then re-launching using the debugger. This button doesn't cause your application to be rebuilt, so changes you've made to your code since the last time you built won't be included.
The Continue button resumes execution of your program. It will pick up right where it left off and continue executing as normal unless another breakpoint or an error condition is encountered.
The Step Over and Step Into buttons will allow you to execute a single line of code at a time. The difference between the two is that Step Over will fire any method or function call as a single line of code, skipping to the next line of code in the current method or function, while Step Into will go to the first line of code in the method or function that's called and stop there. When you use Step Into, the method you were in gets pushed down one in the stack trace, and the called method becomes the top method in the stack trace. When your program is stopped at a line of code that isn't a function or method call, these two buttons function identically.
The Step Out button finishes execution of the current method and returns to the method that called it. This effectively pops the current method off the stack trace's stack (you didn't think that name was accidental did you?) and the method that called this method becomes the top of the stack trace.
That might be a little clearer if we try it out. Stop your program. Note that even though your program might be paused at a breakpoint, it is still executing. To stop it, click on the stop sign in the toolbar at the top of the debugger window or select Stop from the Run menu. We're going to add some code that might make the use of Step Over, Step Into, and Step Out a little clearer.
In Xcode, the file RootViewController.m should still be showing in the editor pane. Note that you can go back to the project window to edit your source code, but you can also do that in the debugger window. Makes no never mind to us.
If you don't see RootViewController.m, go back to the project window and single-click on RootViewController.m in the Groups & Files pane. Now, add the following two methods immediately before viewDidLoad.
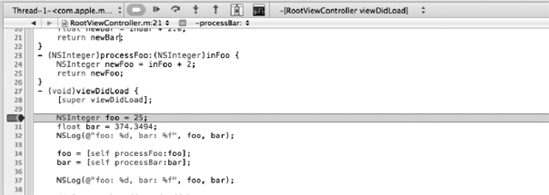
- (float)processBar:(float)inBar {
    float newBar = inBar * 2.0;
    return newBar;
}

- (NSInteger)processFoo:(NSInteger)inFoo {
    NSInteger newFoo = inFoo * 2;
    return newFoo;
}
And insert the following lines of code into the existing viewDidLoad method:
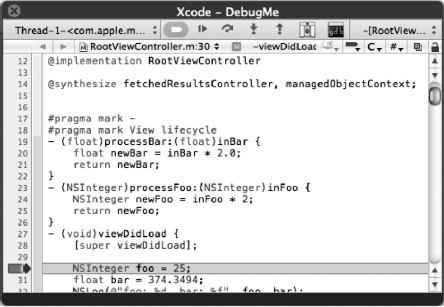
- (void)viewDidLoad {
    [super viewDidLoad];

    NSInteger foo = 25;
    float bar = 374.3494;
    NSLog(@"foo: %d, bar: %f", foo, bar);
foo = [self processFoo:foo];bar = [self processBar:bar];NSLog(@"foo: %d, bar: %f", foo, bar);// Set up the edit and add buttons. self.navigationItem.leftBarButtonItem = self.editButtonItem; ...
Your breakpoint should still be set at the first line of the method. Xcode does a pretty good job of moving breakpoints around when you insert or delete text from above or below it. Even though we just added two methods above our breakpoint and the method now starts at a new line number, the breakpoint is still set to the correct line of code, which is nice. If the breakpoint somehow got moved, no worries; we're going to move it anyway.
Click and drag the breakpoint down until it's lined up with the line of code that reads:
NSInteger foo = 25;
Now, choose Build and Debug from the Build menu to compile the changes and launch the program again. If the debugger window is not showing, bring it to the front. You should see the breakpoint at the first new line of code we added to viewDidLoad.
The first two lines of code are just declaring variables and assigning values to them. These lines don't call any methods or functions, so the Step Over and Step Into buttons will function identically here. To test that out, click the Step Over button to cause the next line of code to execute, then click Step Into to cause the second new line of code to execute.
Before using any more of the debugger controls, check out the variable list (Figure 15-7). The two variables we just declared are in the variable list under the Local heading with their current values. Also, notice that the value for bar is red. That means it was just assigned or changed by the last command that executed.
Note
As you are probably aware, numbers are represented in memory as sums of powers of 2 or powers of ½ for fractional parts. This means that some numbers will end up stored in memory with values slightly different than the value specified in the source code. Though we set bar to a value 374.3494, the closest representation was 374.349396. Close enough, right?
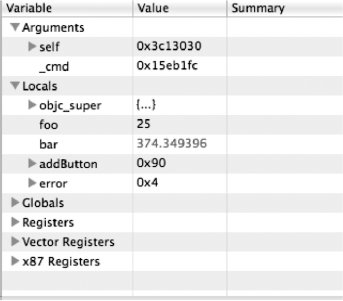
Figure 15.7. When a variable was changed by the last command that fired, it will turn red in the variable list
There's another way you can see the value of a variable. If you move your cursor so it's above the word foo anywhere it exists in the editor pane, a little box will pop up similar to a tooltip that will tell you the variable's current value and type (Figure 15-8).
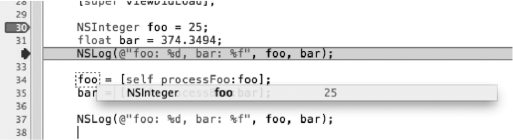
Figure 15.8. Hovering your mouse over a variable in the editing pane will tell you both the variable's datatype and its current value
The next line of code is just a log statement, so click the Step Over button again to let it fire.
The next two lines of code each call a method. We're going to step into one and step over the other. Click the Step Into button now.
The red arrow and highlighted line of code should just have moved to the first line of the processFoo method. If you look at the stack trace now, you'll see that viewDidLoad is no longer the first row in the stack. It has been superseded by processFoo. Instead of one black row in the stack trace, there are now two, because we wrote both processFoo and viewDidLoad. You can step through the lines of this method if you like. When you're ready to move back to viewDidLoad, click the Step Out button. That will return you to viewDidLoad. processFoo will get popped off of the stack trace's stack, and the red indicator and highlight will be at the line of code after the call to processFoo.
Next, for processBar, we're going to use Step Over. We'll never see processBar on the stack trace when we do that. The debugger is going to run the entire method and then stop execution after it returns. The red arrow and highlight will move forward one line (excluding empty lines and comments). We'll be able to see the results of processBar by looking at the value of bar, which should now be double what it was, but the method itself happened as if it was just a single line of code.
DEBUG HERE, DEBUG THERE, DEBUG ANYWHERE
The debugger window is not actually the only place where you can step through code using the debugger. If, while debugging, you go to the editing pane in your project's window, you'll see the same red arrow and highlighted line of code that you saw in the editing pane of the debugger window, and at the top of the editing pane, there will be a small set of icons that match the toolbar icons.
You can use these small icons exactly the same way you use the debugging controls in the toolbar of the debugger window, and can step through the code here if you prefer working in the project window.
But wait! There's more. Act now, and you we'll throw in a free mini debugger. If you select Mini Debugger from the Run menu, a small floating window will appear.
This window also shows the debugger controls and the source code with the red arrow and highlighted line of code. The difference with this window is that it stays on top of all other windows, even when Xcode is in the background, so you can step through code while the simulator is the frontmost application, which can be really handy. There's no One Right Way" to step through your code. Use whichever option works best for you.
You've now seen the basics of working with breakpoints, but there's far more to breakpoints. Select Breakpoints from the Run menu's Show submenu, or type
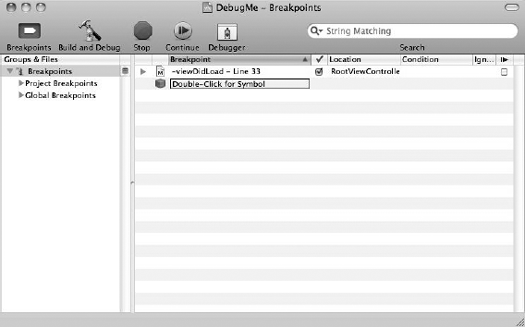
Figure 15.9. The breakpoint window allows you to see all the breakpoints in your project, and also lets you create symbolic breakpoints
Single-click the existing breakpoint (select the first line in the right-hand pane) and press the delete key on your keyboard to delete it. Now, double-click the row that says Double-Click for Symbol. Type viewDidLoad and then press return. We're telling GDB that we want to break on the symbol called viewDidLoad, which equates to stopping at the method viewDidLoad.
When you press return, a sheet will drop down (Figure 15-10). This happens because there's more than one symbol with that name. Symbols do not have to be unique. The same method name, for example, can be used in multiple classes. In a large project, you might have dozens of viewDidLoad symbols compiled into your application.
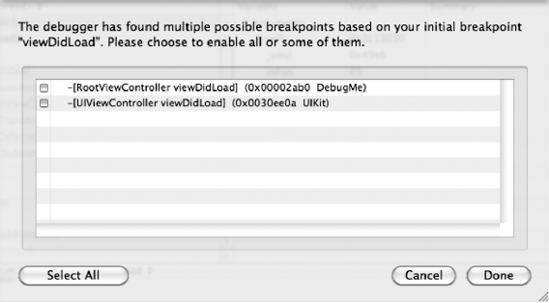
Figure 15.10. When the same symbol exists multiple times, you will be asked to clarify which of those symbols you want to stop on.
In this application, we have two versions of viewDidLoad. We have the version that we wrote, and the one from our superclass that we overrode. When we use debug configuration, not only do we compile debug symbols into our application, but we also link against frameworks that have the debug symbols compiled in as well, so we could even create breakpoints in code that's not ours.
In this case, let's just select the viewDidLoad in RootViewController by checking its check box, then click the Done button. If the application is still running, stop it by clicking the stop sign icon on the toolbar, and then select Build and Debug – Breakpoints On to re-launch it. This time, your application should stop again, at the first line of code in viewDidLoad.
Both the symbolic and line number breakpoints we've set so far have been unconditional breakpoints, which means they always stop when the debugger gets to them. If the program reaches the breakpoint, it stops. But you can also create conditional breakpoints, which are breakpoints that pause execution only in certain situations.
If your program is still running, stop it, and in the breakpoint window, delete the symbolic breakpoint we just created. In RootViewController.m, add the following code, right after the call to super:
for (int i=0; i < 25; i++) {
        NSLog(@"i = %d", i);
    }
Save the file. Now, set a line number breakpoint by clicking to the left of the line that reads:
NSLog(@"i = %d", i);
Go to the breakpoint window and look for a column called Condition. For the breakpoint that you just created, double-click that column and type in i > 15. This will tell GDB only to break at this breakpoint if the value of i is greater than 15. You might get a warning from GDB that it wasn't able to evaluate the condition. If you do, that's okay, because i is a local variable, so GDB won't know about it until it gets there. The variable i doesn't exist outside of the method and we're not in that method right now.
Build and debug your application again, and this time it should stop at the breakpoint just like it has done in the past, but look in your debugger console, and you should see this:
2009-11-25 11:25:00.772 DebugMe[46520:207] i = 0
2009-11-25 11:25:00.774 DebugMe[46520:207] i = 1
2009-11-25 11:25:00.776 DebugMe[46520:207] i = 2
2009-11-25 11:25:00.779 DebugMe[46520:207] i = 3
2009-11-25 11:25:00.780 DebugMe[46520:207] i = 4
2009-11-25 11:25:00.782 DebugMe[46520:207] i = 5
2009-11-25 11:25:00.783 DebugMe[46520:207] i = 6
2009-11-25 11:25:00.784 DebugMe[46520:207] i = 7
2009-11-25 11:25:00.785 DebugMe[46520:207] i = 8
2009-11-25 11:25:00.786 DebugMe[46520:207] i = 9
2009-11-25 11:25:00.787 DebugMe[46520:207] i = 10
2009-11-25 11:25:00.788 DebugMe[46520:207] i = 11
2009-11-25 11:25:00.789 DebugMe[46520:207] i = 12
2009-11-25 11:25:00.790 DebugMe[46520:207] i = 13
2009-11-25 11:25:00.791 DebugMe[46520:207] i = 14
2009-11-25 11:25:00.792 DebugMe[46520:207] i = 15
If you hover your cursor over i in the editing pane, it should show a value of 16. So, the first 16 times through the loop, it didn't pause execution, it just kept going, because the condition we set wasn't met.
This can be an incredibly useful tool when you've got an error that occurs in a very long loop. Without conditional breakpoints, you'd be stuck stepping through the loop until the error happened, which is tedious. It's also useful in methods that are called a lot, but are only exhibiting problems in certain situations. By setting a condition, you can tell the debugger to ignore situations that you know work properly.
Tip
The Ignore column, just to the right of the Condition column, is pretty cool too—it's a value decremented every time the breakpoint is hit. So you might place the value 16 into the column to have your code stop on the 16th time through the breakpoint. You can even combine these approaches, using Ignore with a condition. Cool beans, eh?
If you look in the debugger window again, you'll see a column at the far right that doesn't have a name, just a symbol, a vertical line with a sideways triangle. You've seen that symbol before; it's the symbol used on the Continue button in the debugger controls. If you check the box in that column for a breakpoint, program execution won't pause when it reaches that breakpoint, it will just keep going.
What good is a breakpoint that doesn't cause a break? It's not much good by itself, but combined with breakpoint actions, it can very useful.
Stop your application.
Delete the condition we just added to this breakpoint. To do that, double-click on the condition, then hit delete followed by return. Next, check the continue box for the row so that the breakpoint doesn't cause the program's execution to stop.
Now we'll add the breakpoint action. At the very left of the row that represents our breakpoint, you'll see a disclosure triangle. Expand it now to reveal the breakpoint actions interface (Figure 15-11).
Note
Don't let that objc_exception_throw reference in Figure 15-11 confuse you. That's a special global breakpoint that we'll discuss later in the chapter.
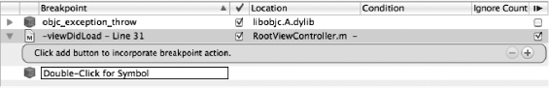
Figure 15.11. Clicking the disclosure triangle next to a breakpoint reveals the breakpoint actions interface
Any breakpoint can have one or more actions associated with it. Click the plus button at the right side of the blue rounded rectangle to add an action to this breakpoint. Once you do that, you'll get a new breakpoint action. There are a number of different options to choose from (Figure 15-12). You can run a GDB command or add a statement to the console log. You can also play a sound, or fire off a shell script or AppleScript. As you can see, there's a lot you can do while debugging your application without having to litter up your code with debug-specific functionality.
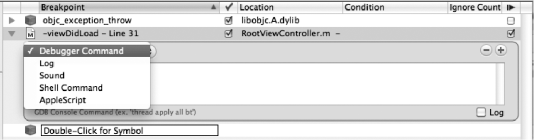
Figure 15.12. Breakpoint actions allow you to fire debugger commands, add statements to the log, play a sound, or fire a shell script or AppleScript
From the Debugger Command pop-up menu, select Log, which will allow us to add information to the debugger console without writing another NSLog() statement. When we compile this application for distribution, this breakpoint won't exist, so there's no chance of accidentally shipping this log command in our application. In the white text area below the pop-up menu, add the following log command:
Reached %B again. Hit this breakpoint %H times. Current value of i is @(int)i@
The %B is a special substitution variable that will be replaced at runtime with the name of the breakpoint. The %H is a substitution variable that will be replaced with the number of times this breakpoint has been reached. The text between the two @ characters is a GDB expression that tells it to print the value of i, which is an integer.
Tip
You can read more about the various debug actions and the correct syntax to use for each one in the Xcode Debugging Guide available at http://developer.apple.com/mac/library/documentation/DeveloperTools/Conceptual/XcodeDebugging.
Build and debug your application again. This time, you should see additional information printed in the debug console log, between the values printed by our NSLog() statement (Figure 15-13). While statements logged using NSLog() are printed in bold, those done by breakpoint actions are printed in non-bold characters.
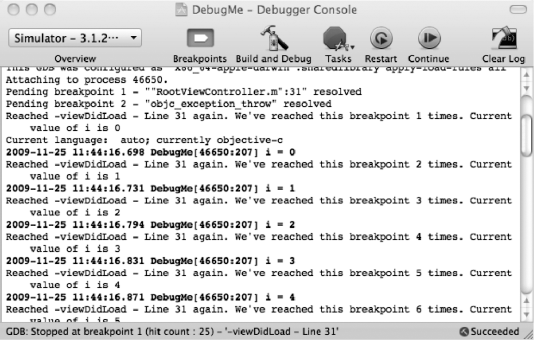
Figure 15.13. Breakpoint log actions get printed to the debugger console but, unlike the results of NSLog() commands, are not printed in bold
That's not all there is to breakpoints, but it's the fundamentals, and should give you a good foundation for finding and fixing problems in your applications.
There's a huge amount of debugging functionality available through Xcode's user interface, and for many people, that functionality will suffice. However, GDB is an extremely robust piece of software capable of doing even more than what can be done using Xcode's debugger and breakpoint windows. We'll look at just a few GDB commands that you can use in the debugger console window, which lets you interact directly with GDB. Note that the debugger console only lets you interact with GDB while you are actively debugging a program and are stopped at a breakpoint.
Before you try any of the commands that follow, make sure that the debugger is running and that it is paused, either by selecting Pause from the Run menu or by stopping at a breakpoint. If you are using breakpoints, be sure you've got at least one without the continue through breakpoint check box checked.
GDB's info command gives you information about the currently running program. To use the info command, you have to specify what you want information about. You can get a list of the available info commands by just typing info, followed by a return, into the GDB console while debugging a program.
For example, if you type the following into the GDB console:
info breakpoints
GDB will list all of the breakpoints in your application. If you type:
info stack
GDB will give you the stack trace. Both of these commands just give you the same information that's already available in Xcode through the breakpoint and debugger window, though it can be useful to be able to get to that information without leaving the console window. Many of the other info commands will tell you things you can't get from elsewhere in Xcode. For example, if you type in:
info function
GDB will list all of the functions currently available to be called, including Objective-C methods and C++ member functions. It doesn't just include functions and methods from your application, either. This will list every function available, including those from linked frameworks, and even those that are private.
You can also work with breakpoints directly from the GDB console. You can do everything that the breakpoint window allows you to do, and more.
To create a new breakpoint, use the command break or b (they are the same, b is just a shorthand for break). Without any parameters, b will set a breakpoint where execution is currently stopped. If you want to set a breakpoint at a specific line number in the current file, append the line number, like so:
b 22
That would set a breakpoint in line 22 of the current file. To set a breakpoint in a specific file at a certain line number, you type the filename, then a colon, then the line number, like so:
b RootViewController.m:22
That would set a breakpoint at line 22 of the file RootViewController.m.You can also set a symbolic breakpoint using the b command by passing the name of the symbol as an argument:
b viewDidLoad
If there is more than one symbol with that name, you will be prompted to specify which one by selecting it from a list, not all that different from the way Xcode handles that situation. If you want to set a breakpoint for a symbol that hasn't been loaded yet, you can use the fb command, which stands for future break. Here's an example of setting a future break on a function in the Objective-C runtime.
fb objc_exception_throw
Note
If you use the fb command and the symbol has already been loaded, then it will function exactly like the b command, so you don't have to worry about whether the symbol is loaded or not when you use fb.
If you are currently stopped at a breakpoint, typing
clear
will remove the current breakpoint. If you want to clear a specific breakpoint at a certain line number in the current file, you would append the line number to the command, like this:
clear 22
And if you want to remove a breakpoint at a specific symbol, you can append the symbol name to the clear command, like so:
clear viewDidLoad
If you want to delete all breakpoints, use the del command with no arguments:
del
While in the debugger, you can print the values of any object or variable that's in scope. To print the value of a native datatype, you use the (surprise!) print command. To print the value of an Objective-C object, you use the po command, which stands for print object.
To print the value of the local variable foo, which is an int, for example, you would type this:
print (int)foo
Tip
You can print in hex with print/x and in binary with print/t.
When you use the po command, GDB actually sends the object a description message and returns the result. Here's how you would print the description of an object bar to the console:
po bar
You can do more than that, though. When you use the po command, you can actually send messages to objects in the debugger and have the po command called on the returned object. If we wanted to know the class of bar, we could type this:
po [bar class]
This would cause the debugger to send bar the class message and then print the results of sending description to the returned value. You can do the same thing with C functions using GDB's call command with a symbol.
call myFunctionThatTakesAnInt(5)
For Objective-C methods that don't return an object because they return void, or a native datatype like float or int, you can also use the call command, but you have to specifically cast the return value so GDB knows how to format it, like this:
call (float) [self methodThatReturnsAFloat]
or
call (void) [self methodThatReturnsNothing]
If you use call on an Objective-C method that returns an object, the call will work but the memory address of the returned object will be printed and not its description.
Warning
GDB commands are not terminated with a semicolon, so don't add one after the po or call commands. Doing so will result in an error.
There's much, much more you can do with the command-line GDB console. We've barely scratched the surface of GDB's functionality in this section. If you're interested in becoming an advanced debugger, check out the GDB user manual at http://sourceware.org/gdb/current/onlinedocs/gdb/. For a quick reference to GDB's commands, you can open up a terminal session and type in man gdb. That will bring up the man page for GDB, which lists the available commands and gives a brief summary of what each does.
Starting with Xcode 3.2 on Snow Leopard, Apple added a menu item to the Build menu called Build and Analyze. This option compiles your code and runs a static analysis on your code that is capable of detecting any number of common problems. Normally, when you build a project, you will see yellow icons in the build results window that represent build warnings and red icons that represent build errors. When you build and analyze, you may also see rows with blue icons that represent potential problems found by the static analyzer. Although static analysis is imperfect and can sometimes identify problems that aren't actually problems (referred to as false positives), it's very good at finding certain types of bugs, most notably code that leaks memory. Let's introduce a leak into our code and then analyze it.
If your application is running, stop it.
In RootViewController.m, in the viewDidLoad method, add the following code just after the call to super:
NSArray *myArray = [[NSArray alloc] initWithObjects:@"Hello", @"Goodbye",
        "So Long", nil];
Before you analyze, it's a good idea to select Clean from the Build menu. Only files that get compiled will be analyzed. Code that hasn't been changed since the last time it was compiled won't get compiled again, and won't get analyzed. In this case, that wouldn't be an issue, since we just changed the file where we introduced the bug, but it's good practice to analyze your entire project. Once the project is done cleaning, select Build and Analyze from the Build menu.
You'll now get a warning about an unused variable, which is true. We declared and initialized myArray, but never used it. You'll also get two rows in the build results from the static analyzer, one that tells you that myArray is never read after initialization. This is essentially telling us the same thing as the unused variable warning from the compiler. The next one, however, is one the compiler doesn't catch. It says: Potential leak of an object allocated at line 30 stored into 'myArray'. The line number might be a little different on your system, but you should still see this row in your build results. That's the static analyzer telling you that you might have leaked memory, and telling you the line of code where the object you might have leaked was allocated. To find out more about the potential leak, click the disclosure triangle to the left of the Potential leak message. Pretty informative, eh?
Before you begin testing any application, you should run Build and Analyze and look at every item it points out. It can save you a lot of aggravation and trouble.
You now know the basic tools of debugging. We haven't discussed all the features of either Xcode or GDB, but we've covered the essentials. It would take far more than a single chapter to cover this topic exhaustively, but you've now seen the tools that you'll use in 95% or more of your debugging efforts. Unfortunately, the best way to get better at debugging is to do a lot of it, and that can be frustrating early on. The first time you see a particular type of problem, you often aren't sure how to tackle it. So, to give you a bit of a kick-start, we're going to show you a couple of the most common problems that occur in Cocoa Touch programs and show you how to find and fix those problems when they happen to you.
Almost certainly the most frustrating and difficult type of bug in the Cocoa Touch world is the dreaded EXC_BAD_ACCESS exception, which happens when you try to use an object that has been deallocated. This usually occurs because you released an object that wasn't retrieved from alloc, new, or copy, and wasn't specifically retained. It can also happen if you don't specify retain in your property declaration, since using the mutator method for a property that's not specifically declared with the retain keyword won't retain the object for you.
Before we demonstrate this problem, delete the leaky declaration of myArray we just had you add to viewDidLoad.
Save, then switch over to RootViewController.h and add the following lines of code:
@interface RootViewController : UITableViewController
    <NSFetchedResultsControllerDelegate> {
    NSFetchedResultsController *fetchedResultsController;
    NSManagedObjectContext *managedObjectContext;

    NSArray     *stuff;
}

@property (nonatomic, retain) NSFetchedResultsController *fetchedResultsController;
@property (nonatomic, retain) NSManagedObjectContext *managedObjectContext;
@property (nonatomic, retain) NSArray *stuff;
- (void)doSomethingWithStuffArray;
@end
We're declaring the stuff array so we can overrelease it in a bit. We also declare a new method called doSomethingWithStuffArray which is where we'll try to access the array after it's been overreleased.
Switch over to RootViewController.m. First, synthesize the new array property we just created, right after the existing @synthesize declaration:
@synthesize stuff;
Then, add this new method right above the existing viewDidLoad method:
- (void)doSomethingWithStuffArray {
    NSString *oneString = [stuff objectAtIndex:0];
    NSLog(@"%@", oneString);
}
No magic there, we're just retrieving a string from the array and logging its contents. Now, in the viewDidLoad method, right after the call to super, add the following code:
NSArray *array = [NSArray arrayWithObjects:@"Hello", @"Goodbye", @"So Long",
        nil];
    self.stuff = array;
    [array release];
    [self performSelector:@selector(doSomethingWithStuffArray) withObject:nil
        afterDelay:5.0];
At first glance this code might look okay, but we created array using a convenience factory method, which means it's not ours to release. Yet, after assigning it to the stuff property, we release it. Any object returned from a factory method is in the autorelease pool, so when we release it, it doesn't get deallocated immediately. That's what can make this problem so hard to track down. The actual problem won't occur until later, not at the time that we made the mistake.
Open the breakpoint window and look in the left pane. There you'll see listings for project and global breakpoints. Global breakpoints exist in every Xcode project, not just the one in which you created it. This fact can be very handy. We're now going to give you a global symbolic breakpoint that you should set and never, ever delete. As you'll see, this breakpoint can be extraordinarily helpful to have around. Let's set it now.
In the left pane of the breakpoints window, single-click Global Breakpoints. Next, double-click the single row that reads Double-Click for Symbol, type in objc_exception_throw, then hit return. This symbol points to the function that throws exceptions. If you're debugging an application and get an uncaught exception (which is about to happen), this breakpoint will pause the execution of the program when the exception is thrown, before the program terminates from the uncaught exception. This will give you a chance to look at the stack trace and examine variable values, to get a sense of what the heck happened.
Note
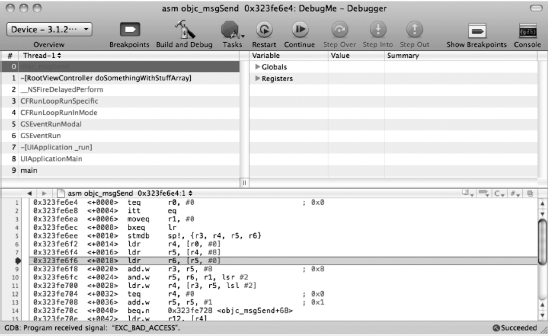
If your stack trace doesn't look like 5-14, and doesn't include the call to doSomethingWithStuffArray, and instead you see a gray item at the same spot with three question marks instead of a proper name, it probably means you're running on the simulator. For some reason on the simulator, after receiving the EXC_BAD_ACCESS, sometimes the debugger is unable to match up code with the debug symbols and this is the result. Hopefully this will be fixed in a future release of the iPhone SDK, but we didn't want you to think you were doing something wrong. If you encounter this with your own applications, debugging on the device instead of the simulator should still work okay.
Trace the call stack back to the first method that's listed in black and click on it. It should be the second row (index 1) that represents the doSomethingWithStuffArray method, just like in Figure 5-14. When you click on it, lo and behold, the editing pane shows you exact line of code that triggered the error. Once you know that, you know the problem is with the stuff array, and you can go look at where you created it to make sure you're not overreleasing it (which, of course, we are in this case). If you aren't, you can then go check the property declaration, and make sure it's specified with the retain keyword.
Breaking on the exception won't always tell you where the problem is, though. Even worse, sometimes instead of getting an EXC_BAD_ACCESS immediately, your code seems to work for a while, and then suddenly crashes. Sometimes you get completely unexpected behavior. Instead of receiving an EXC_BAD_ACCESS, you get an error telling you that the object doesn't respond to the selector objectAtIndex:.
This can mean that the memory that was previously used for stuff might might have been reused for another object for our application. In that case, accessing that memory is perfectly fine, it's just that the object that's there isn't the one we're expecting to be there because it now represents a different object altogether. In these cases, the answer is to call in the zombies. What? Zombies? Yes, zombies.
Note
The kind of unpredictable errors that you get when memory is reused for different type of object is commonly referred to as a heisenbug, which is a play on the term Heisenberg Uncertainty Principle. They can be some of the most difficult bugs to track down.
At this point, you're probably expecting us to explain the really lame joke about zombies at the end of the last paragraph. Only, it's not a joke. We really are going to call out the zombies. We're going to set an environment variable that will change the way object deallocation works in Cocoa. Instead of freeing up a deallocated object's memory so it can be reused, the system will start turning deallocated objects into zombies, which are valid objects. Because they're valid objects, their memory can't get re-used by another object. But, they don't respond to messages the way regular objects do; instead, they eat their brains.
Okay, that last bit actually was a lame zombie joke, sorry. That's not really what zombies do. What they actually do is report the fact that you've sent a message to them. Remember, without zombies enabled, sending a message to a deallocated object would have resulted in a crash or some other heisenbug. With the zombie still around, we won't crash and we know exactly what object was inappropriately sent the message, so we know where to look to fix it.
Zombies are awesome. Let's enable zombies and re-run our application so you can see how this works.
If your application is running, stop it. In the Groups & Files pane, look for Executables. Click the disclosure triangle next to it to reveal a single item called DebugMe. Double-click that item to open up a new window, then click the Arguments tab (Figure 15-15).
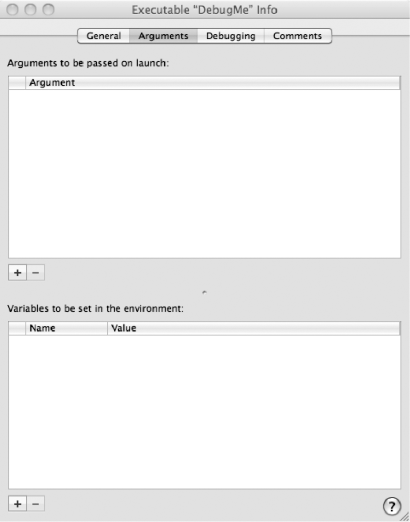
Figure 15.15. The executable window allows you to specify, among other things, environment variables and arguments to be passed to the executable
This window allows you to set certain parameters about the way your application is launched, but only when it's launched from within Xcode. These values don't affect the program when it's compiled and run elsewhere, either from the app store or using ad hoc distribution. On this tab, you can specify parameters that get passed to your application (Figure 15-15, top pane) and also can set environment variables for the application's run (Figure 15-15, bottom pane).
The bottom pane is the one we want. We need to set an environment variable, so click the plus button in the very lower-left of the window. This will add a row to the bottom table. Double-click the row on the Name column and change the variable's name to NSZombieEnabled. Then, double-click on the same row in the Value column and set the value to YES. Now you can close the window.
Build and debug your application again. This time, it won't crash. But if you look in the debugger console, you'll see a message like this:
*** -[CFArray objectAtIndex:]: message sent to deallocated instance 0x3a2d110
This message offers up some excellent clues to help us figure out which object was overreleased. We know it's an array, because CFArray is the core foundation counterpart to NSArray. We also know the message that was sent, which is objectAtIndex:, so we can search in our project for occurrences of objectAtIndex: or we could set a symbolic breakpoint for objectAtIndex: and see which ones fire before the invalid object is set.
Another hard-to-debug problem is when you have a method or set of methods that infinitely recurse. A method that calls itself, or two methods that call each other, will keep running until the system runs out of space on the call stack for any more method calls. As you saw earlier with the stack trace, method and function calls in a program are kept track of in a stack. If that stack runs out of room, no more calls can be made and your application quits.
The reason these are hard to debug is that they generally don't give very much in the way of feedback. They keep running until the app runs out of room on the call stack, and then the application crashes. Typically, you don't get any indication in the debugger console at all about why it crashed.
In iPhone development, this problem frequently occurs when people forget that dot notation is just a shorthand for a method call. For example, you might create an accessor method like this:
- (NSString *)foo {
    return self.foo;
}
If you're thinking of dot notation the way it's used in Java or C++, this method looks okay. You're just returning the instance variable, foo, right? Alas, no. Calling self.foo is exactly the same thing as calling [self foo], which means that this method is calling itself. And it will keep doing so forever, until the program dies.
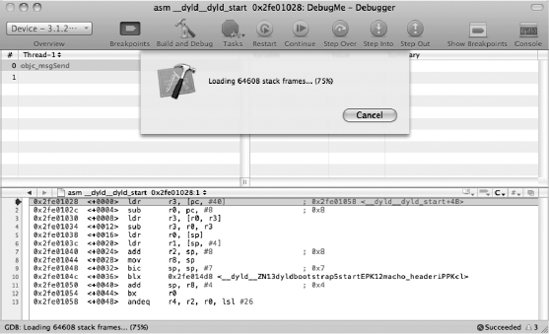
When this happens, you'll get a sheet in the debugger window that tells you that Xcode is loading stack frames (Figure 15-16). There are going to be a lot of stack frames when this happens. A stack frame represents an individual row of the stack trace pane. Sometimes Xcode gets overwhelmed by the size of the stack trace and just crashes... just disappears without a trace.
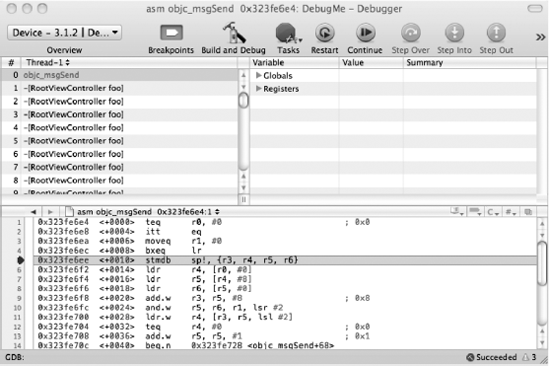
But, if Xcode manages to hang on, the stack trace will make it pretty obvious what's going on (Figure 15-17). If you see the same method or set of methods repeated over and over in the stack trace after it finishes loading the stack frames, that's your clue that you've got a method or methods infinitely recursing.
Sometimes, no matter how hard you look, no matter how many instructions you step through in the debugger, the results seem to be wrong. A method that should be getting called isn't getting called, or the wrong action is firing. If you encounter this sort of mystery, don't forget that not all bugs are contained in code. You can also make mistakes creating your nibs. You can forget to connect an outlet or action, or accidentally delete a connection after it has been made. You can connect the wrong control event, or unintentionally connect a control to multiple targets.
Failing to make an outlet connection in Interface Builder can often be a difficult problem to track down because messages in Objective-C can be sent to nil objects, and messages to nil objects do no harm. That means a nil connection is generally not fatal. It doesn't do what you want, but it doesn't trigger an error, either. Unfortunately, there's not really a good tool for determining if there's a problem with your nib, so you need to learn to recognize behavior that can result from missing or incorrectly connected actions and outlets.
If you set breakpoints in action methods, and they either don't fire at all, or don't fire when you think they should, you probably want to check your nib file and make sure that the connections are all what they should be. Make sure that all outlets are connected and that the controls that trigger actions are triggering the correct actions on the correct event.
If you control-drag from a control, the default action that you're connecting to with most controls is the Value Changed event. Interface Builder knows enough to use Touch Up Inside if you control-drag from a button, but with most controls, control-dragging connects you to the Value Changed event, which may very well not be what you want. As a result, you should get in the habit of making your connections to action methods using the connections inspector, and leave the control-dragging for connecting outlets.
Debugging can be one of the most difficult and frustrating tasks on this green earth. It's also extremely important, and tracking down a problem that's been plaguing your code can be extremely gratifying. The reason the debugging process is so hard is that modern applications are complex, the libraries we use to build them are complex, and modern operating systems themselves are very complex. At any given time, there's an awful lot of code loaded in, running, and interacting.
It would be impossible to predict every bug that you might encounter, and any attempt to write an exhaustive chapter on the subject would be futile. But, we've packed your backpack with a few of the most useful debugging tools and some information on some of the most difficult and problematic bugs, which should give you a good starting point for your future application development treks.
As we stated at the beginning of the chapter, there's no teacher like experience when it comes to debugging, so you just need to get out there and start making your own mistakes and then fixing them. Don't hesitate to use search engines or to ask more experienced developers for help if you truly do get stuck, but don't let those resources become a crutch, either. Put in an effort to find and fix each bug you encounter before you start looking for help. Yes, it will be frustrating at times, but it's good for you. It builds character.
And with that, we're close to the end of our journey together. We do have one more chapter, though, a farewell bit of guidance as you move forward in your iPhone development travels. So, when you're ready for it, turn the page.