
7
Preparing for Attacks
He sits at his keyboard, making notes about targets. He knows, based on the size of his target, how much work he will need to do to be harder to spot as he takes on another target. Targets that are less likely to have any detection in place. These same targets may also be less likely to have any ability to look back at historical data. Targets that aren't doing much in the way of detection or logging are much easier because it means he will have to do much less work to avoid detection and also very little work to clean up after himself.
He connects to a fresh target and immediately checks to see whether there is anything running locally that might send any data anywhere, whether it's a host-based intrusion detection system or just log data. Desktop systems are far less likely to have these protections on them and because they often have permissions to where all of the interesting data is, they make great systems to attack. Easier to gain and retain access without anyone being aware and once he has access, he can continue to extract data and gain access to additional systems on the network without worrying about covering tracks or cleaning up anything. Life is so much easier when no one is paying any attention to what you're doing.
You won't always be able to rely on having a packet capture to look at when something happens that you want to investigate. In most cases, you will have to rely on a number of other artifacts as a starting point; these artifacts may be your only shot at determining what happened, so it's important that you have access to them. This may not be your call, unfortunately. Setting up incident detection systems, logging, antivirus, and other systems that will be useful for you is not typically a forensic investigator's responsibility. Of course, if you are the sole system and network administrator, you may also be expected to perform investigations.
Although this is data you will need to investigate later on, you need to have it configured up front. If you are on an incident response team for a company, you will need to make a case for having these systems and configurations in place ahead of time. You will also need to know whether you need them, based on the circumstances, before you can expect an organization to invest in systems that will support these capabilities. Though having the data is essential when it comes to performing an investigation, businesses don't exist to perform investigations, so someone needs to justify the expenditure for systems or storage. Being prepared for investigations can be expensive.
There are many ways you can prepare for incidents ahead of time. Your resources and network may support most of what will be covered in this chapter. Depending on the likelihood of attack against your infrastructure, your organization may be okay with spending what is necessary to implement the storage required to have information on hand to respond to an incident. You will need to do the work to determine the likelihood as well as the costs that may be associated with response without having data to determine root cause and initial point of entry. Without this information, you may be susceptible again if the organization is incapable of closing the holes.
Network devices are capable of generating a fair amount of data, including the flows of traffic passing through them. This can be captured using Cisco's NetFlow protocol, even if you aren't running Cisco devices. Additionally, enabling logging on network devices will help to provide information. All of these logs and other pieces of data, of course, will require storage space. As part of determining costs to present to management, you will need to understand how long you will want to store your data for and how much space you will need, based on the record size and volume.
NetFlow
NetFlow is a protocol that was developed by Cisco Systems as a way of providing data that could be used to troubleshoot a network. Although this capability was developed primarily for network administrators to use, it also provides a lot of capability for a network forensic investigator. Like the other capabilities discussed in this chapter, it has to be enabled ahead of time to provide any value. If it isn't enabled and the architecture necessary to collect and store it isn't in place, you won't have any NetFlow data to look at.
Speaking of architectures, you will need systems in place in addition to the device that will generate the data for you. The device that will generate the data will commonly be a router. Though Cisco developed this particular protocol, it has been adopted by other vendors as well, like Nortel and Juniper. Other developers that have not adopted NetFlow specifically may have developed something similar, so just because the company you are working with doesn't have NetFlow doesn't mean you are out of luck. It may require a little more investigation to determine what is in place so that functionality can be enabled. Each device, whether it's a router or a switch, would need to have NetFlow enabled. You can see a diagram of a simple NetFlow collection architecture in Figure 7.1.
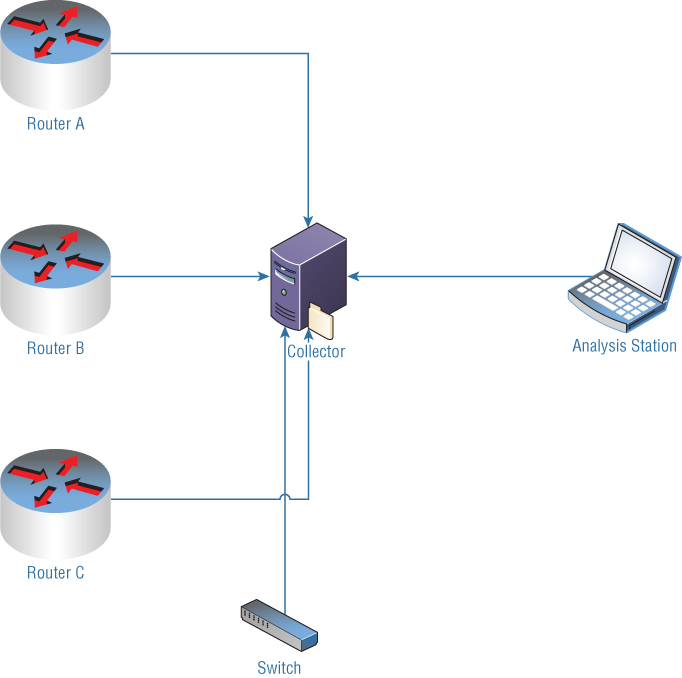
Figure 7.1: NetFlow diagram.
Once you have devices generating NetFlow data, you need a system in place to handle the collection. This system is called a NetFlow Collector. In Figure 7.1, the Collector is in the middle of the diagram. Each device that creates NetFlow data forwards it to the Collector. The Collector stores the data, and different types of Collectors may store their data in a different format. A Collector is just software that can run on any system. The only thing that is guaranteed with NetFlow is what data is gathered and how it is transmitted. Even that is based on the protocol version because that determines what is transmitted. For that reason, the device generating the data needs to know what version is being used.
The Collector stores the NetFlow data in whatever format the software that handles the collection chooses to store it in. What you need then is an analysis station. In Figure 7.1, you can see this on the right-hand side of the diagram. Though the diagram depicts this as a laptop, indicating that it is probably on the user side, the analysis can be done in a variety of ways. The simplest analyzer is a program that will take the collected NetFlow data and dump it out in a text-based format, as you can see in Figure 7.2. This was done using the flow-tools package on a Linux system, which includes a number of utilities for collecting, reporting, and manipulating NetFlow data. You can see the source and destination interface as well as the source and destination ports in the output in Figure 7.2. You can also see the protocol, in hexadecimal, abbreviated to Pr.
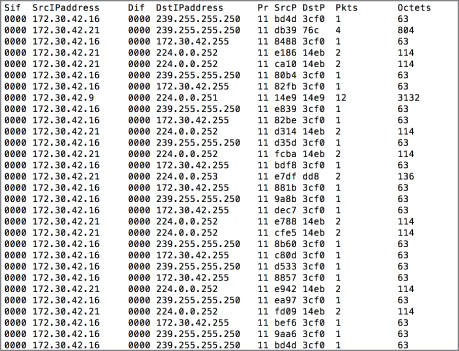
Figure 7.2: NetFlow output.
This is just a simple text-based, tabular format, but other tools can be used to present information in different ways. The diagram indicates a single laptop, but some analysis applications can be implemented in multiple systems. This may be done using a web-based interface, which would require an application to decode the stored data and also a web application that will take the decoded data and present it in a web browser in the way the user has requested. Other analysis applications may be native applications that need to be installed on the operating system you are performing the analysis on. You may also be able to look at NetFlow data using a mobile application on a phone or a tablet, depending on what operating system you are using.
An advantage to using tools like the flow-tools package is the ability to take the format the data is stored in and generate different types of output. One of those is comma-separated value (CSV) files. Using CSV output, you would be able to easily import the data into a spreadsheet program like Microsoft Excel or Google Sheets and manipulate it. This includes sorting, which will help to combine all of the source or destination IP addresses together since, by default, the output will be based on time with the earliest flows at the beginning of the output and the latest at the end. Being able to sort will help to bring a better sense of what may be happening. Using a spreadsheet program will also help you to search through the data better. Figure 7.3 shows sorted output, with one row highlighted because it lists a large number of packets. Following up on this, it may be useful to re-sort based on the number of packets or the number of octets, which may yield something else of interest.

Figure 7.3: NetFlow output in Microsoft Excel.
If you are familiar with database programs, you can export to a database like MySQL using flow-tools. This would allow you to generate queries to pull out specific data from the entire flow. Spreadsheet programs will also allow some of this functionality, but database programs are designed for easy and efficient retrieval. Large quantities of flow data may be difficult to search and manipulate in a spreadsheet program, which may force you to use something like MySQL or SQLite.
It's important to note that the output isn't always in decimal form. In Figure 7.2, the output is in hexadecimal. As noted above, the Pr column is the protocol and although it shows 11, that's really 16+1 or 17, which is the protocol number for UDP. Figure 7.4 has similar output as that shown earlier but the values are in decimal, rather than hexadecimal. The protocol is shown to be 17, indicating UDP, and the port values are also in decimal. It's important to know which base number system you are looking at. There is a significant difference between 50 and 80, for instance. If you were to look up 50 as the port number, thinking it were decimal, you'd come up with the Remote Mail Checking Protocol, which is a protocol you may never have heard of before. In fact, 50 is the hexadecimal value of 80 decimal. You may be more familiar with 80 as being the TCP port number for HTTP (web) traffic.
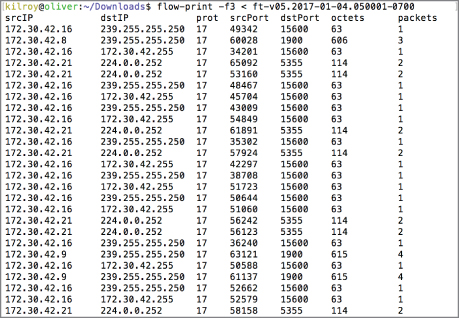
Figure 7.4: NetFlow output with decimal values.
You may also note that Figure 7.4 lacks the Sif and Dif columns. Because NetFlow data often comes from routers or switches, where packets or frames are forwarded from one interface to another, it is useful to know what the source and destination interfaces are. This will tell you where the packet or frame originally came from, which can be essential in looking at spoofing cases where the source IP address (or MAC address) is different from the legitimate address. In combination with a routing or ARP table, you may be able to spot instances of spoofing that would otherwise be difficult to see.
As an example, let's say that you have a router with two interfaces where interface 0 is on the outside, facing the Internet, while interface 1 is on the inside. You are using a private address space on the inside of your network—172.20.100.0/24. If you were to see that address coming in on interface 0 while looking at NetFlow data, you would know that it's not a legitimate flow. In fact, the reverse flow would never reach the router so you would only ever see one direction of flow. These sorts of discrepancies can be isolated using NetFlow data.
One of the challenges with NetFlow data is the amount of storage space it can consume if you are running it full time. Even though you are capturing just a summary of the headers and not the entire packet, it can still be space consuming over a period of time. This is especially true if you have a significant number of devices generating NetFlow data and your network is busy. There are trade-offs, of course. As an investigator, you want as much data as you can get your hands on. The network administrative team and the system administrators, however, may have something else to say about this. NetFlow data causes more network traffic running through the network since it needs to be transported from the device generating it to the device storing it. The Collector is another system that needs to be maintained, and if there is a large amount of storage, it is not only a cost to the business but is also a storage device that needs to be maintained and monitored. These are all factors that need to be taken into account when thinking about whether to turn NetFlow on.
It may be possible to turn NetFlow on but then establish a rotation for older NetFlow files so they are either discarded or pushed off to near-line or off-line storage rather than taking up space on a live disk. These are challenging decisions to make, though, because you may have no idea how far back you need to go to isolate the source of an infection or intrusion. The NetFlow data will help you to do that, but only if you have access to it. This is where having other data in place will be helpful because you may be able to use it as a fallback or, better, to correlate with.
Logging
You may initially think about logging from an operating system perspective, where it is commonly discussed, since operating systems create and store logs. However, it's more complicated than that. As noted in the previous section, it is important to have either data to replace primary sources like NetFlow or data to correlate with primary sources like NetFlow or packet captures during a network investigation. But from a networking perspective, there is a lot more to look at, including not only the operating system and application logs, but also any network devices like routers and switches. They can often have important information when it comes to investigating network incidents. This is where logging comes in.
While logging systems often store the log data on the device where it is generated, larger enterprises may be more likely to store their logs on centralized logging systems. This makes a lot of sense. For a start, trusting logs on any endpoint is probably a mistake. Any device that interacts with users in some way or is exposed to a larger network has the potential to be compromised. Once a system has been compromised, everything on it is suspect, including any log files that may be stored there. An attacker could easily manipulate the log files once he gains the necessary access, which may include administrative privileges. This could include wholesale deletion of the logs or even manipulation of individual log entries.
Centralized log servers also provide a backup to anything stored locally. Administrators may choose to store logs more permanently on central log servers than on the endpoint systems. The log server would be configured with larger storage so the logs on each server could be rotated to leave the disk space there for where it is needed—serving the application that the server was implemented for. The central log server may be considered to be the primary source for log data, even though I referred to it as a backup. This simply means that it's a place to archive logs but since the logs have been moved off of potentially untrustworthy endpoint systems, they may be considered a primary source.
Using a centralized log server also allows log watching to be done in one place rather than taking up processing on every server. With all the logs being forwarded to a single server, that server can become the place where logs are watched for anomalies. This is common in intrusion detection systems, where logs may be monitored for specific events in order to trigger alerts based on those events. There may be some latency involved in the detection because it requires the log entry to be forwarded off the server that generated the log, but in practice that shouldn't be very long, assuming the logs are not batched up for sending, which can slow down delivery. If each entry is forwarded off as it is created, the delay is milliseconds for the log to be sent to the log server and then it is dependent on the log watching service and how regularly it is watching the logs.
A number of systems can do centralized logging, including both commercial and open source offerings. Depending on your needs, you may use a unified offering that can do log gathering as well as monitoring and alerting. You may also choose to use separate applications for the log hosting and the monitoring or alerting.
Syslog
Syslog is an old Unix-based logging system. It was initially developed as part of the mail server Sendmail. Since that time, it has become the predominant way of logging on Unix-like systems. This includes Linux, Solaris, AIX, HP-UX, and macOS, to a degree. There have been other implementations aside from the original syslog, including rsyslog and syslog-ng, but the specification for how syslog functions remains the same. For consistency, most of the references from here will be to the standard or generic implementation: syslog. If there is a reference to a specific implementation, the name of that program will be used. Syslog originally functioned as a de facto standard until it was eventually fully standardized by the Internet Engineering Task Force (IETF).
Syslog specifies different facilities, which indicate what type of event the log entry is. Using these facilities, the syslog server can determine how the log entry is disposed of. Each facility may be sent off to a different log file. The latest request for comment (RFC), document, RFC 5424, specifying how syslog is to function, defines the facilities shown in Table 7.1.
Table 7.1: Syslog Facilities
| Facility code | Keyword | Description |
| 0 | kern | kernel messages |
| 1 | user | user-level messages |
| 2 | mail system | |
| 3 | daemon | system daemons |
| 4 | auth | security/authorization messages |
| 5 | syslog | messages generated internally by syslogd |
| 6 | lpr | line printer subsystem |
| 7 | news | network news subsystem |
| 8 | uucp | UUCP subsystem |
| 9 | - | clock daemon |
| 10 | authpriv | security/authorization messages |
| 11 | ftp | FTP daemon |
| 12 | - | NTP subsystem |
| 13 | - | log audit |
| 14 | - | log alert |
| 15 | cron | scheduling daemon |
| 16 | local0 | local use 0 (local0) |
| 17 | local1 | local use 1 (local1) |
| 18 | local2 | local use 2 (local2) |
| 19 | local3 | local use 3 (local3) |
| 20 | local4 | local use 4 (local4) |
| 21 | local5 | local use 5 (local5) |
| 22 | local6 | local use 6 (local6) |
| 23 | local7 | local use 7 (local7) |
In addition to facilities, the syslog standard specifies levels of severity. This helps the applications to generate a log entry for a wide range of events and the system administrator can then determine which levels of those log entries they care about. As an example, a system administrator may only care to write out logs with a severity of Critical or higher. While the system and applications may generate log events for other severities, the syslog server, which is responsible for determining the disposition of each log event, may choose to discard those other log events. The latest specification for syslog, defined in RFC 5424, defines the severities shown in Table 7.2.
Table 7.2: Syslog Severity Levels
| Value | Severity | Keyword | Description |
| 0 | Emergency | emerg | System is unusable |
| 1 | Alert | alert | Should be corrected immediately |
| 2 | Critical | crit | Critical conditions |
| 3 | Error | err | Error conditions |
| 4 | Warning | warning | May indicate that an error will occur if action is not taken |
| 5 | Notice | notice | Events that are unusual, but not error conditions |
| 6 | Informational | info | Normal operational messages that require no action |
| 7 | Debug | debug | Information useful to developers for debugging the application |
You will notice that higher severities have lower numbers. The most severe log entry will have a severity level of 0. This may seem counterintuitive unless you are just used to that being the way it is. You might think that a higher number may correspond to a higher severity. Starting at 0 follows a common computer programming numbering scheme and it allows you to begin with what you most care about, with other numbers added later on as desired. The way it is currently defined allows all potential severities to be stored in three bits because the values of severity run from 0 to 7, and those values can all be represented with just three bytes.
A common syslog configuration file will include lines specifying what to do about log events based on facility and severity. In Figure 7.5, you can see a sample syslog configuration. This is from an Ubuntu Linux installation, using the rsyslog package. You should be able to see that entries include both the facility as well as the severity. This is done by specifying the facility followed by a dot (.) and then the severity. In some cases, if you want to indicate that every severity should be included, you would use the asterisk (*).

Figure 7.5: Sample syslog configuration file.
Each entry indicates what to do with the log events, typically by specifying a file to write the events out to. If you don't care as much about whether a particular event makes it to the log file, you can add a dash before the filename, as you will see in some cases in Figure 7.5. This tells syslog to just not bother writing the file out to disk after each log event. Instead, it will retain the log entry in memory until the buffer needs to be synced to disk.
As mentioned earlier, you can use one log setup for centralized logging. A syslog server can be used as a centralized log server as well as having the syslog server forward log entries off to a centralized log server. Syslog was initially designed to use UDP as the transport protocol, but since UDP doesn't have guaranteed delivery, you may want to make use of TCP. The rsyslog server allows you to use either TCP or UDP. The configuration setting for rsyslog to act as a syslog server is shown in Listing 7-1.
In addition to listening, rsyslog can be configured to forward log entries off to another server. This is a different set of configuration entries and, just as with listening, you can forward with both TCP and UDP. The entries in Listing 7-2 show how you would forward syslog entries off to a remote server. There are two entries here for both TCP and UDP. Commonly, syslog uses the well-known port 514 but it is possible to use a different port. You can see that in the first configuration file entry where the port 10514 is used instead of the default port. The first line also uses TCP, indicated by the @@ before the IP address. In order to forward using UDP, you would use the second example with a single @. You will also see *.*, which mirrors the way the log file entries look. What this means is every criticality and every severity will be forwarded off to the central log host. It is then up to the log host to determine what to do with those entries, based on its configuration file.
Once you have a syslog server established, you will then have log entries—you may have several log files to look at, depending on what your syslog configuration looks like. In Figure 7.6, you can see a sample of one of the logs. This particular log is the auth.log that stores information about authentication events. You can see entries for sudo, which is a way for a user to gain temporary superuser or administrative privileges. Additionally, there are entries for logins to an FTP server, pure-ftpd. Logs from services like this one can be used to correlate the NetFlow data we looked at before.
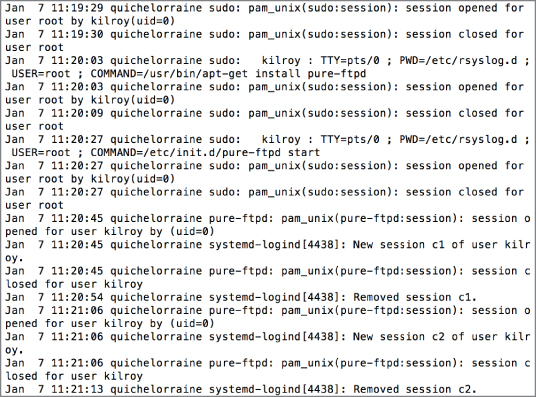
Figure 7.6: syslog entries.
Each entry includes a date and time stamp indicating when the event was generated. This is followed by the name of the system that generated the entry, quichelorraine in our case. After that is the name of the program that created the entry, followed by the message that was created by the application. Up through the name of the program is all created by the syslog server. The message originates with the application. Though the date and time stamp, the system name, and the name of the program are all going to be accurate based on the system configuration, the message from the application is only going to be as good as the programmer who wrote the program. If the programmer(s) was less inclined to be specific, the message won't be very useful. Good programmers recognize the importance of being clear and specific in log messages to help with troubleshooting, though, so most programs writing to syslog will generate useful entries.
Each syslog entry may only be useful if you understand the application that created it, however. As an example, if you didn't know what sudo was, you may not understand the entry about a session being opened. In this case, what that means is the user used sudo to gain temporary elevated permissions. Just having the logs alone may not be as helpful. In addition to having the logs, it may be necessary to have an understanding of the different applications that are logging.
Different services may generate their own logs and they may be stored in the same location as the logs syslog creates. As an example, the Apache web server will commonly store its logs in /var/log in a directory specific to Apache. On the Ubuntu system we have been looking at, the Apache logs are in /var/log/apache2, but on other systems, they may be in a directory named /var/log/httpd. Because it's the Apache server that writes these logs out, it's necessary to look at the Apache configuration settings to determine where the logs for that service are located. These logs can be essential to correlate with any network information that is gathered, whether it's packet capture data or NetFlow data.
You would use syslog on Linux systems and other Unix-like systems, and it's possible to forward logging events on a Windows system to a syslog server. On Windows systems, however, you would primarily use the Windows Event Log to look for Windows logs.
Windows Event Logs
The Windows Event Log has been around since Windows NT was released in 1993. Since then, the Windows Event Logs have gone through different iterations. In the most recent iterations of Event Logs, Microsoft has moved toward structured XML for storing log information on disk. Most of the time, users and administrators will use the Event Viewer, as seen in Figure 7.7. One advantage of the Event Viewer is that it collects everything into one interface. As you can see, Windows has a lot of Application logs in addition to the Windows logs. You can see this on the left-hand side of the interface. If you expand the Applications and Services section, you'll see that each vendor has its own folder for logs. Under the Microsoft folder, each system service has its own place to store logs. This is an extensive list, so having one place to look at all of them without having to wade through a single file for specific applications is helpful.

Figure 7.7: Windows Event Viewer.
Since the underlying storage of the events is not just plaintext lines as in syslog, but instead in an XML format, using the Event Viewer will help you extract all of the relevant information and present it in a meaningful way so it's easier to quickly parse the event. You don't have to read through the entire line, as you would with syslog. Instead, you can just look at the section of the event that most interests you. As an example, in Figure 7.8, you can see a single event selected in the top from the Security log. This is an audit event indicating that special privileges have been assigned to a login. At the bottom of the interface, each part of the event is broken out so you can look directly at the section you are most interested in. You may want to find the Event ID so you can look it up with Microsoft on their TechNet pages to learn more about the event. You can find that in the bottom section with its own header. This ability to quickly parse an event can be helpful.
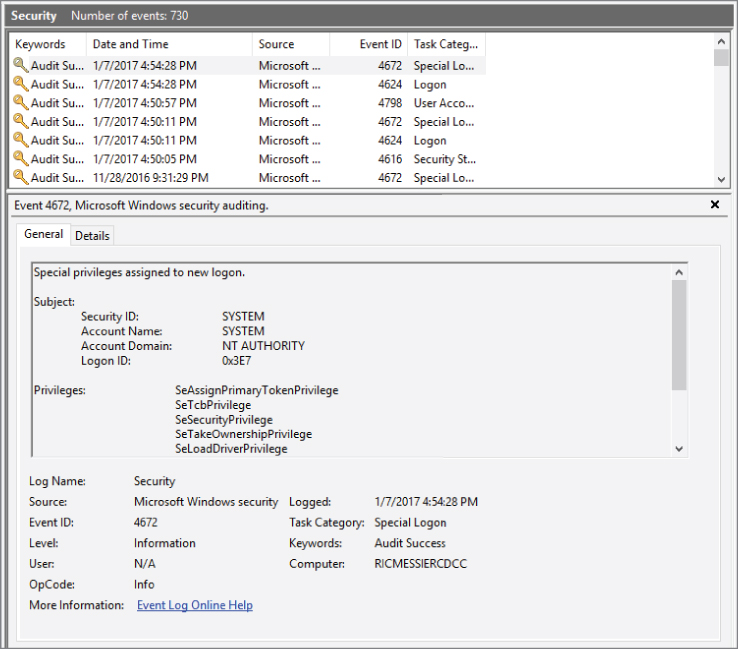
Figure 7.8: A Windows event.
While the Event Viewer will also allow you to filter and search, there are other ways to look at the Event Logs on Windows. One method is to use the PowerShell, which implements cmdlets to perform functions. One cmdlet that can be used to get access to the logs is Get-WinEvent. Using this cmdlet, you can get text-based representations of the events. You can see an example of its use in Figure 7.9. You need to specify which log you want to look at and in this case, we are looking at the Security log, just as we did earlier. You don't get the detail here as you did in the Event Viewer, but you can get a complete look at all of the events. Get-WinEvent has a number of other parameters that can be used to get more detail and change the way the data is extracted. For example, you may only be interested in 50 events. If that's the case, you would add –MaxEvents. You can also specify Xpath filters to get a limited view of the events.
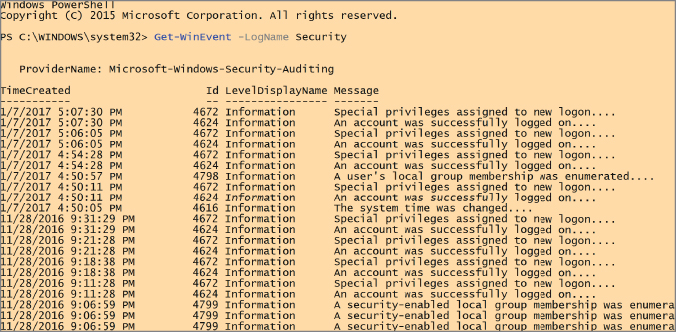
Figure 7.9: Using PowerShell for Windows events.
As with syslog, there are reasons you may want to look at the Windows Event Logs as either a starting point for a network forensic investigation or a way to correlate on the operating system side what was seen in the network. While the network never lies, in the sense that what you see on the wire is exactly what was sent on the wire, you may not have the entire picture without correlating with the operating system.
Firewall Logs
Firewall logs are another important tool when it comes to looking into network incidents. A number of different types of firewalls exist, of course, and we're going to look at a couple of them. Regardless of what firewall you may have access to, firewalls will commonly log what they are doing. This may include how the firewall is operating or the logs may relate to specific rules that have been configured. As an example, the logs shown in Listing 7-3 resulted from an iptables rule on a Linux system indicating that all communications to port 80 be logged.
While these logs may look obtuse and arcane at first glance, they are easier to understand if you carefully review them. Each entry here indicates the IN and OUT interfaces, which would be relevant if this host were configured as a network firewall, forwarding packets from one interface to another, rather than just an individual Linux host with iptables running on it. Additionally, you can see the MAC address, the SRC and DST (source and destination) IP addresses, as well as statistics related to the packet such as the length (LEN) and the type of service (TOS). You can also see the source and destination ports (SPT and DPT) Using this knowledge, the log entries should make much more sense.
Different firewalls will generate different looking logs, of course. You may also get different statistics from different firewalls. As an example, the PFSense firewall, based on FreeBSD, will show you the state of network connections. Providing a connection state may be a common thing across stateful firewalls, which have to pay attention to the state of each connection in order to determine whether or not connections are allowed. This means that the firewall knows whether the message is new—it hasn't been seen before.
A SYN message, the first message in a TCP three-way handshake, is recognized as a new message by a stateful firewall. An established connection is one that has been seen and been previously allowed. This means the firewall is aware that there has been previous communication and there is an entry in the state table. A related connection is one that is associated to but not directly part of an established connection. This may be something like an FTP transmission where a second connection is established from the server back to the client to transmit files.
In Figure 7.10, you can see a section of the state table from the PFSense firewall. This shows the different flows, meaning the connections from one system to another, as well as the state they are in. Additionally, you can see the number of bytes that have been transmitted over the course of that communication stream. The state table will also indicate which interfaces the communication was seen on. In most cases in this screen capture, the communication is over the WAN port, which is the external interface as far as the firewall is concerned. The LAN port is the one on the inside of the network.
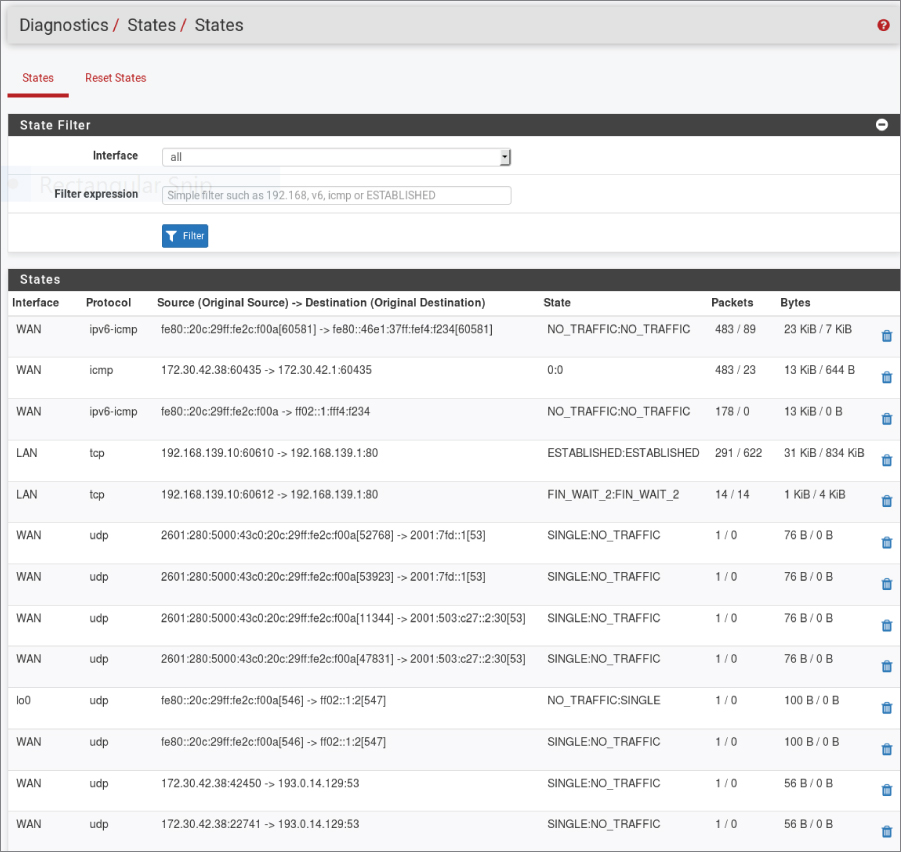
Figure 7.10: PFSense firewall state table.
No matter which firewall you are using, having the ability to look at the logs will provide you with some different points of correlation to events seen on the network. Additionally, you may see events that you wouldn't see in other places. The firewall may log packets that were dropped. This is not something you would see on the network because they would just not be responded to. You may assume that the packet was dropped by the firewall, but with the firewall log to correlate with other evidence, you may know for sure.
This is not to say that all firewalls will log dropped messages. The iptables firewall, included with Linux, does not automatically log dropped packets, for instance. The person writing the rule would have to either set a policy to log all dropped messages or set a log and a drop message for everything that was being dropped. Without the overall policy, there may be some messages that don't get logged when they are dropped. This is an area where some guidance can be provided to firewall administrators. The firewall can provide an important point of insight to an investigator, especially when it comes to messages that have been identified as ones that shouldn't be seen in the network.
One thing to keep in mind is that firewalls are commonly located on the edges of networks, but your idea of an edge may be different from a network administrator's. An easy place to see an edge is anywhere the enterprise network touches a service provider. This is a boundary point between two networks so it's clearly an edge. However, to a network administrator, the data center may be its own network and any connection to the outside world, even if it's to the internal business network, is an edge. This is because the data center is commonly where the most sensitive information is stored. As a result, there may be a firewall between the data center networks and every other network in the business. Another place where you may find a firewall is the connection between a WiFi network and the rest of the internal network. The primary point here is that you may find firewalls turning up interesting information in an area you may consider the inside of the network. Different areas of an enterprise network may have different security needs and thus some will have more restrictive rules applied than others.
Just as with other logs, firewall logs take up disk space. With large networks, firewalls can generate a lot of log data. This may be one reason why not all dropped packets get logged. Since there are adversaries everywhere, there are often port scans and ping sweeps happening on a regular basis. Logging all of this activity when it is dropped can consume valuable resources. As a result, it's important to consider the trade-offs. How much visibility do you want with regard to network information provided by the firewall logs as compared with how much it will cost in disk space and processing by the firewall and log monitor?
Router and Switch Logs
Routers and switches are capable of generating logs, not surprisingly. There are a number of reasons why you may care about the logs these devices can generate. For a start, the logs will indicate who has accessed the administrative interfaces for these devices. You will be able to see who has been doing work on the device and when they were doing it. This may include failed attempts to access the device, which could provide an indication that someone is trying to break into the administrative interface. You may also get accounting information associated with configuration changes. This may be helpful to understand why the network is behaving differently than it had previously. A number of administrative logs can be helpful in uncovering this information.
It is important to keep in mind that routers and switches have multiple interfaces, by design. There are interfaces where the business of the device takes place—whether it's an Ethernet or serial interface for the router to forward packets from one interface to another or whether it's the Ethernet interface each system on the network plugs into on a switch—and there are administrative interfaces. Typically, the administrative functions happen on a separate interface. Switch ports, for example, don't have an IP address so they can't be directly addressed anyway. However, there is a separate interface where an administrator could connect using SSH or HTTP to perform management functions.
Beyond the administrative traffic and logs, however, routers will often have the ability to perform rudimentary access control using access control lists (ACLs). An ACL is a very basic type of firewall, in the sense that it can cause the firewall to drop or allow packets as they come through. Whereas a higher level firewall can make more complex decisions, a standard ACL commonly looks at source and destination addresses and port numbers, though there are extended ACLs that can provide more functionality. Packets an ACL drops may get logged and these logs are worth taking a look at, just as firewall logs are.
On the switch side, since it operates at Layer 2, there are no IP addresses or ports to make decisions on. The best that can happen is to assign a MAC address to a particular port. If a device is plugged into a port with the wrong MAC address, that may get logged and that would be of interest, potentially, because it may demonstrate someone trying to connect a rogue device to the network. Additionally, switches will commonly keep track of traffic passed across different interfaces. Routers will do the same thing. Looking at statistics provided by these network devices can be helpful in detecting unexpected activity on the network.
Log Servers and Monitors
Earlier, we talked about using a syslog server as a centralized log host, but there are other log servers you can use. An advantage of using a log management package is the other functionality that you can get. In addition to just collecting logs and storing them, packages like Nagios or Splunk will allow you to more completely manage the logs by helping with search and analysis. Just collecting logs and allowing them to sit on a disk isn't particularly helpful to an organization, even if having the logs later on will help you as a forensic investigator. If the logs are just collected and allowed to sit, you may never know there is something to look at. This attitude toward logging may be a cause of organizations having suffered breaches without being aware for years. The evidence could be in the logs and they simply aren't doing any analysis or monitoring.
Nagios began life in the late 1990s as a monitoring solution designed to run on Linux. Currently Nagios has commercial offerings as well as an open source offering that can be installed. Part of the functionality offered by Nagios is being a log management solution. Nagios, like so many other programs these days, uses a web interface for a console. You can see the Nagios console in Figure 7.11. Configuring Nagios for monitoring and log management requires manipulating the configuration files on disk. You can add in multiple services to manage and it supports monitoring multiple types of systems and services.
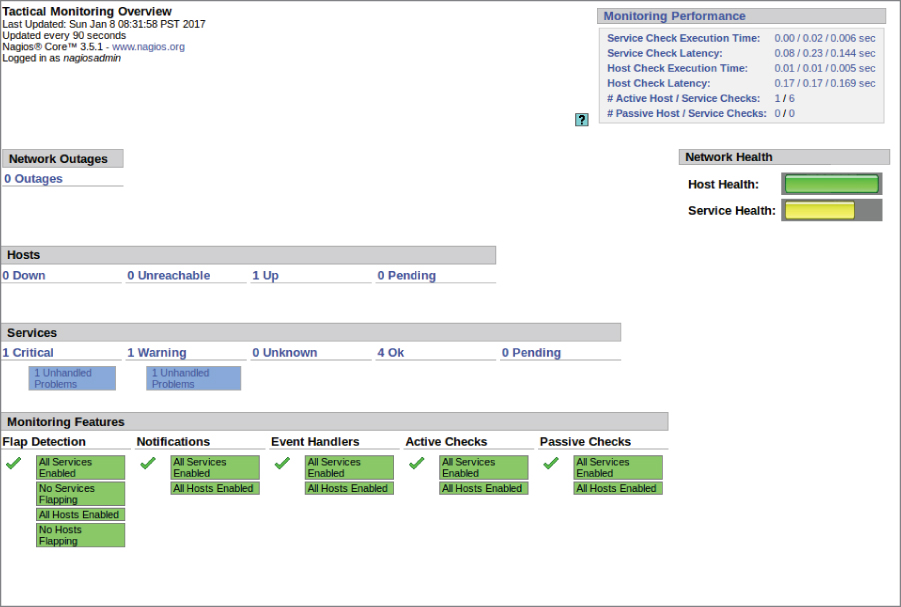
Figure 7.11: Nagios monitoring console interface.
Another popular solution for log management and monitoring is Splunk. Splunk has commercial offerings but it also offers a light version for free if you want to try it out to see how it operates. Splunk can be configured to look at logs on a local system where the Splunk server is running. The configuration page on the web interface is shown in Figure 7.12. You can also configure it to be a syslog listener for other systems to send log data to. On the left-hand side of the interface shown in Figure 7.12, you can see TCP/UDP. Selecting enables you to configure Splunk to be a listener for syslog data.

Figure 7.12: Splunk data configuration.
Once you have data configured, Splunk indexes the data and enables you to search all of your data sources for patterns. You can also set up alerts, based on information you care about looking at. In fact, Splunk will analyze the logs and locate patterns for you. You can see this in Figure 7.13. On the Ubuntu system Splunk was installed on, Splunk looked through more than 15,000 events to isolate 100 patterns, which are shown. You will see a percentage on the left-hand side of the display. This indicates the percentage of the total events where this particular log entry shows up. Selecting the event will provide a total number of instances, the ability to view the events, and a chance to create an alert based on this particular event.
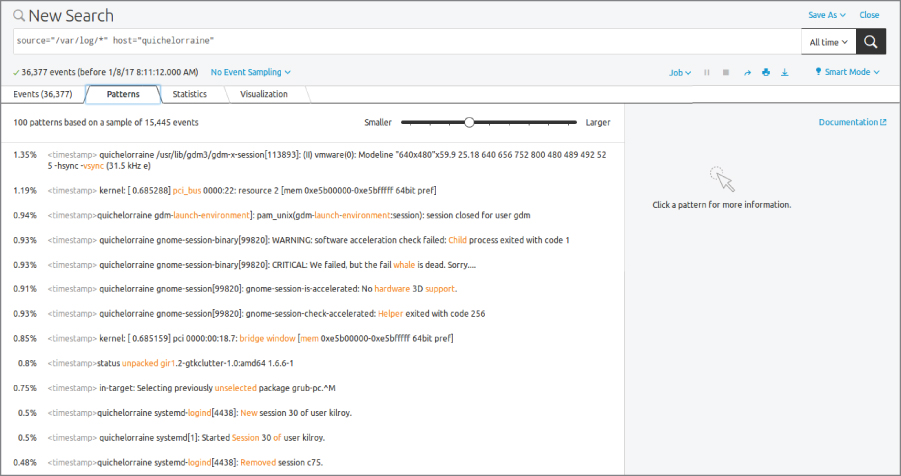
Figure 7.13: Splunk patterns.
Although you can perform analysis on large data sets without acquiring commercial tools, using a tool like Splunk or another log management or analysis program can make life considerably easier. This is even truer when you have more systems. In this case, 15,000 events were generated over the course of less than 24 hours. Not long after taking the screen capture showing 15,000 events, the number of events had risen to 18,000 and that's only on a single host. You can see how having a program to do analysis and management of logs for you could be very helpful. This is not to say that you should rush out and get Splunk; a number of log management systems are available, and based on your needs and budget you may find a different one to be more suitable.
Antivirus
Antivirus programs can be a useful source of information during an analysis. The logs should be able to indicate not only if and when a file has been isolated as potentially problematic, but also when the definitions have been updated. As you may know, antivirus programs rely on definitions of known malware in order to be able to identify a file as a virus. If the program doesn't have a definition, it can't identify the virus. This is one way systems can still be infected in spite of running antivirus, even if the definitions are regularly updated. Until someone has created a definition, the virus is going to go undetected. Knowing when the definitions have been updated, as well as which malware has been added in each definition set, can help to get a timeline that may aid in your investigation.
Some enterprise systems may not allow users the control over what happens when a file has been isolated and removed. However, if the specific implementation you are looking at does allow that control, you may be able to see when users have removed files from quarantine. Again, this can help you with timeline analysis and it may also provide you with filenames to investigate further.
Keep in mind that as you look at enterprise antivirus programs, you may need to look in different places for the log files. They may be stored on the local systems in text files or they may be in the Windows Event system. The location depends entirely on the package used and the way it handles logging. Some packages, if they are multi-platform, may just write logs to disk directly so they don't have to rewrite the logging portion of the software for each platform they operate on. Writing to disk will be the same across all platforms, so it's easy to do once and include on all implementations. You may also find that logs are pushed back to an enterprise console, so they may be stored on a server. Again, you may need to look for them in different places on the server. It is entirely dependent on the implementation of the antivirus software.
Incident Response Preparation
When an incident occurs you will be much happier if you have systems and capabilities in place ahead of time. On the business side, there should be a policy in place that creates an incident response team (IRT). The IRT should make collective decisions regarding how they are going to prepare themselves. This may include making recommendations for different capabilities in the network like enabling NetFlow or having a log management system in place. As with anything else, these will need to be justified from a cost perspective. This requires understanding the potential for an incident to occur as well as the types of incidents that may occur.
This is not a place to be Chicken Little. It's important to be reasonable, rational, and objective when creating potential scenarios. If you go into this saying the world is coming to an end you aren't likely to be taken seriously. You need to be able to really understand the business, what the threats are, and their potential for manifestation. This will help with scale so you aren't asking for the largest possible solution just because it will make your job easier. You need to accept that you won't get everything you would really like to have just because it may one day make your job easier. Resources will always be limited. If you are not already a part of the incident response team, working closely with the incident response team on developing a plan that is both workable and reasonable is important.
This is another place where thinking ahead and some software may be beneficial. When you have a virus outbreak, for instance, there will be an impact on hosts. In the end, many attacks that take place on the network have an impact on the hosts. They will not always be just distributed denial of service (DDoS) attacks that your service provider will have to handle, because nothing you are able to do has any impact other than to further flood your network connection sending out RST or other network messages.
You may need to be able to pull data back to a central place quickly to correlate what you are seeing on the network. Software packages can help with that. In fact, a number of software packages are available that can help with incident response and forensic investigations. Log management solutions will be covered in another chapter. While much of this is done on the host, it is useful to be able to correlate your network traffic with what is happening on the host. Some of these software packages will not only look at host artifacts like what is on the disk, but they will also look at memory. In the case of a network attack, particularly when it comes to a malware infestation and communication with a command and control server on the Internet, memory analysis can be essential.
Google Rapid Response
Google Rapid Response (GRR) is an open source offering from Google that helps to give you quick access to systems on the network in the case of an incident. GRR uses a client/server model where you install the server somewhere and employ a web interface to use it. Then, you install clients on the endpoints you have control over. The endpoints communicate with the server so you can quickly gather information from them. When something happens, you will want to pull data and do some analysis. Using the Hunt feature, you can search for specific types of data from your clients. You can see a sample of some of the things GRR can hunt for in Figure 7.14.
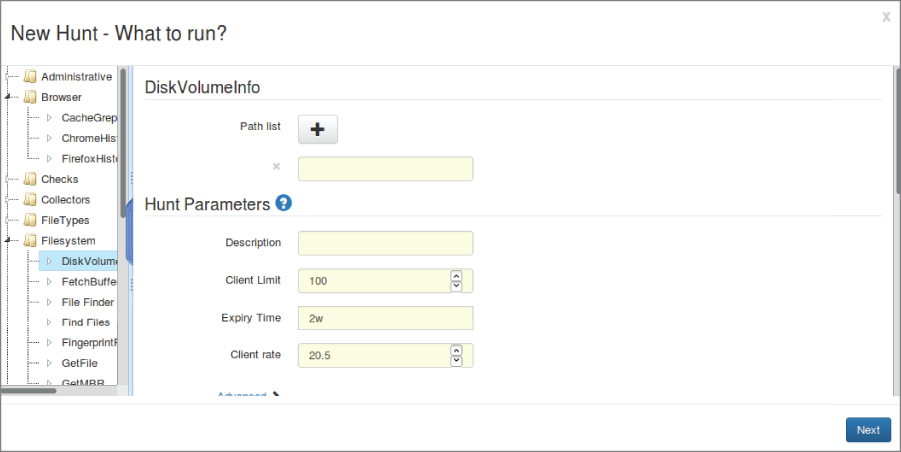
Figure 7.14: GRR hunt.
As noted at the end of the previous section, investigating memory can be important during an incident. In some types of attacks, it is essential. GRR makes use of Rekall, which is a memory analysis tool forked from Volatility. Rekall can extract information from memory dumps, assuming it has an understanding of how the memory is laid out for that particular operating system. Different operating systems, including different versions of operating systems, have different memory layouts when it comes to locating data structures within the kernel that point to where processes are in memory as well as other information that the kernel keeps track of, like network connections.
Of course, GRR can also look at files on the clients, though that would fall under the category of operating system forensics. It is hard to peel apart network forensics and operating system forensics sometimes, though, since what happens on the network doesn't stay on the network. In many cases, you are using the network to corroborate what you are seeing on the host, or you are using the host to corroborate what you are seeing on the network. A tool like GRR can help to corroborate your other, more purely network-based artifacts.
Commercial Offerings
GRR certainly isn't alone when it comes to incident response software. One of the early commercial offerings in this space was Carbon Black. Carbon Black also offered a client/server model where the server is used for clients to communicate with. The server functions as a console for an analyst to communicate with in order to interact with the clients. Using the console, an analyst can extract necessary data when an incident occurs. This is similar to the way GRR works.
As the need for endpoint protection has become more obvious, other companies have gotten into the space and the ones already there, like Carbon Black, are moving away from strictly focusing on incident response prep and more toward detection and response. This response can include prevention or protection and less strictly from an investigatory perspective. Walking through the vendor booths at a recent BlackHat event, it became clear that many companies that didn't previously have any offerings in the investigatory space are suddenly interested there. Other companies, like CrowdStrike, are newer and are involved in incident response, investigation, and endpoint protection. CrowdStrike uses a Software as a Service (SaaS) cloud-based model for its service offering, which is a little different from others in the space.
Even venerable forensic software vendors like Guidance Software, makers of EnCase, are getting in on the incident response action. In addition to EnCase, which is good at a more traditional dead box forensics investigation, Guidance Software, along with other companies that have forensic software, have offerings that are moving more toward the incident response model, recognizing that more and more, live analysis, including detection and perhaps prevention, is necessary given the adversaries companies are facing. Of course, a company like Guidance Software and its multiple offerings can integrate across different type of investigations if you are using all of its solutions.
Security Information and Event Management
One type of software that you may see more and more of in the enterprise space is for security information and event management (SIEM). This is considered an intelligence platform that merges some of what we talked about earlier with respect to log management along with an alerting or event management platform. In this way, an operations team can get access to all of the information they need as well as manage the event from start to finish. You don't have to create events (tickets) any longer in one system while taking information from another. The idea of a SIEM is to put all of the intelligence and the workflow into a single system. This hopefully prevents the need to stare at multiple screens simultaneously or take your eyes off one screen in order to work in another as you enter notes about an event. Everything comes together in one unified system. This can help to minimize blind spots by not having data scattered across multiple repositories, viewed by multiple groups. Additionally, pulling everything together helps with correlation since there could be multiple events happening on multiple systems that are all related to the same incident. Pulling it all together helps to reduce time spent by multiple groups working the same issue.
An advantage to this type of system is the ability to perform correlation across multiple sources of information. Events are not always isolated, meaning they don't always originate in the network and stay there. They also don't originate on a single host and stay there. There are generally multiple sources of information, as we have discussed. The advantage of a SIEM is that you can provide all of your data sources to the SIEM and it can handle correlation across multiple data points. This does generally mean, though, that you have to understand your network and data points well enough to be able to generate rules to allow the SIEM to create alerts or events that you can follow up on.
The danger of a system like this is simply information overload, though that danger is not at all limited to a SIEM. However, if you have all of your information sources in a single system, there may be either a desire to create a lot of rules to look for potential problems or there may be a lack of understanding of how everything comes together, such that there may not be enough or even the right rules in place to be able to see what is happening. As always, it comes down to defining what you care about so you can only look at those things without needing to look at everything else.
Used correctly, a SIEM provides an extraordinary amount of power by combining disparate data sources from your hosts and your network devices, including intrusion detection systems as well as routers, switches, and firewalls. However, as suggested before, just because you can look at something doesn't mean that you should be spending your time there. It's tempting to alert on everything and follow up on it, but a much smarter and more efficient approach is to identify what you care about so you can pay attention to just that. A SIEM offers the potential to weed out the things you don't care about while still retaining that information in case you need it later on.
As with the log management solutions, a SIEM needs to act as a log server in order to consume all of the different data sources. This means that it can act as a syslog server and you can point all of your Unix-like systems at it. There may be clients that get installed to collect other types of information in addition to being able to act as a log host.
In addition to the commercial offerings in this space, some open source offerings may be worth investigating. OSSIM is one that is currently managed by a company named AlienVault. OSSIM is an entire Linux distribution that you install and get all of the capabilities of the SIEM rather than having to install applications on top of an existing operating system. Considering this is security information, you want your operating system installation to be as hardened as possible. OSSIM takes the need to install and harden the operating system out of your hands, which should make the vault where your security information is kept harder to get into.
Prelude is another piece of open source software that purports to function as a SIEM in that it takes information from multiple, disparate sources like logs and intrusion detection systems, both network and host-based, and collects them together. Prelude can be installed on any Unix-like operating system and includes a web-based console called Prewikka that functions as the interface. As with other, similar solutions, Prelude uses agents that communicate back to a manager. The web interface communicates with the manager to display all of the information that has been funneled into Prelude.
You may find that you don't need a SIEM for your purposes, but because it is a possibility as a place to aggregate a lot of data sources, including log data from network devices, it's useful to know that these types of software exist. Because you can create alerts from them, it can help to know when there is an incident worth looking at, assuming that the alert has been created correctly.
Summary
Network and host-based investigations are inextricably linked because nothing happens in isolation. As a result, some of what we have talked about in this chapter revolves around collecting information from hosts. This is done in order to correlate with the network information you hopefully already have in place. The network data will tell you how they got there and what was sent, that you may not get from application logging. This information that you can collect as a point of correlation is log data from network-based sources like switches, routers, and firewalls or it can be logs from operating systems where network services are running. Because almost nothing stays in the network, network attacks are often targeted at specific network services. Understanding what is happening with the services and the operating systems can help you get a better grip on what is happening in the network.
A number of software packages and solutions can also help with the enormous volume of information that is accumulating. This may be a log management solution or a security information and event management solution. Incident response solutions are also available that can help with not only collecting information, but making it easier to perform an investigation when an incident happens.
In the end, a lot of it comes down to being prepared. All of these solutions require they be in place ahead of time, whether it's configuring NetFlow on your network devices or acquiring a software package to aid in the investigation. Enterprises should have incident response teams, which can help to set priorities, and define and implement solutions that need to be in place ahead of an investigation. Because an incident response team is often, and probably should be, cross-functional, there may be members of the network or security groups participating. This means they would be able to provide guidance on what is in place and what needs to be done.
Keep in mind that resources are always limited. Prioritizing needs and making a case for expenditures is essential. This is best done through logical, rational, and objective analysis of the potential for incidents and what is absolutely essential when it comes to performing an investigation.