
3
Host-Side Artifacts
He sits at his computer, typing away, looking for the next system on the network to compromise. He is talking to his target over the network and is aware that a savvy user could identify the communication stream. Because his target is a computer protected by a corporate firewall, he wasn't able to set up a listening service. In this case, he would only do that on other systems on this network. He can get access to them through this computer more easily than having all of them trying to communicate out. The great thing about firewalls for his purposes is that they typically allow network traffic out without much in the way of restrictions. This is especially true if what is being transmitted looks an awful lot like a commonly used protocol over well-known ports.
One challenge to this approach is that a savvy user may be able to detect his communication. He has done his best to cover his tracks but there is always a possibility of being caught. For the moment he is safe, but because every passing day continues to leave the door to his detection open, he works fast and tries to be smart, restricting the network traffic to a minimum where he can. If what he does is mostly during off-hours while the user is home and entirely unaware, avoiding detection is quite a bit easier.
Network forensics can take advantage of the fact that every operating system has to keep track of network communications. When the operating system keeps track of something, it's possible to extract that information. Most operating systems provide programs that are capable of presenting information about network communications, but not all users are aware of these programs and not all of them are as easy to use as a typical application is. Most are command-line–based, which may scare some people. Once you get the hang of how to use them and how to read their output, though, they are invaluable.
In order for systems to communicate, one of those systems has to be listening. That is done with a type of program that is commonly called a service. Services are implemented differently on different operating systems but the end result is the same—when a network service is running, a program is listening for network communication to arrive. Understanding more about those networks and how to determine what is running is important.
Attackers may use something called a rootkit to help disguise their existence on the system. A rootkit may open up a network service called a backdoor, allowing the attacker to more easily get into the system remotely at any time. Backdoors are useful because, if the service the attacker exploited was later patched, the attacker wouldn't be able to continue to use that way in. So, a backdoor allows continued access, regardless of what happens to the original entry vector. A rootkit may also install programs that will hide the existence of the attacker. This may include overwriting the programs that are included with the operating system that will tell you what is being done on the network. Fortunately, we don't have to rely on the operating system for these sorts of tools. Third-party programs are available that don't rely on anything having to do with the programs and libraries provided by the operating environment.
Services
Imagine that you want to read the latest news about your favorite mobile operating system. Maybe Google is working on a new one and you need to know the release date. What do you do? You might use Google Chrome to connect to Google to search for a page that has information about the release date. What is happening is that your browser (Chrome) is making a connection to a service on a system on Google's network. This service is a program that takes Hypertext Transfer Protocol (HTTP) requests on TCP port 443. HTTP is the protocol being used but port 443 indicates that it has been encrypted. Port 80 is commonly for unencrypted communication. Ultimately, a service is just a program that runs, mostly quietly, in the background waiting for connections from client programs across the network. Any computer system may have a number of services running and the majority of them will start when the computer boots. The operating environment knows about these services and starts them automatically when the computer starts up.
Each operating system will engage with its services in different ways, both from an administrative perspective as well as how the services are handled by the operating system. From a management perspective, perhaps Windows is the easiest to understand. Windows also offers the most options in terms of how services are started up. To make it easier to see this and understand it, take a look at the screen capture of the Services applet from Windows 10 in Figure 3.1. You can see a list of some of the services available on the system.

Figure 3.1: Windows Services applet.
On a Windows system, a service is a program that has no user interface component, so it isn't visible to the user. Additionally, a Windows service is a program that is written in a particular way so that it responds to interactions from the Service Control Manager. A service is expected to be able to start and stop, based on messages from the Service Control Manager. Services also have multiple startup options. The Service Control Manager may start the service automatically when the system starts; it may also start automatically with a delayed start or it may be set to start manually. A service that starts manually either has to be started by a user through the Services system utility or it can be started if another system requires it as a dependency in order to operate correctly. You can see the Properties dialog box for the Block Level Backup Engine Service with the different startup options showing in Figure 3.2.
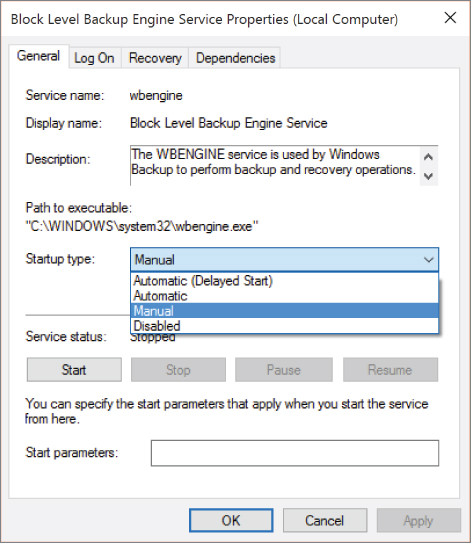
Figure 3.2: Windows Service Properties dialog.
This is not to say that programs that listen for network connections have to be Windows services, but if you want a program that starts automatically at boot and runs quietly in the background listening for requests, it has to be a Windows service. One way to check whether a service is installed and running is to simply open the Services utility and look for a Status indication, as demonstrated in Figure 3.1. Services that aren't running have no entry in the Status column.
Unix-like operating systems have programs that can run in the background as well. A service on a Unix-like system is typically called a daemon, named, in part, for the benevolent spirits from Greek mythology. Since macOS (formerly Mac OS X) is based on a Unix-like operating system, it uses daemons. However, macOS doesn't use the same means to start services as Unix-like operating systems traditionally do. The macOS startup program is launchd. It serves the same function as a program like init on a traditional Unix-like operating system.
Services on a macOS system are stored as property list files in /Library/LaunchDaemons, as shown in Figure 3.3. The program that is the actual service process is stored as a string in the ProgramArguments key. You can see that the program in the com.microsoft.autoupdate.helpertool launch daemon is /Library/PrivilegedHelperTools/com.microsoft.autoupdate.helpertool. It may go without saying but this is a daemon that runs in the background, helping Microsoft products on this system stay up to date.

Figure 3.3: macOS launch daemons.
Linux systems may have two different ways to manage services, depending on what distribution they are. Traditional Unix systems use init as the process that starts everything and services that start at boot time are managed by init. Services that are managed by init use shell scripts for their management: start, stop, restart, status. Similar to Windows and the Service Control Manager, these scripts are expected to respond to particular messages. These messages are parameters that are passed on a command line into the script. In Figure 3.4, you can see a listing of the /etc/init.d/ directory where all of the startup scripts are kept on a system that operates using init. At the bottom of Figure 3.4 is a section of the service script for the Secure Shell (SSH) service. This is the piece of the script that responds to a request for status. Similar sections handle the start and stop requests. In the case of this script, it also handles a number of other requests like restart and reload, though not all services will handle other management functions.

Figure 3.4: Linux service scripts.
Not all Linux systems use init, however. A newer system super process that would be responsible for starting and managing system services is named systemd. There are a number of reasons for moving to a different super process and one of those has to do with the complexities associated with system startup and services conflicting or starting out of order. On a traditional init-based system, the services are started in alphanumeric order based on how they are named in the directory where they are located. This requires a special naming convention for those directories. Commonly, the directories would be based on run level, which is a numeric designation based on the functionality expected from the system—single-user, networking, graphical user interface and networking, and so on. In those directories would be a series of links to the scripts in /etc/init.d/. The links would be named based on whether they were intended to be used to start up or kill the service. Startup scripts have names starting with S, followed by a number indicating the order in which the script was to start. If your service relied on another service to be operating, your service would need to have a higher number.
In systemd-based systems, each service gets a configuration file indicating dependencies. In other words, you can specify which services have to be operating for yours to function correctly. Listing 3-1 shows an example of one of those startup configuration files for the postfix mail service. The systemd configuration also allows the service to indicate whether other services would conflict. As an example, this configuration file indicates that sendmail and exim, both also mail transfer agents, would conflict, so if they are running, this service shouldn't even bother trying to start because they would try to listen on the same port and two applications can't listen on the same port.
No matter what the operating system is, not all services relate to network communications. Many services are simply about providing background functionality to the system and other services. Just because you see a number of services on a system doesn't mean that you are looking at a lot of programs that are providing network connections or even potential network connections to other systems.
Connections
When it comes to network connections, we are primarily talking about TCP communication. TCP communication can be thought of as stateful because there is always a state to any communication. When you hear the term stateful, you may think firewalls since one type of firewall is a stateful firewall, meaning that it keeps track of the state of network communications between two systems. Stateful firewalls not only have to keep track of the state of TCP communication, which can be discerned by looking at any given packet or set of packets that are passing between two systems, but they will also generally keep track of the state of other protocols simply in order to make determinations about what traffic should and shouldn't be allowed through the firewall. However, before we go any further, we should talk about the different states.
First, we have a network service. This is a program that is listening on a network interface. Programs that have TCP listeners have to bind to a port and IP address to announce their intention to start listening for network traffic. This essentially registers an endpoint with the operating system kernel so if any network communication comes in on the registered port, the kernel will know where to send the data. Once the program has registered the port it wants to listen on by binding to that port, it can start to listen for connections. At this point, the port is in a listening state. As you see in the “Tools” section later in this chapter, the port and program can both be demonstrated to be in a listening state.
Every connection in TCP exists as a particular state, shown in Table 3.1. As we start to look at some of the tools that provide information about the state of connections, it may be helpful to understand what each state means and how we get to that particular state.
Table 3.1: TCP Connection States
| State | Description |
| CLOSED | The port has no program waiting to communicate on it. Because there is no program associated with it, there are no communication streams. |
| LISTENING | The application has bound to a port and is waiting for connections. |
| SYN-SENT | The operating system has sent a SYN message to the other side so this would be on the client side because clients initiate requests to services in most cases. |
| SYN-RCVD | A SYN message has been received and the communication stream is considered half-open at this point until an ACK has been received in response to the SYN-ACK that would be sent back to the client. |
| ESTABLISHED | Once the three-way handshake has been completed, the communication stream is considered to be ESTABLISHED. |
| FIN-WAIT | This may be waiting for an ACK to a FIN that has been sent or it may be the case that a FIN has been sent and an ACK received and the system is now waiting for the FIN on the other side to be sent. |
| CLOSE-WAIT | The system in question has received a FIN and sent back an ACK. It is now waiting for the application on its side to complete in order to be able to send a FIN. |
| CLOSING | This is the state where one side is completely torn down with a FIN and corresponding ACK but the other side has sent a FIN without receiving an ACK back yet. |
| TIME-WAIT | A timer is responsible for this condition. Once you receive a FIN message and send back an ACK, the system has no way of knowing that the ACK has been received without getting an ACK back and that would turn into an infinite loop of ACK messages. Instead, the system waits a specified amount of time, holding the connection in a TIME-WAIT state just to be safe. Once the timer has elapsed, the communication is finally completely torn down. |
Recall from Chapter 2 that the first communication is a SYN message. Once the program has received the SYN message, the communication is in a SYN-RCVD state, indicating that the SYN message has been picked up by the operating system. The other end of the communication is in a SYN-SENT state at that point. Because we are only partway to our final goal of a completed connection, the communication stream is considered half-open while the operating system waits for the final leg of the three-way handshake. During this period of time, it will hold out a small piece of memory assuming that the connection will complete. Once the three-way handshake is completed, the communication is considered to be ESTABLISHED.
In the process of tearing a connection down, there are also a number of different states. If a system sends a FIN to the other end of the conversation, it must then wait for that other end to send a FIN of its own before the connection is fully torn down. While it is waiting for that FIN, the connection will be in FIN-WAIT state (if this is the first side to tear down, it will be FIN-WAIT-1). If a system receives a FIN from the other side but is waiting for the application handling the communication to complete and request a FIN, the connection is in CLOSE-WAIT state because it is half-closed and waiting to start the process of fully closing the communication channel. Once the application says okay, we're done; the system can send its own FIN. During the brief duration that the FIN has been sent but the corresponding ACK hasn't been received, the connection is in CLOSING state. A connection will also be in a TIME-WAIT state. This is the brief duration, and there is a timer specified by the protocol definition that governs this, while the connection is being torn down and the system is waiting to make sure the ACK in response to a FIN on the other side has been received. When the other party sends their own FIN and are waiting for a response, that is FIN-WAIT-2. Unlike the three-way handshake, the teardown of the connections recognizes that both are capable of communication so each end has to originate its own teardown.
While an application is running and it has been bound to a port, that port is considered to be in a LISTENING state but the other side of that is CLOSED. If a port has no program listening, the port is simply considered CLOSED. The vast majority of ports on a system—recall that there are 32,768 ports available for TCP communication—are in a CLOSED state.
Keep in mind that while a communication stream can be in an ESTABLISHED state, the application and therefore the port can and will still be listening because the operating system allows for multiple communication streams to a given port. Any TCP-based communication is described by a four-tuple, meaning there are four pieces of information you need. Any connection is described by the ports and IP addresses on both ends. For every communication pathway, there is a source and destination IP address as well as a source and destination port. Because communication is bidirectional, one system's source port is the other system's destination port. Each side will have a four-tuple describing the connection with the source and destinations swapped on each end.
While UDP traffic is entirely stateless, some systems like firewalls or any device that has a firewall built into it will have to maintain a state table. Once a UDP message has gone out, there is a chance a response will be received. If you are blocking UDP ports except for responses to messages that have gone out, you need to maintain a table to keep track of the four-tuple in order to match source and destination IPs and ports to make sure the return traffic is allowed back in. While UDP itself is stateless, stateful firewalls will have to keep track of the state of network communication just to make sure everything continues to work as expected.
While this might seem to be largely theoretical—because the communication happens so quickly you wouldn't be able to tell what state any communication is in—programs are available that will show you the state of network communications. This is a crucial artifact because network communications are kept by the operating system. This means the information about those communications is stored in memory. All it takes is the right tool to pull that information out and the ability to read it correctly once it is out.
Tools
As you are looking for artifacts, you will likely be working on a live system. Once you have shut down the system, all of the network artifacts go away. Network information is retained in memory and not on disk because everything is in operating system data structures. The only way to retain any of the information for offline analysis is to get a memory capture. Otherwise, you have to look at the system while it is up and running. There are challenges with this, one of which is that you may be detected if what you are investigating is a system compromise. Once you are poking around on the system, your adversary can see what you are doing and potentially adjust accordingly. This makes it harder to investigate what is really happening. Subsequent chapters look at investigating from outside the system; in this chapter, the only way to get to what the host knows is to actually be on the host.
The second challenge associated with performing an investigation on the host itself is that your tools may be compromised. Each system comes with a number of built-in utilities that are used for diagnostics while the system is operating. Because these utilities are built in, they can be compromised by an attacker so any output they provide may be suspect. Fortunately, we aren't limited to just the utilities that are provided with each operating environment. A number of third-party utilities are available as well. This is especially important if the third-party utilities can be run independently without making use of any of the installed libraries on the system.
netstat
Netstat is a command-line utility that provides a lot of network information. If you need to know what the routing table looks like, meaning what IP address packets going off the local network need to be sent to based on their destination address, you would use netstat. In addition to the routing table, netstat provides a list of all of the open communication streams, as Figure 3.5 shows. The netstat –a command displays all of the existing and active communications including their state. In the top part of the figure, you can see that a large number of communications are in the ESTABLISHED state. This means that they are communicating over TCP and they have completed the three-way handshake. It could mean that they are actively transmitting or receiving or it could simply be that there is an open connection that hasn't been torn down because there is an expectation of further messages being sent back and forth.

Figure 3.5: Connection list from netstat.
This is just one of the types of information that netstat can provide. To display the routing table, you can use the netstat –r command. That will provide the list of all of the network routes that your particular system knows about. In most cases on desktop systems, you will have a number of routes to devices on your local network but there will really only be a single route to other networks. The destination in that case will be 0.0.0.0, meaning that any network that isn't local goes to the gateway (router) that is specified by IP address. netstat –r and netstat –a (shown in Figure 3.5) display human-readable addresses where possible. This means that netstat will do lookups prior to providing any output. The addresses shown in the Foreign Address column in the list of active communications are primarily text. Because the column isn't wide enough to support the length of the hostname, much of it has been truncated but what is shown is a fully qualified domain name (FQDN) or at least as much of one as can fit into the column.
Having netstat perform lookups can be time consuming. To save time—which would be long if you had unplugged the system from the network since you'd be waiting for a lot of network timeouts—you can add –n to the command line. This tells netstat to use numeric output and not to do any of the lookups. Addresses are not the only part of the output that get looked up. Port numbers, which are addresses for layer 4, also get translated into names that may mean more to someone than just the number. You may not know off the top of your head, for instance, that https is port 443 or that imaps is port 993. Both of those are referenced in the output in Figure 3.5.
Another feature of netstat is its ability to just output network statistics related to the amount of traffic that has come across or out of the system. You will get different statistics based on the operating system you are on. Although you can run netstat on Windows, Linux, and macOS, the different implementations will get you different sets of data. As an example, Figure 3.6 shows a small amount of the data that is available using netstat –s on a macOS system. Detailed statistics are available for different protocols like TCP, UDP, IP, ICMP, IPv6, and others.
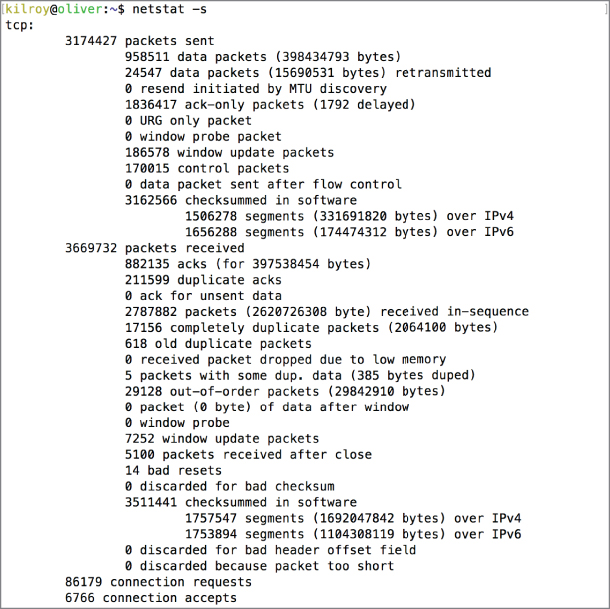
Figure 3.6: Protocol-based network statistics from netstat.
On a Kali Linux system, the output is very different and not as detailed using the same netstat –s command. You can see in Listing 3-2 that the limited amount of network traffic notwithstanding, the output looks very different on this system. The netstat implementation on Linux systems is different from that on other systems. As an example, you can use –listening on a Linux system and get a list of just the programs that are listening.
Using netstat, you can get the list of ports that are in listening mode, as we've seen. Just knowing that a port is open and there is an application listening on it doesn't provide you a lot of information because any program could be listening on that port. The best approach is to get the process that is listening. Even if you see a common port like 80 listening, it could be that the port had been hijacked by a rogue process so it's best to verify. Some implementations will provide you the process identification number and the program name, as you can see in Listing 3-3, which shows the output from a Kali Linux system.
All of the information that netstat provides is stored in the kernel memory space in specific data structures that the operating system has to keep track of. This information can be retrieved using other tools that can also query the operating system to get the information, but it's not actually written down anywhere on disk. Even on Linux systems, the /proc directory will contain some of this information, but the “files” you will find in that directory are not files that are stored on disk. They are ways to access kernel memory and data structures that are stored there. This means that if you want to get this information, you have to do it while the system is running, and netstat is a good way of retrieving it using a single utility.
Though we have so far only looked at macOS and Linux, Windows also has an implementation of netstat that provides much the same sort of information as the implementations on macOS and Linux. However, netstat focuses on just TCP/IP protocols. Windows also uses other protocols, especially to communicate with other Windows systems.
nbstat
In 1983, as networking on personal computers was getting underway, the company Sytek developed an interface for networking called Network Basic Input Output System (NetBIOS) as a complement to the system BIOS that provided a way for programs to get access to the hardware. NetBIOS was developed as an application programming interface (API) so that programs would have a way to get access to the network. Since that time, NetBIOS has been adapted multiple times to allow it to continue to work on different technologies and different operating systems. Currently, the implementation is referred to as NetBT (or NBT), which is short for NetBIOS over TCP/IP. NetBT makes the same API calls available over a different set of network and transport protocols than NetBIOS was originally designed for.
Windows systems have been using NetBT for the past couple of decades as a way to allow Windows systems to communicate with one another for the purpose of file and print sharing, among other reasons. NetBT provides a name service, a session service, and a datagram service. The name service allows systems to find one another on the network. This is separate from the domain name system (DNS), because NetBT was intended to provide local naming rather than naming across the Internet. In that sense, it is similar to the media access control (MAC) address, which would never be communicated beyond a routing device. The fact that NetBT is NetBIOS over TCP/IP means that the naming of systems is expected to be unique over a larger area than originally intended by NetBIOS. It also means that we are effectively carrying NetBIOS inside of TCP/IP, a practice which is commonly called tunneling. The session service is in place to allow systems to establish communication between them.
The nbtstat utility is used to get statistics related to NetBT. Using nbtstat, you can get name information on your Windows network. Part of the output, as shown in Figure 3.7, is the type of name. This is stored in the last byte of the name because the last byte helps to address the case where the same name may be used for multiple purposes on the Windows network. The last byte, displayed between brackets ( < > ), is shown in hexadecimal.

Figure 3.7: nbtstat output.
The last byte may mean that the name represents a workstation, domain controller, master browser, or a file server. You may run across other values if you work on networks that are heavily dependent on Windows components like Windows Active Directory and Windows Exchange Server. In a listing of nbtstat on a large network, you will typically see multiple entries for each name value. The reason for this is that each Windows client may also be a file server or a Messenger client.
The nbtstat utility is capable of displaying all of the names that your local workstation is registered with. Additionally, you can see the cache of the registered names and their associated IP addresses that the system you are on knows about. If there is nothing in the cache, it doesn't mean there aren't other systems on the network; it just means this particular system hasn't seen any communication from them.
The cache will show the IP address and its associated NetBIOS name. This is not the same as any hostname this system may have that's loaded into DNS. Your system can have a NetBIOS name and a DNS hostname and they can be two separate things. The NetBIOS name is the name you provide to Windows so it's the name the system knows about. DNS is configured on a separate system so the Windows system knows nothing directly about that hostname. Matching these two up requires communication between the people responsible for them. That doesn't always happen, but in most cases it doesn't matter, although it's sometimes worth being aware that you could have two systems on the same network sharing the same name. You could also have a system that has one name in one context, outside of the local network, and another name in the context of the local network. When you are looking for machines based on a name you may have been provided, you should know that you could be looking in two different places for that name.
ifconfig/ipconfig
One of the most fundamental networking utilities is ifconfig, short for interface configuration. The purpose of ifconfig is to show the IP address configuration for the network interfaces on your system. On Windows systems, this utility is called ipconfig (IP configuration), and it also provides other information that you won't get using ifconfig on Linux or macOS, including the DNS servers that have been configured on the system. Figure 3.8 shows the output from ifconfig on a Linux system. Other Unix-like operating systems, including macOS, will look very similar to this.

Figure 3.8: ifconfig output.
In addition to the IP address and associated subnet mask, you can see that the media access control (MAC) address is also displayed. ifconfig tells us that our link connection is Ethernet and refers to the MAC address as HWaddr, but the MAC address and the hardware address are the same. Additionally, ifconfig displays the IPv6 addresses that are associated with the interface, if there are any. A number of parameters that have been set on the interface are also displayed. One of these is the maximum transmission unit (MTU), indicating how large a message can be sent on the wire. In this case, it's 1500 bytes, which is the standard Ethernet MTU. You can also see the statistics associated with the interface, including the number of bytes transmitted and the number received.
By comparison, you can see the output of ipconfig on a Windows system in Figure 3.9. On a Windows system, ipconfig is used for more than simply displaying IP information that is associated with network interfaces. You could use ipconfig to release a network address that had been dynamically configured and you can also renew that address. If you are having problems with your network interface, ipconfig may be a way to make sure that you have a good DHCP-assigned address. While it may be a little more time consuming than other ways of doing the same thing, if you are already at the command line running diagnostics it may be quicker. As noted earlier, you can see in this output that additional IP configuration like the DNS servers are provided as well. You can also dump the local DNS cache by using /displaydns.

Figure 3.9: ipconfig output.
Although the same information that is available from these utilities is available in other places, you may have instances where you have to go to the command line to get this information. Sometimes graphical interfaces become unstable or unreliable and you need to drop to a command line and just type a command or two to get the information you need.
Sysinternals
In the mid-1990s, a pair of developers named Bryce Cogswell and Mark Russinovich started up a website named ntinternals that later became Winternals. A number of programs were available on this website and the collection of tools began to grow. These were programs that exposed some of the internals of the Windows operating system in ways that would be useful for developers, system administrators, and now forensic investigators. About a decade after the website began, Microsoft acquired the site, the tools, and Russinovich and Cogswell. The collection of tools is now called Windows Sysinternals and, other than a password recovery tool that was previously available, all of the tools are available through Microsoft's website.
A large number of highly useful utilities are available. You can download them individually or just download a zip file with the entire suite of utilities. At the time of this writing, 121 programs are available, though some of those are just 64-bit implementations of 32-bit programs that are also in the suite. Though not all of the programs are unique, there is still a significant number and over the years, a fair number of people have found them to be very useful. As a result, we're going to spend some time looking at the programs that relate to host-side network artifacts. As the list continues to grow, we aren't going to cover everything that is of value but instead highlight the ones specifically relevant to network forensics from the standpoint of identifying network connections and their relation to running processes.
The first program we are going to talk about, shown in Figure 3.10, is TCPView. This graphical user application provides information similar to netstat. One advantage to this view over what is available from netstat is that you can easily sort this view. Additionally, it is updated in real time, which netstat can also do if you provide it an interval of time that you want to elapse before the information is updated. If a program terminates while you have TCPView open, the entry for the program in the list will get a red background. Once it has completely terminated, the entry will be removed from the list. The second column shown in Figure 3.10 is the process identification number (PID). As with the other columns, you can sort by the PID column. You can also get the process properties by right-clicking a process and selecting it. Just knowing the name of the process may be inadequate. For example, the first entry in this list is dasHost.exe, which may not be immediately familiar to you and appear suspicious as a result. Viewing the properties shows that this is the Device Association Framework Provider Host from Microsoft. The Device Association Framework Provider Host maintains pairing relationships with devices like Bluetooth headphones.

Figure 3.10: TCPView.
In addition to TCPView, Sysinternals provides a console view program. Using the TCPView Console program (TCPVCon), you can get a listing of the programs that are communicating on the network using a text-based or console-based view. Where you can get screen captures of the information in the graphical interface, as in Figure 3.10, you would be able to get a text file from TCPView Console that you could then put into a spreadsheet or word processing document in order to present in different ways.
Sysinternals also comes with PsFile, which can list files that someone else on the network may have open on your system. As an example, see Figure 3.11. In this case, one text file was opened but in order to get to that file, directories also had to be opened. You can see the list using PsFile. All of these entries needed to be opened to get to that one text file from a remote system. PsFile did not need to have any parameters. If you just run PsFile, you will get the list of all the files that are open on this system that are being accessed from a remote system.

Figure 3.11: Looking at remotely opened files with PsFile.
The Sysinternals suite comes with the Process Explorer, a utility that provides complete access to the details of each process including allocated memory, the process identification number, the process owner, where it was run from, and any active network communications. In Figure 3.12, the background list displays the properties of one of the processes. This particular process has a number of UDP listeners. Based on what shows in this list, no one is communicating with this process. It is just waiting for a message to come in. While you have to look at each process individually to get this information, the other utilities in this suite should be able to provide the process identification number so that you can get more process details from Process Explorer. This includes all of the external libraries that the program is using, shown in the lower pane. It can also show handles the program has open, which would indicate either files or network streams that the program is responsible for.

Figure 3.12: Network listeners with Process Explorer.
With nearly 100 unique utilities, the Sysinternals suite has far more functionality than has been covered here and it's worth having the full suite in your bag of tools. The programs we have talked about here are related to getting information about network activity. Other network utilities such as PsPing are more for diagnostics and troubleshooting and less to gather information about what is happening from a network communication perspective. These are all, of course, limited to being used on Windows systems because they were written using the very detailed and rich Windows application programming interfaces. The following sections discuss programs that can be used on the Linux side.
ntop
The top utility is used to show which processes are taking the most resources on a system. The resources measured by top are CPU and memory. This doesn't help when we are looking for network information. Fortunately, there is an analog to top on the network side and it's called ntop. The ntop utility provides a list of the top talkers on the network along with additional statistics. For example, Figure 3.13 shows the IP statistics gathered by running ntop for a short period of time. To get this information, ntop runs in the background as a service, collecting network data. To look at what ntop shows you, use a web browser to connect to http://localhost:3000. The ntop application listens there for a browser to connect and launches a web application as the interface to the user.
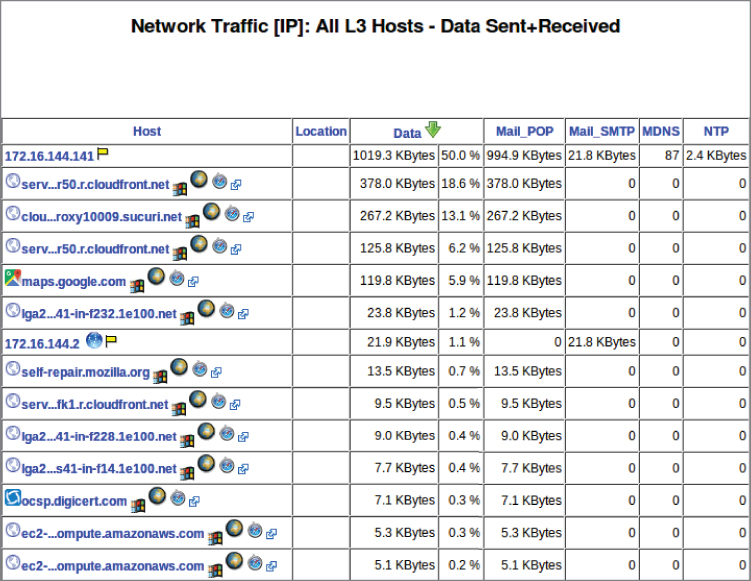
Figure 3.13: IP statistics using ntop.
Figure 3.13 shows the list of hosts that have been seen. If ntop can't locate a hostname by performing a lookup, it displays just the IP address as in the case of the first entry. That is the system that ntop is running on but because it's a private IP address with no local DNS server or other way to provide a hostname, it has no DNS entry. ntop can also provide you a summary of the top talkers that were seen on the network interface on this system. In most cases, that will be the traffic that was sent from and destined to this system. In some cases, you can set up a system to run ntop and funnel more traffic to it to gather this information. In Figure 3.14, you can see some of the top talkers from the last hour prior to this capture. What you get here is the minute-by-minute listing of all of the systems that were communicating. If traffic was seen during that minute, it will show up in the block corresponding to that minute.

Figure 3.14: Top talkers using ntop.
The challenge with ntop is that it needs to be installed on a system and it needs to be listening. This can be highly intrusive. A service also needs to be running in order to gather information. If the service isn't running and collecting data, you won't see anything. The web interface won't exist, for a start, because there will be no application listening on the port for the interface. Beyond that, though, if you start ntop without the service just to get to the web interface, no data will have been collected to look at. So using ntop takes some planning. Even if ntop was installed but not noticed by an attacker, the activities of the service—running, collecting data, and listening on a network interface—are also easy to notice.
One advantage of ntop is that, unlike some utilities, you can install and run it on multiple operating systems. There are some utilities that are only available on specific operating systems. That's especially true with utilities that come with the operating environment. Windows, as an example, has a lot of programs and utilities built in that can be used for monitoring and diagnostics.
Task Manager/Resource Monitor
Windows Task Manager provides a view into network activity, though you may be more familiar with it as a way to look at process lists. Over the last several releases of Windows, the Task Manager has become a very powerful monitoring utility. When you start it up, you will get a list of applications that you are running. In Windows 10, if you click the “More details” link, you will get a set of tabs across the top allowing you to view more details about different resources on the system including Processes and Performance. The Performance tab displays dynamic graphs that show how the CPU, Memory, Network, and Disk are performing. You can see the network activity in Figure 3.15. Though this doesn't have a lot of detail, it does show a running graph of how much network traffic is coming into and going out of your system.

Figure 3.15: Task Manager Ethernet display.
This view does not show what is happening with applications or even the ports that are open and being used. To get access to that information, you can open the Resource Monitor from the Task Manager. As its name suggests, the Resource Monitor allows you to get more specific information about various resources. Again, just like in the Task Manager, you can look at Memory, Network, Disk, and CPU. The Network tab provides a quick view of a lot of the information we have been talking about. You can see a portion of this Network tab in Figure 3.16. This provides a place to look at all of the network communications with details and statistics. If you look at the TCP Connections section, you can see all of the processes, the process ID, the local address, the remote address, the packet count, and the latency value.
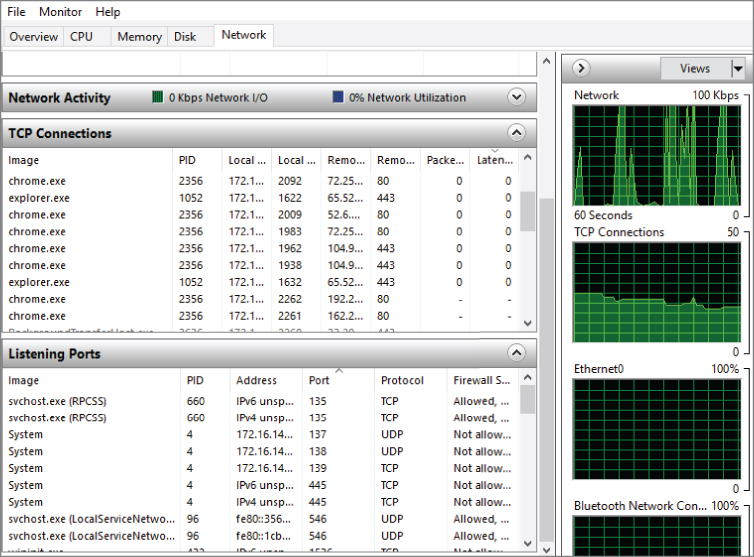
Figure 3.16: Resource Monitor.
One advantage of looking at the Resource Monitor is that you can see the listening ports quickly in a way that can be sorted. On top of seeing the applications that are listening and the information about the ports they are listening on, you can also see the firewall state. Windows has a built-in firewall and, though we haven't talked about it to this point, just because an application is listening doesn't mean that anyone can get to the application. The Windows firewall can block traffic to that application, even based on the application, meaning all you need to do is tell the Windows Firewall that the application in question should not be using the network and it won't matter what ports are in use. Using the Resource Monitor, you can collect the listener ports and see whether anyone can reach the application as long as the Windows firewall is running. In other words, you can gather two pieces of information at the same time—whether the application has ports that are listening for traffic and whether the Windows Firewall is going to allow any remote system to communicate over those ports. The Windows Firewall will not prevent the application from listening on those ports, but it can prevent inbound communications from getting to the application.
ARP
The address resolution protocol (ARP) allows systems to perform lookups from IP addresses to MAC addresses. The MAC address is required for two systems to communicate on a local network. It is also required for a system to get something off the local network because the MAC address of the router is necessary as the destination address in the Ethernet header. Each system maintains a cache of the address resolutions to save time when it wants to send a message out on the local network.
Operating systems that have a TCP/IP protocol stack will typically have the arp utility installed, though arp is only useful if you are communicating using IPv4. The arp utility allows you to manage the ARP cache on the local system. Figure 3.17 shows the entire ARP cache on my system. By default, arp will attempt to perform reverse DNS lookups on the IP address, though since none of these addresses can be resolved, you will see a ? in place of the hostname.
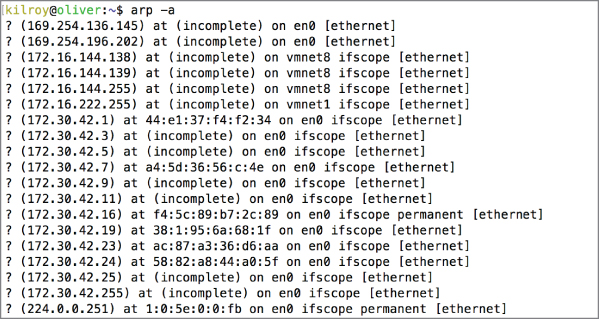
Figure 3.17: ARP cache.
Using the arp utility, you can display specific entries based on hostname instead of displaying all of the cache. You can also delete specific entries. If you run into a case where your local ARP cache is wrong, you can delete the entry and force the system to ask again. In most cases, you will get the MAC address, though if the system can't do a resolution, you will see (incomplete). This is for addresses that the system knows about but the host at that address can't be reached. As an example, if you were to try to ping a system on your local network that isn't responding, that IP address will show up in the ARP cache because it was an IP address you tried to get to. Because it wasn't responsive, perhaps because it was down, there is no MAC address to provide. The entry is there but it's incomplete so the arp utility indicates that much.
/proc Filesystem
Linux systems have a pseudo-filesystem that is an interface to the kernel memory. The data structures associated with processes are available through the /proc filesystem. Every proc entry includes a large collection about the process and all of the resources that are available to it. In each case, you get access to the resources by going to the directory named for the process ID number. Underneath that, you will find a number of other directories. One of those directories is the net directory, the contents of which you can see in Figure 3.18. It contains all of the networking resources and statistics available to the process.

Figure 3.18: /proc entry for Nginx web server.
Only processes that use network resources will have much useful information in this directory. Each file will have data relevant to the name of the file. As an example, the contents of the tcp file are the details about the sockets in use with TCP. You can see the contents of the tcp file for the Nginx process in Listing 3-4. In the first line, you can see the socket listening on port 80. This may not be apparent immediately because the value representing that is 50. The 50 you see is in hexadecimal and converting that to decimal is as simple as multiplying 5 by 16, because the 5 is in the 16's place. When you multiply those two values, you get 80.
Summary
When you are looking at network information, you can get a lot of data from asking the host directly because every operating system keeps track of the network communications passing across its interfaces. In most cases, you can get access to that information by using system utilities but you may not want to use them because they may have been compromised. In that case, you can use third-party utilities, especially those that can be run without being installed. One source of those utilities on the Windows side is Microsoft, which provides the Sysinternals suite for free. The Sysinternals suite includes a lot of useful diagnostic utilities and programs. Some of the Sysinternals programs can be used to extract a lot of details related to the connections between the local system and remote systems.
Operating systems also include a number of utilities that are necessary for looking at network connections. The netstat utility, as an example, provides network statistics about listening ports and connections between two systems. The arp utility can be used to highlight systems on the local network that the system under investigation has received some communication from. ARP is the protocol used to identify and communicate with systems on the local network, so the arp utility provides information about the communication of that protocol, specifically the addresses that your system knows about.
The Windows Sysinternals team and your friendly, local operating system are not the only places to be finding tools that can be used to extract information about what the operating system knows about network connections and communications. In fact, as noted previously, your operating system utilities may have been corrupted by a rootkit that is altering what you see. If you can find tools that you can load up to a portable drive, like those provided by Sysinternals or even a vendor like Nirsoft, you have a way to corroborate what you are getting from your operating system.