
10
Correlating Attacks
As he looks at the systems he has gathered from this one company, it appears that they are scattered around the United States with one or two in Ireland. He recognizes how important the events that he is performing are in creating a trail demonstrating his jumping from one system to another. Unfortunately, when logs are sent off the system they originated on, it's hard to for him to protect himself. He can't just wipe the logs because they are sent to a waiting system in another part of the network the moment they are created. Wiping the local log has no benefit there.
He checks time zones and clock settings on each of the systems he has entered. He realizes that not only do they span different time zones, but in many cases, their times don't match up. Sometimes even within the same building. Clocks are sometimes off by several minutes or more. Sometimes, clock settings are entirely wrong. This is good news for him, since anything these systems are generating can be misleading. This is in addition to the obfuscation he is creating. The more he can do to create a quicksand to mire down those who may eventually be tracking him, the better off he will be. More days under his control means more money in his pocket. This is a good thing.
When you are working within an enterprise, you will be working on multiple systems. You will have multiple artifacts, including logs, that need to be presented in a coherent way. This can be especially true when it comes to an enterprise that is diverse geographically. Fortunately, there are ways to synchronize systems across multiple time zones and there are ways to do this so no matter where your systems are around the globe, they can be synchronized to standard, reliable time sources. This will be important when it comes to pulling a timeline together.
The timeline is the end goal of everything we are doing here. A timeline represents the entire history of an incident in a concise manner that is easy to follow chronologically. Putting events into a timeline helps to determine correlation, as well as what may be related and what may not be related to the entire incident. It also helps to isolate outliers within the entire timeline of events; the outliers may prove to be useful or they could be ruled out. Looking at a long list of timestamps can make it hard to chase down what happened. This is why pulling events out of all of the sources of information you have and placing them in a timeline can be useful. You can see, visually, how it all unfolded and what it looked like.
A number of tools are available to assist with the construction of timelines. Because a timeline is essentially a visual tool, the programs that are used to create timelines are typically graphical programs because it can be much easier to just drag events around on the timeline if you need to rearrange or just make room for new events. There is a significant program that is not graphical that is used to help generate timelines, though. The program log2timeline and other, associated programs, is important because it can be used to help extract important time information from logs and other data sources. This can help to extract what is necessary from sources that may be difficult to get time information from in a consumable manner.
Packet captures don't include their own per-frame times. Everything is based on offsets from the beginning of the packet capture. As a result, packet captures can also be used as a source of timeline information, and this is important because of the value of using packet captures in a network investigation. Packet captures often need to be correlated with logs, and logs can come from a large number of systems. It can be problematic to extract logs from every system that is related. Fortunately, there are ways to deal with that by making sure that the logs are pulled together at the moment they are created.
Ultimately, the most important thing, though, is to have a solid foundation to build your evidence on. That solid foundation relies on synchronizing time across your systems, no matter what time zone they are in.
Time Synchronization
Time synchronization means that every system in the network, or at least every system you care about, is using the same source for its timing information. Local clocks on systems can have a tendency to drift some, which means they should be regularly checking with a more reliable time source to ensure all systems are accurate. Even a couple of minutes of drift in the clock can make a big difference in correlating events. If you have a network intercept that says one thing but a log that says something else, and it's not clear there is a clock problem, you can end up with events completely out of sequence. That may end up having an impact on your attempt to determine a root cause or attaching actions to a particular actor.
Time Zones
Time zones are geographic distinctions made around the globe because of the way the earth rotates during the day. Since the way we measure time is based around celestial objects like the sun, we rely on our own orientation to that celestial body. As an example, when the sun is at its apex in the sky, we consider that noon. The problem is that when it is at its apex for me, it is a good way on the wane on the east coast of the United States. In Europe, the sun may have gone down altogether. In order to correct for this, we use time zones. Everyone in the same sliver of the globe, from top to bottom, is in the same time zone. While it's not perfect, noon for me in Colorado is going to have the sun at roughly the same position in the sky for someone in Salt Lake City, also in the Mountain Time zone.
The point of origin for all of the time zones is sometimes called Greenwich Mean Time (GMT). The same time measurement is also called Coordinated Universal Time (UTC). Every other time zone around the world is an offset from that measurement. As an example, I am seven hours behind GMT and UTC. Eastern Europe is ahead. Riga in Latvia, for instance, is three hours ahead, while Bern in Switzerland is two hours ahead.
Another thing to consider is daylight saving time (DST). Many time zones around the world observe daylight saving, which can vary a local time by an hour from the base time. Neither GMT nor UTC observe or make adjustments for daylight saving. In the United Kingdom, the time zone designation becomes British Summer Time (BST). In the United States, it is a letter change. Where MST is Mountain Standard Time, the time measurement based on the sun being more or less at its apex at noon, in the summer when the time changes, it becomes Mountain Daylight Time (MDT). Since computers are capable of making the adjustment automatically when the time changes, the time zone may be referred to as MST7MDT, indicating that in standard time, the clock is –7 from UTC. Part of the year, though, is different from that. At the moment, as I write this, I am only six hours different from UTC.
When systems need to all be on a particular time standard in order to make sure that what happens can be resolved easily later on, as in a timeline, they may simply set their local clocks to UTC. The local time can always be calculated easily, but if the system clock is set to UTC, every system, no matter where it is, has the same time and no resolution needs to happen to ensure every event captured has the same base time.
Network Time Protocol
The network time protocol (NTP) was created to share time across the network. When systems use NTP, they are typically clients to a time server. Periodically, the NTP client will check with the NTP server to synchronize the time. The idea is that the NTP server has a more reliable clock than the client. Regular synchronizations will correct for any drifting of the local clock. The clock on the client will get reset based on what it receives from the NTP server.
Because speed in these cases is important, NTP transmits and receives over UDP. The idea is that you want to receive the messages from the NTP server with the shortest delay absolutely possible. Additionally, in the case of a time synchronization message, it is less important that it get there guaranteed. Instead, if it doesn't get to the server or client, the application will retransmit as necessary. This means that there is no verifying that you are talking to the correct server. Speed is the most important factor.
NTP uses a hierarchy to determine the reliability of the time. A stratum 0 clock would be either an atomic clock or a global positioning system (GPS) clock where the time is accurate to milliseconds. Beneath the stratum 0 clocks would be stratum 1 clocks. A stratum 1 clock is a reference clock. These synchronize to the stratum 0 clocks and their time would be accurate to microseconds rather than milliseconds. The US Naval Observatory, for instance, operates several stratum 1 servers that synchronize with their own atomic clock, though they may also synchronize with GPS. Following down the chain, a stratum 2 server would synchronize its clock with a stratum 1 server, while a stratum 3 server would synchronize its clock with a stratum 2 server.
Each system within a network would be configured to synchronize with a local time source. This would ensure that all systems within a network had the same time source, maintaining local time to within fractions of seconds. Operating systems like Windows and Mac OS X are configured by default to synchronize with a time server maintained by Microsoft and Apple, respectively. In the case of Linux, systems would commonly use one of the pool servers maintained by ntp.org. The hostname pool.ntp.org would resolve to a system at the time it was checked since pool.ntp.org doesn't resolve to a single IP address. Instead, the resolution would rotate through multiple servers in the pool. Each time a request was made, the client making the request would get a different address than the one provided to the last client.
Desktops and servers are not the only systems that need to have their times synchronized. All network devices and other appliances would need to have their times synchronized as well. Routers, switches, and firewalls, along with other devices, are going to generate information that will be important in a network investigation. As a result, all devices you expect to be working with should be synchronized to the same source since that will make life much easier when it comes to trying to pull everything together.
Packet Capture Times
There is nothing in Ethernet frames or IP packets that provides any sort of timestamp that could be used to reliably mark packets or frames. You can look through the headers if you like, but there is nothing there. So, if we are acquiring a packet capture, how do we know anything about the time that any frame came in? The capturing program knows when it began running, and it knows, based on that, when captured frames arrived. A program like tcpdump would know exactly what time a frame arrived. In the output of tcpdump, as shown in Listing 10-1, you can see the time each frame arrived down to milliseconds.
This output shows the actual time each frame came in because tcpdump knew what time it was. Wireshark, by contrast, represents time as an offset from the time the packet capture was started. This is, though, configurable. By default, you would see the first frame show 0.000000. The next frame would show the number of seconds since the first frame, down to milliseconds. Every successive frame would also show as being an offset from the start of the file in seconds. This is a view setting in Wireshark, though. You can change the view setting to show you the number of seconds since the start of Epoch time (1970-01-01 00:00:00). You can see Wireshark showing the number of seconds offset from Epoch time in Figure 10.1.

Figure 10.1: Wireshark showing Epoch time in seconds.
In reality, the file format, pcap or pcapng, stores timestamps for all frames in Epoch time. In addition to the timestamp on the file, stored in the global header, each frame will have its own header to store metadata. The frame header stores the timestamp on the frame in Epoch time, which is the number of seconds since January 1, 1970. Additionally, all times stored in a pcap file are UTC. There is no time zone information stored in the frame metadata, though the global header for the file will include the offset from UTC that was configured on the system at the time the packets were captured. You can see in Figure 10.2 that the time zone from the pcap header is set to 0. The line that says “int32 thiszone” has a value of 0, which is UTC. You'll also see under Frame[0] that the time in seconds (Epoch time) shows the date and time that the frame came in on. The line below that shows the time in microseconds. In order to get the exact time, you put the two lines together, which is shown in the line that says Frame[0].

Figure 10.2: Hex editor showing times from PCAP.
Figure 10.2 is from a hex editor using a pcap template to be able to extract the specific data segments from the file. Without this, it would be difficult to parse through the raw pcap file. You can, of course, just let Wireshark show you the time the way you want it by changing your view preferences under View &cmdarr;Time Display Format.
Log Aggregation and Management
It is hard to overstate the importance of logging. From a forensic investigation standpoint, of course, the paper trail that logs provide is very helpful. Additionally, though, system administrators, network engineers, security engineers, and various other people who have to touch systems can get a lot of benefit from logging. As a result, turning on system logging is a good thing. The problem is where to put the logs once you have them. As mentioned previously, the problem with storing logs on the endpoints (servers, desktops, and so on) is that if they are compromised, the attacker can get access to those logs to wipe or alter.
The best approach is to offload logs to a central log host. This is not perfect. Just because you create a central log host doesn't guarantee that attackers won't be able to get to it. After all, if it is reachable enough from the endpoint to be able to get logs to, then the attacker can also reach it, even if it's only through the port listening for the log messages. A number of readily available solutions will allow you to create a centralized log host from open source to commercial offerings. Your needs should help you to determine which one may be the right way to go for you.
Although logging and different logging mechanisms were covered in Chapter 9, we will talk about the same kinds of logging from the perspective of collecting and correlating in the next sections.
Windows Event Forwarding
Windows uses the Event Log to store log information. If you want to manage the logs, view them, or search for information in them, you would use the Event Viewer. The Event Viewer also allows you to set up log forwarding by creating subscriptions. If you look in the left-hand pane of the Event Viewer, as shown in Figure 10.3, you can see both Forwarded Events and Subscriptions. In the Forwarded Events log, you will see, probably not surprisingly, events that have been received (forwarded) from another system. This will allow you to separate the system logs from the system where the log collector is running from all of the other logs that may be sent to it from other systems.
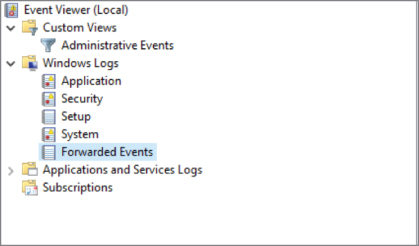
Figure 10.3: Windows Event Viewer.
In order to set up forwarding, you need to set up a system as a collector. The collector can be configured to either reach out to other systems or it can wait for other systems to contact it to send logs along. One way of getting logs is to use the collector to create a subscription. The subscription allows the collector system to subscribe to logs from another system. When you want to start a subscription, you go to the Subscriptions folder that you can see in Figure 10.3. From there, you click Create Subscription in the right-hand side of the window. This will bring up the dialog box that you see in Figure 10.4.
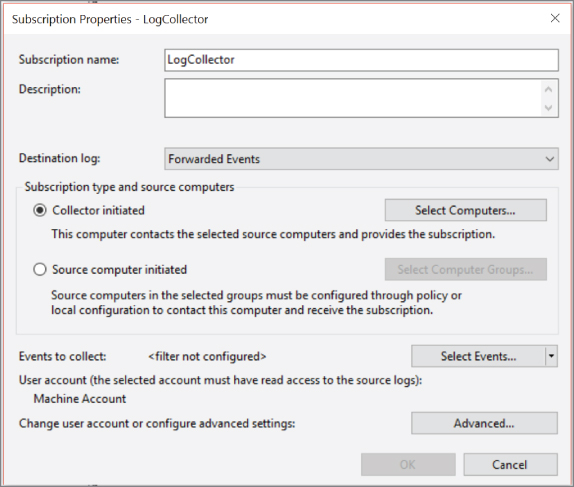
Figure 10.4: Creating a subscription in Windows Event Viewer.
The dialog allows you to specify where you want the received logs to go. By default, they would go into the Forwarded Events log, though you can change the log you would like them to go into. You can select Collector Initiated or Source Initiated. If you wanted to have the collector poll for logs, you would select Collector Initiated. If you would rather the source computer send them along, you would select Source Initiated. Once you have determined how you want the subscription to work, you can create a filter to determine exactly what logs you want forwarded. If you enable a lot of logging and auditing, Windows can generate a lot of log entries, and perhaps you don't want all of them going to the collector. If this were the case, you would create a filter to specify exactly what you wanted forwarded on. It's important to note that the filter will let you indicate what you want forwarded, which means there are messages you are leaving on the endpoint and not forwarding them off somewhere.
Syslog
Another free offering that just comes with the operating system is syslog. This is available, typically, for Linux and Unix-like systems. Configuring a syslog server to listen for syslog messages is easy. Any implementation of syslog should have the ability to listen for syslog messages from other systems. As an example, the following configuration fragment shows how to configure a syslog-ng server to listen for syslog messages over TCP. By default, syslog uses UDP, but TCP guarantees that the messages get to the server or will return an error indicating why so it's preferable to use TCP rather than UDP. This is especially true on critical systems. You'll also notice that in the configuration shown in Listing 10-2, I have specified which IP address to pay attention to, which effectively determines the interface I'm listening for messages on. While interfaces can have multiple IP addresses, any IP address can only be configured on a single interface on a system, so by indicating the IP address, we know which interface the message will be arriving on.
On the client side, you would essentially reverse the two lines at the top. Your destination becomes a network destination, configured just as you did in the source. You might label your destination d_network to make it clear it's a network destination. Your source would then be your local logging. You can see what that may look like in Listing 10-3.
Once you have these two configurations in place, you will be forwarding your syslog messages from one system to a central log host, also running syslog. You are not restricted to just Unix-like hosts when you are taking in syslog messages, though. A number of software packages are available that will install a syslog agent onto a Windows system. This will allow you to take log messages from a Windows system and send them off to a syslog server. As an example, rsyslog is a common implementation of syslog and rsyslog provides an agent that will monitor the Windows Event Log to forward events off to a syslog server.
Log Management Offerings
Windows Event Viewer and syslog are both essentially free offerings that you can take advantage of with your existing operating systems. You may, though, want something that gives you some additional power. There are a number of products around, both commercial and community-supported. With a log management solution, you are expanding on the capability of just taking logs in, though certainly Windows Event Viewer Subscriptions and even some implementations of syslog provide you with some of the advanced features of the log management solutions we're going to be talking about here.
One solution you can make use of is nxlog. Currently, IBM offers nxlog as a commercial offering, though there is a community edition as well. One advantage to nxlog is that it can be configured to accept logs in a variety of formats, generating a single, coherent log file that you can use. An example of an nxlog configuration is shown in Listing 10-4. What you can see in the listing is that nxlog has been configured to be a listener for syslog messages.
This example has nxlog listening on both UDP and TCP, as indicated by the Input sections. The two Output sections write messages coming in to files. One advantage to nxlog is its ability to execute functions that can allow you to manipulate and massage data. You'll see in the first Output section that it not only sets the severity value based on whether it sees error in the message, but it also outputs to a syslog format rather than the nxlog format. A number of variables are defined by nxlog that allow you to make determinations based on what you see coming in. Finally, we have to join the input and the output. That is done in the Route sections. In each route, you have a path that indicates inputs and outputs. You can have multiple inputs going to a single output. If you need multiple outputs, you need multiple route sections. The two routes here say that UDP messages should be written out in syslog format, using Output1 since the assumption is that they are coming in using syslog format. Output2, on the other hand, just dumps the messages coming in to /var/log/nxlog/logmsg2.txt.
There are a number of other offerings when it comes to log management. Searching has become a very popular and important option when it comes to log management. One option, formerly called ELK, includes the search feature as the first part of its name. ELK is an acronym for Elasticsearch, Logstash, and Kibana. The three components together offer log management, search capabilities, and a web interface for management and queries. The trio of software is currently named Elastic Stack.
Another product that is popular is Splunk. Splunk has a commercial offering but there is also a lite version that you can use for small installations that you can download and install for free. If you have larger data needs, there are other offerings of Splunk. Like Elastic Stack, Splunk offers a web interface for management. Figure 10.5 shows the web interface where you can add a TCP or UDP listener to take in syslog messages or messages from other sources. Similar to nxlog, Splunk has the capability to parse different sources of data and will auto-detect some data sources. Splunk will also take in local sources. If you point Splunk at a directory where your logs are, /var/log for instance, Splunk will add the data source and start consuming and indexing the logs.

Figure 10.5: Creating listener in Splunk.
Once you have the logs in, you can use the Splunk interface to start reading all of the logs. Splunk also offers a number of ways to query the logs and drill into the data. On the left-hand side of Figure 10.6, there is a list of fields that you can search by. Clicking any of those will display data related to the link you clicked. Additionally, even within the log message, there are clickable links to look at the data in a different way. For instance, each entry has a host field that is clickable. If I were to click that field, Splunk would show me logs from that host. The same is true with the source and sourcetype fields. I can present information only from /var/log/auth.log in my output by clicking that source. Likewise with syslog—if I had multiple sources, I might want to just show my syslog messages.
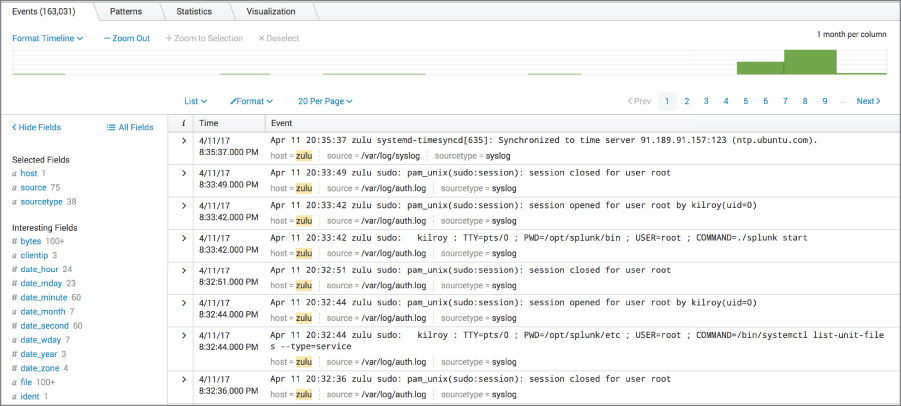
Figure 10.6: Displaying logs in Splunk.
Using a log management solution has a nusmber of benefits. You have one-stop shopping when it comes to looking at your information and if the log management solution is good, you will have a number of ways to look at your logs, using queries and filters. If your log management server is well-protected, you can also keep all of your logs intact and away from attackers. It also helps to maintain your logs in a useful order because sources are providing the data as it happens to the log management solution.
Timelines
If you aren't using timelines in your work today, you probably remember them from school. One text book or another would have presented a timeline, whether it was a geological timeline showing the different periods the earth has been through or whether it was a historical timeline showing important events in the history of the country or the world. The idea of a timeline is to put events into a coherent, chronological order. When events are out of order, it's hard to follow what happened. As an example, Figure 10.7 shows a timeline but the order of events doesn't make any sense at all.

Figure 10.7: Illogical timeline.
According to the timeline in this figure, I drove to work, showered, and then got out of bed. I could drive to work then shower but I wouldn't be able to do either of the first two without doing the third. Without some additional contextual information, this timeline is illogical. When you get logs from disparate sources, you can end up with what appears to be an illogical sequence of events unless you can get everything into order by the actual date and time that they happened. The finer the grain you can get on the time the more precisely you can order the timeline. Computers are very fast and multiple events can happen within the same second. Having that fine granularity will give you the ability to put everything you believe has happened into a precisely accurate order.
A number of software products are available to help with timelines. There are also products you can use to generate your own timeline from what you have observed without necessarily having to extract events from your artifacts. As an example, the timeline shown in Figure 10.7 was created using Aeon Timeline. Using a simple tool like that, you can create a visual timeline and attach notes to each event. However, there are tools that you can use to automatically extract information from packet captures, logs, and other artifacts you may have acquired.
Plaso
Plaso is a collection of software that provides the ability to ingest a number of data types. A sample of the types of data that can be handled is shown in Figure 10.8. This list was produced by running log2timeline.py --info. One of the important components of Plaso is log2timeline, which does the work of taking the input, performing any parsing, and filtering then outputting a storage file that other tools like psort can use to generate output that you can use in your reports or in any other timeline you may want to create. Plaso is a collection of Python scripts and all of them are run from the command line. While you can output to different file types, including Excel spreadsheets, comma-separated values, and different database types, none of the outputs will cleanly create the sort of visual timeline shown earlier.

Figure 10.8: Plaso filetypes.
The output shown in Figure 10.8 was created on a Kali Linux system using the Plaso package. If you were to install it on your own or on a different system, you may get a different collection of input and output formats, depending on the dependencies that may be installed. Plaso relies on a number of libraries and other software packages to handle some of the work, so if those libraries are not installed some of the functionality Plaso is capable of won't be available.
PacketTotal
Just like the website VirusTotal is capable of doing analysis on potential malware samples, PacketTotal can perform analysis on packet captures, presenting the information in a variety of forms. Figure 10.9 shows PacketTotal showing the list of all of the frames that have been captured. This is in chronological order, though it's probably not significantly more helpful than Wireshark is at just showing all of the communication that took place over the time period of the packet capture. However, in addition to just the list of all packets, PacketTotal has also extracted some other information, which can be seen in the tabs along the top. In addition to just the connections, which you are seeing here, you can also view SSL Certificates, Transferred Files, and Strange Activity. There was strange activity in this particular capture but it was two messages that were not responded to, which isn't all that unusual, considering the capture may have been stopped before the response came back.

Figure 10.9: PacketTotal console view.
You haven't seen it all, though. PacketTotal is actually capable of generating the timeline for you if you didn't want to deal with the tedium. The timeline in Figure 10.10 shows all of the communication sessions that were found in the packet capture file that was provided. You are able to zoom in and out using your trackpad or scroll wheel on your mouse. If you zoom in, you can then scroll back and forward in time using the buttons on the page.
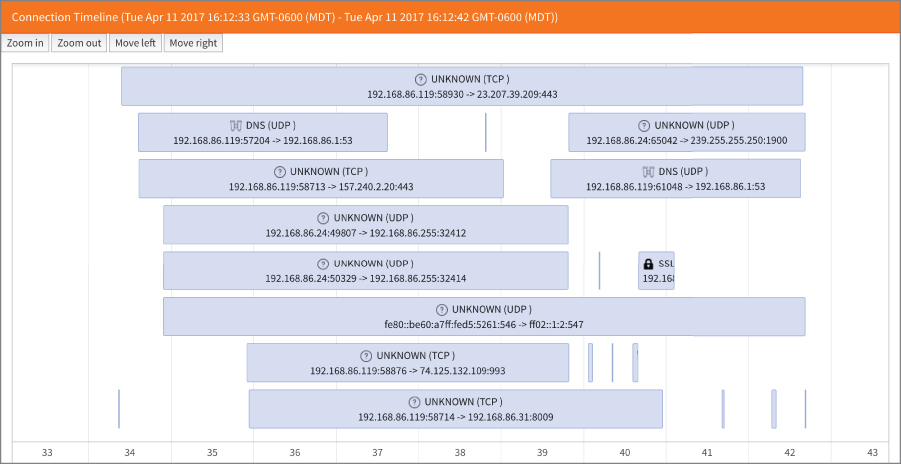
Figure 10.10: PacketTotal timeline view.
PacketTotal will also help perform some analysis. The Analytics page provides a number of charts and graphs that represent the different communication streams in different ways. For example, PacketTotal breaks out the communications by service and protocol as well as source and destination address and port. This is perhaps a better way of visualizing the packet capture since you can see clearly where your most active participants were during the time period of the packet capture.
Wireshark
Wireshark has its own capabilities when it comes to generating time-based data that can help you present information within a timeline. Wireshark can't create a timeline for you other than the main Wireshark window that displays every frame captured in chronological order. However, it can represent information in different ways. One way is just using standard filters within Wireshark. A filter provides you a way to isolate just the specific packets you want to look at, which can limit extraneous noise. If you isolate down to a single conversation stream, you can see the order that the messages happened in. Wireshark will also decode the messages for you so you don't have to flip from one packet to another trying to read the payloads. If you Follow Stream, whether UDP or TCP, you will see the messages without all of the headers. That can help provide a better understanding of what happened within the course of the conversation. You would still need to refer back to the individual frames to get timestamps, however.
In addition to filters, the Statistics menu provides a number of functions that can be useful. The Conversations statistics, shown in Figure 10.11, provides a list of all of the conversations that took place. From the Conversations window, you can generate graphs, though the graphs are more oriented toward network analysts who are looking at specific protocol information. It is less oriented toward providing a timeline of the conversation. However, the graphs that are generated do show the timeline on the X-axis. The Y-axis is less likely to be interesting to you as a forensic investigator, however.
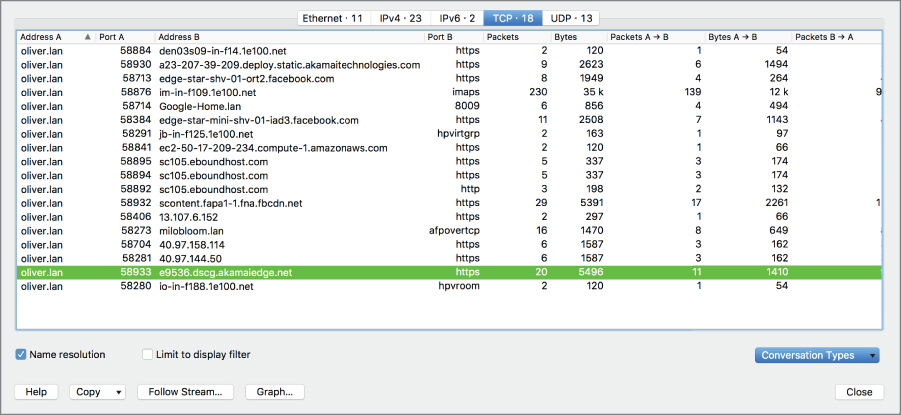
Figure 10.11: Wireshark conversation.
Wireshark's Analyze menu also provides some sources of information, including the Expert Information, which provides warnings of packets that were potentially problematic on the network. In cases of low-level packet attacks, this information may be useful. For example, excessively fragmented packets will show up here as will packets where the headers appear to be incorrect, which may be evidence that they were tampered with.
Security Information and Event Management
We have talked about log management solutions. Similar to log management solutions is the Security Information and Event Management (SIEM) system. There is a lot of intersection between the log management solutions we talked about earlier and a SIEM solution. This is especially true when you are talking about one of the more full-featured solutions like Splunk. While there is overlap, to some degree, there are solutions that are specifically SIEMs. As an example, IBM has a SIEM named QRadar. McAfee has one called the Enterprise Security Manager.
Ultimately, what's the difference between a SIEM and a log management solution? A log management solution is more generic. It takes a lot of data in and provides you with a way to search for information with your log storage. There can be a lot of value there but when it comes to security information, especially when it comes to incidents, security analysts will want to do more than just search for information. They want the system to be able to perform a lot of correlation of events to filter out a lot of the noise. Additionally, they want a workflow tool that can help track the incident from origination to resolution. This is primarily where a SIEM would differ from a log management solution.
This is not to say that the heavyweights in the log management space don't have capabilities around incident work flows, like generating alerts and handling them, but the object of a SIEM is to focus specifically on security-related information. This may include logs, it may include alerts from other systems like antivirus, and it may include integration with other security software products in order to assist in the troubleshooting and resolution of the security incident.
A SIEM can also serve as a central log storage system and provide capabilities to query the information that it stores. It should also be able to generate reports based on the information that it has acquired from the endpoints, servers, and various software solutions that have been integrated with it. These reports may also provide you with data that you can use to create a timeline.
Most importantly, the SIEM will do a lot of correlation for you so you don't have to pull a lot of data together yourself. This typically requires writing rules to tell the SIEM what data should be put together to trigger an action. As an example, IBM's QRadar considers two types of data that you can create rules from. One is event data, which would be log sources, and the other is flow data. Flow data would be generated from network devices. If you pass flow data to your SIEM, it can be used along with your log data to trigger a result to the rule you have created.
Each SIEM will generate rules in different ways, of course, and some may include some default rules, while others may provide tools that allow you to create complex, fine-grained rules to do much of the work of sifting through a lot of data for you. That is one of the major advantages to making use of a SIEM—letting it do a lot of the grunt work for you and leaving you free to just follow up on something that looks like it may be an incident.
Summary
As you are working on your analysis, you will find that you have a large amount of data to sift through. This may come from logs, packet captures, network flow information, or perhaps even alerts from other systems. To make sense of all of this data, you need to be able to correlate it in some way. One way of doing that is to just simply put everything into a chronological order and see what lines up. You may find data from entirely different sources suddenly makes sense if you can see it all in a coherent way with times lined up correctly.
This can be harder if your systems are in different time zones and their clocks are all set to those time zones. While it can be done, it may be simply easier to set all of your important systems like network devices and servers to UTC time so that no matter where your data comes from, it will all be stamped the same and there is no additional effort required to pull it together into a single timeline. While you are working from a single time zone, you may still have clocks that have drifted. Using NTP to make sure your system clocks are all synched to a time standard, like one of the ntp.org pool clocks, will help ensure that you don't have one system 10 minutes off from the others, which will skew the results of your investigation.
Creating timelines can be challenging work, but you can get some tools that can help you. Plaso, for instance, is an open source program that includes a number of scripts that will ingest data from different sources and create a coherent timeline of events in different output types. Plaso does require that you are comfortable with the command line and, ideally, Linux, just because of the way it was written and is available. This doesn't mean you can't run it under Windows, but because it is written in the scripting language Python and makes use of a number of libraries that are more commonly found on Linux, it may be a more natural fit there. However, lots of things are possible and many do use it under Windows.
PacketTotal is a website that is capable of generating timelines from a packet capture. You can create a timeline chart using the web interface and that chart can be helpful in visualizing the network communication. Wireshark can also help you visualize the network capture in different ways. The statistics and analysis capabilities of Wireshark are deep.
Finally, get yourself some help. Log management solutions and SIEM solutions can take a lot of the work out of extracting useful information from the number of sources you are going to have. A tool like a SIEM can also be used to create rules that can help you correlate events from different sources, including logs and network devices. Once you have written the rule, you can have the SIEM do the dirty work of digging through the pile of information that you have available. Some of this may also be possible using a log management solution, depending on the solution you have. A lot of feature-rich log management solutions are available.