
4
Packet Capture and Analysis
He has begun to move into the servers and away from the desktops, feeling like he has enough desktops from this particular network under his belt. The challenge with the servers, though, is that they are likely to be better monitored. This may mean that an administrator has a packet capture running. Even if he is encrypting his communication to the server, he realizes that anyone capturing packets would be able to see at least where he is coming from and that backdoor port is going to look a little suspicious over time. Fortunately, it isn't that hard to determine whether an administrator is capturing packets. Checking out the list of running programs will work, searching for well-known programs that will do that. On top of that, it's possible to see whether the network interface has been placed into the mode necessary to capture traffic.
Unfortunately, he is aware that just because no one is watching him from this system doesn't mean that no one is watching him from somewhere else. It could be that a network administrator is watching using a spanning port or a network tap. Nothing much to do about it, though. Encrypt and move fast. Hope any users or system administrators don't see it and shut everything down before he can get the good stuff and maybe even find another system to move off to.
One of the most important skills you can acquire when it comes to any sort of network analysis is capturing packets and performing analysis. When it comes to doing network investigations, the wire is your friend. Packet capture captures what happens on the wire, and what happens on the wire is true and accurate because there is nothing to get in the way. With applications, there are a lot of ways to get it wrong. Even the operating system can be tricked into providing you incorrect information if malware has infected the system. However, once you are down to reading electrical signals or light pulses off a cable, you have exactly what is happening. Of course, it is possible to perform this capture on a system that may, in fact, be infected but so far there is no malware that has gotten so low that it can get between what is being transmitted out to the network and the capture of that information.
For the most part, this is information you can absolutely rely on. Nothing is hidden and there isn't a lot of poking and prodding needed to find additional information. Applications that are communicating across the network have to use the same protocols on both ends and they are generally well-known protocols. If they don't each use the same protocols, it would be like someone talking Japanese to someone else who is speaking Portuguese. Neither is going to be able to understand the other very well. From a networking perspective, you may as well simply not send anything out or just drop it on the floor, as we say in the networking world.
Fortunately for us, some excellent resources are available that can help us with both capturing and analyzing the network data. One that we will spend a lot of time with in this chapter, Wireshark, has made life much easier for anyone who wants to do anything with networks. Wireshark provides a lot of capabilities and does an incredible amount of analysis and decoding. This is especially amazing considering that it costs nothing and goes well beyond the capabilities of the early protocol analyzers that cost thousands of dollars.
While Wireshark is a graphical program, which makes visualization easier and more convenient, you won't always have the luxury of having a graphical interface. As a result, you will need to rely on console programs like tcpdump and tshark to do the collection of packets for you. If you aren't seeing what you need in the console output, you can then import a saved packet capture from them to perform analysis using Wireshark.
When it comes to capturing packets, you need to consider where you are actually going to capture the packets you need. You can do it on an endpoint device, like a desktop computer, but that requires installing software. You may not want to install this software on the endpoint you are trying to pay attention to, for a variety of reasons. Fortunately, you have other ways to capture those same packets on a separate device, while still getting all of the data that would be available on the target device. This is one of the great things about networks in general and network forensics specifically—you have a number of ways and places to get the same information and it will always be the same.
While Wireshark has a lot of capability when it comes to capturing and analyzing captures, when it comes to forensics, there are other tools that can do some of the heavy lifting for you. One of those is a program called NetworkMiner. Using NetworkMiner, you can capture traffic off the network, just as you can with Wireshark and tcpdump. Rather than showing you just the packets for you to analyze, NetworkMiner will pull useful files and other interesting evidence out of the capture. A tool like this makes life quite a bit easier for forensics practitioners.
However, no matter what tool you are using, or where in the network you are using it, we have to capture some packets, so let's start there.
Capturing Packets
While we call it capturing packets—and in the end, it's packets that we are looking at—in reality what we are capturing is frames. Remember that when we are talking about data structures at the wire level, we are talking about frames. When you are capturing on a local area network (LAN), you are going to be looking at Ethernet frames. Ethernet, by default, has a maximum transmission unit (MTU) of 1500 bytes, including the headers. Any packet that is larger than that will be fragmented into smaller frames. Once you have the data captured, you can put it all back together, of course. However, each unit of data you are capturing is a frame.
Packet capture programs insert themselves into the network stack, meaning they are in the middle of the operating system, which is responsible for getting frames out onto the network. Prior to the frames being sent to the network interface to be converted to either an electrical signal or a radio signal, the packet capture program will grab copies of the frames and store them. This may just be long enough to display the header information, as may be the case with a command-line capture program, or they may write the frames out to disk in a specially formatted file that can be opened later on to display the frames for analysis. Similarly, on the way in, before the frames are handed up to the higher layers of the network stack, the packet capture program will take copies.
Because these programs are engaged in some of the input/output functions of the operating system, they require administrative privileges. Not every user is going to be capable of capturing packets. A Windows system may require that you elevate the privileges of the packet capture program or it may interface with a service that is operating with elevated privileges. Other operating systems like macOS and Linux will also require elevated privileges to capture the packets.
Another reason why the elevated privileges are necessary is because the network interface needs to be configured to operate in a special mode. By default, network interfaces will only respond to messages that are addressed directly to them or sent to a broadcast address. Because the network interface carries its own MAC address, it knows whether a frame coming in matches either its MAC address or the ff:ff:ff:ff:ff:ff address of a broadcast message. Any other messages are going to be dropped by default and not passed up to the operating system. To capture packets, the network interface needs to be told to capture everything that is seen and pass it up to the operating system. When a network interface is capturing all messages, it is said to be in promiscuous mode.
There was a time when only specially constructed network interfaces were capable of this particular mode, which is one reason why network analyzers could be so expensive. These days, however, nearly all network interfaces can be placed into promiscuous mode. This means that any system can become a network analyzer using free software, which really changes the game when it comes to packet analysis.
There is another special mode that is necessary on wireless networks, referred to as monitor mode. With wireless networks being more commonplace, you can capture the wireless frames easily but what you won't see, unless you have a wireless interface that supports monitor mode, is the radio headers. This is the communication between the client device and wireless access point. In most cases, this information isn't necessary but sometimes it's useful to see. Not all packet capture programs are capable of turning on monitor mode and not all wireless interfaces are capable of supporting it. If you need to capture the radio frames from a set of wireless communication, because those will show you authentication to the wireless network and other useful information, you need to make sure you have an interface that can be set into monitor mode.
A number of programs are available to do packet capture; this chapter covers the most common ones. Although others may be available, they will often behave very similarly, including the command-line parameters needed to make the program operate. As a result, we aren't going to be exhaustive in talking about different packet capture programs, but you will be able to get a good handle on the process.
Tcpdump/Tshark
Tcpdump is a program that has been available on Unix operating systems for decades. Various versions of the program existed in various states on different Unix-like operating systems for over a decade before they were finally collected into a single project in 1999. In the meantime, other packet capture programs were available, like snoop on the Sun Solaris operating system. While there may have been implementations of tcpdump available for Linux prior to 1999, tcpdump has been available as a package on most if not all Linux distributions. There has also been a port available for Windows called windump that runs on the same underlying packet capture library that tcpdump uses.
By default, tcpdump will print summary header details of each frame that it captures. This is all you get unless you tell it you are looking for something else. By default, without any additional options, Listing 4-1 shows what a packet capture looks like using tcpdump.
The summary information shows the time that the packet was captured, the protocol in use, the source and destination address, and then some additional information, based on the type of packet. As an example, the first packet shows that it's a UDP packet and the length is 182 bytes. The fourth packet down indicates that there was a DNS request for a PTR record. If you look at the end of each of the addresses that are shown, you will notice that there is a port number. However, it may not look like a port number. In the very first packet, the source address is 172.30.42.19.vcom-tunnel. The first part of that is the IP address but the second, vcom-tunnel, is the name for port number 8001. Some port numbers are considered well-known and registered. Tcpdump is capable of looking up the name associated with the port and printing that out. It does this by default, though it doesn't have to. Similarly, you will see that it prints out the hostname for each address that has a hostname. It has to do a lookup to print that out, however.
You can also ask tcpdump to provide more detail in the summary output. All you need to do is add a -v to the command line. This tells tcpdump that you are looking for additional verbosity in the output. Listing 4-2 shows a sample of tcpdump output with the additional verbosity. However, this is still just a summary of the header information and doesn't include any of the contents of the packet. There is no data shown here.
What you get, as you can see in the output, is additional header information. In the first packet shown, you can see the payload length as well as the flags and the checksum. The sequence number and acknowledgment number that are in the TCP headers are shown here as well. What you can also see is that the checksums have been validated and have checked out. With IPv6, there is a next header field to indicate what the next protocol beyond IP is. The first two packets are both IPv6 and they both have different next header fields. One of them indicates that the next header is TCP and the other's next header is UDP.
So far, we are talking about just summary information. We can get some additional information out of tcpdump by adding an additional v to the command-line parameters. To get more of a protocol decode, you can use -vv with tcpdump. You can see more details in the packet capture in Listing 4-3.
Much of this looks like what you have seen before. A couple of lines here, though, are a bit more telling in terms of the additional detail. The very first line is an ARP request. Tcpdump is actually decoding the packet for you. Rather than simply presenting the raw data, it's telling you what the packet is really doing. In an ARP message like the one shown, the raw data would be binary and you would have to do a lookup for what the operation code (opcode) means. This is what tcpdump has done. Tcpdump is telling you that this is an ARP request and the request is for the MAC address of 172.30.42.1. The system that has 172.30.42.1 should reply to 172.30.42.19.
Another packet that stands out is the next one down, which is a dynamic host configuration protocol (DHCP) message. To locate the individual packets in a capture like this, find the timestamp. That will indicate the start of each packet. This decode indicates that this has an option code of 53, which indicates what type of message this is. In this case, it is a non-acknowledgment (NACK), which is typically used by the server to indicate there was a problem with a request. The message we are looking at has originated from 172.30.42.1, which is the IP address of the DHCP server on the network.
Other packets that have been captured in this sample provide varying degrees of useful information. In most cases, rather than just a summary of the headers, tcpdump is providing a decode of all of the header information. This means that tcpdump is not presenting the information to you as it would be if you were just to look at the data. Instead, it is converting the data to something that is more meaningful to us. The next-to-last packet shows that the Push flag is set, as an example. In the actual packet data, it doesn't say Push. It's a single bit that is set. Tcpdump also provides us with the checksum value and the fact that it is correct, meaning tcpdump calculated a checksum on the packet and it is the same as the one that was transmitted.
Again, header information is great. You will very often need data. This means that you need to grab the entire packet and you will also need to make sense of the data you have. As fond as I am of console-based (text-based) programs, this is a case for a graphical interface because it's easier to visualize and break the packet apart in ways we don't see in the console. However, tcpdump is a great way to safely capture data. It's also a good way to get captures from nearly any system. You can make use of a lightweight sensor or even a less powerful computer to capture packets using tcpdump. Graphical interfaces are far more complex. What we are going to do below is make sure that we are not only capturing all of the data, but we are also writing the results out to a file on the disk. You can see the necessary flags for tcpdump in Listing 4-4.
The -s flag tells tcpdump that we are using a snap length of 0, which really tells tcpdump to use the maximum value. By default, tcpdump will only capture 68 bytes, because that will generally ensure that you get the header information necessary for tcpdump to do the decoding that it is capable of. What we need is the entire packet and not just the first 68 bytes. The -w flag says to write out to the disk. The value after the flag indicates the filename that will be used to store the packet capture to.
One aspect of tcpdump that may be of some value, and that we will cover in more detail in the “Filtering” section later in this chapter, is filters. You will find that in the filtering section later in this chapter. You can add a filter onto the command line to tell tcpdump which packets you want to capture. As an example, you can specify a host. When you tell tcpdump that you only want to capture based on a host, the only packets that will be captured are ones where the source or destination addresses match the value that was provided to tcpdump with the host parameter. You can also tell tcpdump which protocols you want to capture. These filters, called Berkeley Packet Filters, will help you limit the capture size so you can focus on the data that you are really interested in looking at.
One advantage of learning how tcpdump works is that other packet capture programs will use the same command-line parameters. All you need to do to get packets captured is to change the name of the program. One such program that works on the command line but makes use of the same command-line parameters as tcpdump is tshark, which is a command-line program that comes with Wireshark.
Wireshark
Many years ago, protocol analyzers were very expensive devices with special network interfaces and software that could communicate with the network interfaces to extract and present network data. In 1998, Gerald Combs was working for a small Internet service provider and he decided he was going to write his own protocol analyzer. What he wrote was originally called Ethereal, but eventually became what is now Wireshark.
The Wireshark project, which has undergone ownership changes, now has well over one thousand contributors listed on its website. As it has grown, it has continued to add a lot of functionality. Unlike tcpdump and tshark, Wireshark is a graphical interface. Where tshark will just present you a summary and the highlights of the important information, mostly from the packet headers, Wireshark includes a number of modules called dissectors. These dissectors are what make Wireshark so valuable.
While it is not generally recommended to do this directly, Wireshark can be used to capture packets. In Figure 4.1, you can see Wireshark after it has been started. In this instance, I am using Wireshark 2.0.4, which has a different interface than the 1.x version, which can still be used. On the welcome page in Wireshark, you have quick links that can be used to start captures. Under the Capture header is a box where you can provide a capture filter, which can narrow the number of packets that will be captured. Below the capture filter box is the list of interfaces available to capture from. In this figure, it may be difficult to see but there is a very small graph indicating network usage next to interfaces that are actually sending or receiving network traffic. On this system, only the WiFi interface, en0, is engaged in network communication.
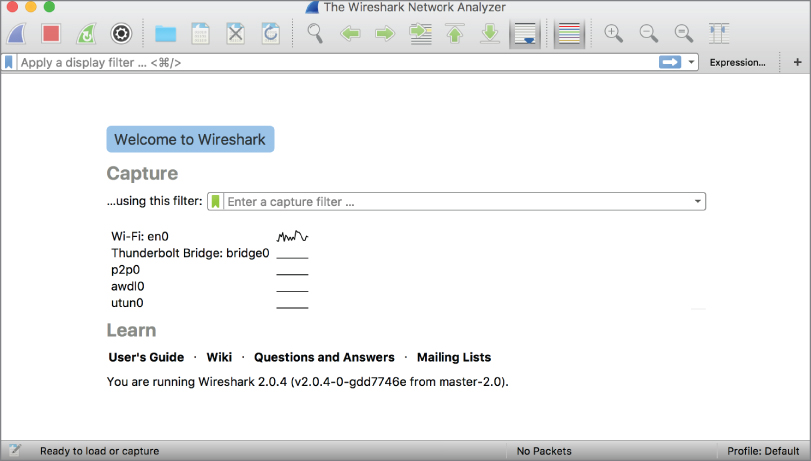
Figure 4.1: The Wireshark interface.
While using Wireshark, you can immediately start investigating traffic while it is in the process of capturing. In Figure 4.2, you see Wireshark in the middle of a capture. Three panes are worth looking at in the Wireshark window. The top is the list of frames that have been captured. The middle is the list of headers. This list can be broken out to have Wireshark explain everything in something closer to plain language that you can read. The bottom pane shows the raw data. This includes a hexadecimal dump of each byte as well as an ASCII decode of those bytes on the right-hand side. Not all of the bytes can be decoded to a printable ASCII value, which is why you may see a lot of dots (.). That just indicates that there is a byte there but it can't be printed.
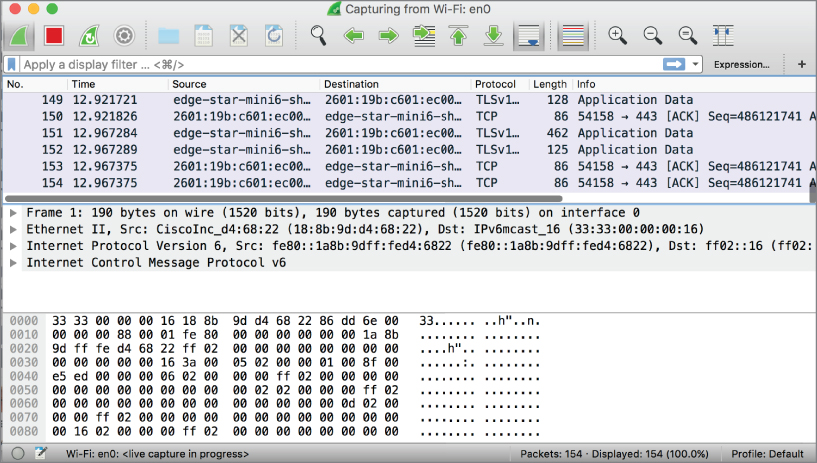
Figure 4.2: The Wireshark Interface.
Like tcpdump, Wireshark will put the network interface into promiscuous mode to capture all of the packets that pass by the interface. Putting the interface into promiscuous mode, as it is a hardware-related function, requires administrative access. Some systems will introduce a system service that handles the capture and then passes them up raw to Wireshark, which keeps Wireshark from needing to operate in administrative mode. Instead, the service that does the capturing runs in an administrative mode while Wireshark can run as any user. If Wireshark does have a vulnerability that has been exploited, the exploit only runs with the permissions of whatever user is running Wireshark. While it's still not ideal to have Wireshark exploited, it's better to do it with limited permissions rather than allowing the attacker to have complete run of the system.
No matter what program you use to capture packets, the issue is going to be how you get packets to the system. In a normal network configuration, what you are going to see is packets that are destined for the system anyway as well as any broadcast messages. Though this may be all that you need, there will be times when you need to get access to all network traffic. This is not something that can be done using the packet capture software alone. To get everything, we need additional help.
Taps
In most modern networks, if a system is connected using a cable, it is with a multi-wire, copper Ethernet cable and the cable is plugged into a switch on the opposite end from the system. Years ago, systems were connected using hubs. A hub is a broadcast device when it comes to networking. Essentially, any signal that comes into a port in a hub is repeated back out to every other port in the hub. Because that consumes potential bandwidth and can impact performance on all systems on the network, switches have become far more common. A switch takes a look at the Ethernet header to determine what the destination MAC address is. Based on the destination MAC, the switch does a lookup using content addressable memory (CAM) to determine the port that the frame should be directed to. As a result, when switches are used, the only traffic that gets sent to a system is a frame that is addressed to the system in addition to broadcast traffic, which goes to all ports.
The reason for using switches is that hubs cause problems with performance. The network connection between you and the hub gets filled with network communications that aren't destined for you. You can alleviate that by using a switch, even though the hub guarantees that everyone on the network will see what everyone else is doing. One way to get traffic from a particular network segment over a short period of time is to use a hub. It's not going to make any of the users on the other end very happy because they won't be able to use the maximum bandwidth on their connection. Instead, they will be sharing the overall bandwidth on the network with everyone else.
Another way to get traffic that is really destined to other systems is to use something called a tap, sometimes called a test access point (tap). The thing about copper network connections is that they consist of two pairs of thin copper wires. One pair is responsible for transmitting data and the other pair is responsible for receiving. Perhaps it's obvious but when two systems communicate with one another, it's necessary for the transmit wires to be copied over to the receive wires. This is done by the hub or the switch, depending on what you are using. To intercept communications over copper wires, the tap is inserted into the middle of what would normally be a single wire. As a result, you have the wire running from the computer into the tap and then another wire coming out of the tap going to the switch or router, depending on where you are capturing your traffic. The tap sits in the middle of what would otherwise be a single, uninterrupted cable, and includes a monitor port. The monitor port is where the traffic passing through the tap gets sent so it can be plugged into a device capturing traffic. You can see a basic diagram of what a tap would look like in Figure 4.3.

Figure 4.3: Copper network tap.
The reason for having two cables coming out is that it would be impossible to combine the two signals without causing corruption. Because both transmit pairs could be communicating simultaneously, trying to combine the two signals could end up having one signal cancelling the other out because you are talking about adding two electrical signals together. The waveforms from those electrical signals have the potential to either cancel each other out or amplify. Either way, you don't end up with two sets of data together; you end up with a single set of totally unusable data. Because you can't combine waveforms at the electrical layer, you have to have two cables that you can monitor.
In the case of copper connections that use electrical signals, the tap just repeats the signal across two separate cables. This is easy to do using basic electronics so copper taps are fairly simple. Not all connections these days are copper, however. Some connections make use of fiber cables that carry light pulses, either from a laser source or a light emitting diode (LED) source. Light is not as simple to duplicate, however. But there are other ways to capture light that you can't do with copper. Essentially, you split the signal by shaving a small portion of it off. This approach is referred to as a passive tap because no active electronics are involved. You're just taking a portion of the light, as you might by using a mirror with the sun's rays, and diverting it somewhere else. This approach reduces the signal, because you are diverting a portion of it.
You don't have to use a passive tap, though, if you are concerned about inadequate signal at the far end. There are active taps that do re-create the light signal. This means you have 100% of the signal going to the far end. It also means that you need some additional electronics, though, to take the light signal and repeat it. As a result, active taps are more expensive than passive taps. They also require a power source because of the electronics.
Just like copper cabling, fiber also splits into transmit and receive because you can't send light in two different directions on the same fiber strand. Just as with the copper, you would end up with the potential for cancelling the signals out or amplifying them and in the end, you'd have an unusable signal. Unlike copper Ethernet cables, though, fiber cables are not combined into a single jack. Both the transmit and receive fibers would have their own terminal connector. As a result, fiber taps will have two connectors for both the entry and exit cables and then you would also have the monitor cables as well.
Port Spanning
Taps are not the only way to get traffic. With enterprise-grade switches, you may have the ability to have the switch copy traffic from one port to another. This is called port spanning. Cisco refers to this as using a Switch Port Analyzer (SPAN) port. Normally, you would mirror one port to another, though it's possible to mirror all of the traffic on a single network segment, a virtual local area network (VLAN), to a single port. The challenge with mirroring an entire network segment is that you are trying to cram multiple network signals down a single pipe. This is called oversubscription. If you have twenty 1-gigabit ports that you are mirroring to a single 1-gigabit port, you have the very real potential of losing a lot of data. If you have even a tenth of the bandwidth used on all of the connections, you have two times more data than you have the bandwidth to acquire.
Not all switches are capable of supporting this sort of mirroring, but most businesses will have switches that can support this activity. Consumer-grade switches won't be able to support this, but this doesn't mean that you are out of luck if you don't have a tap or a switch that is capable of port spanning.
ARP Spoofing
On the local network, all communication is done using MAC addresses. The network itself is used to perform lookups on these addresses to resolve IP addresses to MAC addresses and vice versa. This means that every system is expected to respond when its number is called, so to speak. If one system is looking for the MAC address that belongs to an IP address, it will send out an Address Resolution Protocol request, sometimes referred to as a who-has request because that's how tcpdump and other packet capture programs render it in shorthand English. In some cases, a system that doesn't actually own that IP address will respond if it knows that the IP address will be reached by using it. This is called a proxy ARP, meaning that one system is acting as a proxy for another system, promising to pass the message along, much like kids in elementary school might.
To speed things up, every system will typically cache an ARP resolution in a table locally to prevent having to do a request the next time it needs to communicate with a particular address. A system may do this even if it just happens to notice an ARP message go by that it didn't request. This is commonly done in the implementation of the TCP/IP protocols on systems because it's efficient and can improve response times.
The problem with ARP is there is simply no way to verify that the messages being sent on the network are legitimate. I might, for example, send out a message in response to a request that I see go by. If my response beats the legitimate host, I will win and the message will come to me. Attackers may use this technique, called ARP spoofing, to get messages that are legitimately meant for someone else. It actually gets more complicated than this, though. I may not even bother waiting for someone to ask to know who a particular address belongs to. I may just send out a message telling everyone that a particular IP address belongs to my MAC address. When an ARP response is sent without any ARP request, the response is called a gratuitous ARP.
A gratuitous ARP is sent to everyone on the network using the broadcast MAC address ff:ff:ff:ff:ff:ff. Because systems are commonly set to just cache ARP mappings to save time later on, these messages are cached and the receiving systems have no way of knowing that they are bogus. An attacker can actually send these gratuitous ARP messages for any number of systems on the network. It may not just be a single host. Ideally, if I wanted to capture a particular communication flow, I would need to spoof both ends of the connection or else I'm only getting half of the conversation. I can easily go beyond just a pair of hosts, however. Using this technique, I could have all the traffic on the network sent to me. You can see this in Listing 4-5.
Looking closely at this, you can see that several IP addresses have been said to belong to a single MAC address. Fortunately, this is not complicated. A number of programs are capable of performing this particular technique. The technique is sometimes called ARP poisoning because what you are doing is corrupting (poisoning) the ARP cache on different hosts on the network. This particular ARP poisoning was done using a program called Ettercap. Ettercap comes with different interfaces. Once of them is fully graphical. You can also run it using just the command-line interface, specifying your targets. In Figure 4.4, you can see the console-based interface, which can be used if you need to do ARP spoofing but you don't have the ability to use a graphical interface.
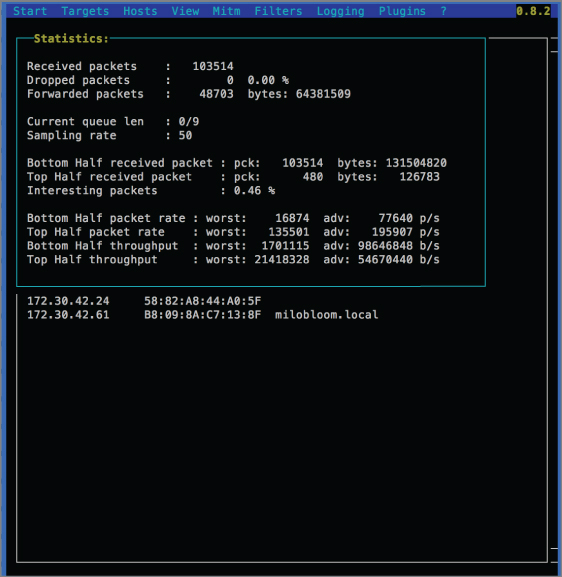
Figure 4.4: Ettercap in Curses mode.
One of the challenges with ARP poisoning is that once you have the packet, it isn't going to the intended destination. This causes two problems. The first is that people will start to get suspicious that the network isn't working. Second, even if the users don't really catch on quickly, the systems that are communicating will because they will be expecting regular responses if they are communicating over TCP, which will commonly be the case. If they stop getting response messages, they will determine that the connection has failed and just tear it down. This means that to continue getting all the messages that you want, you need to find a way to make sure all the messages you are getting get forwarded to their intended target. This behavior is not common for most operating systems by default because it effectively turns your system into a router, since you are taking packets in and then forwarding them back out again on the same interface.
While ARP spoofing may not be the best approach to collecting network information, it is one approach to making sure you can collect network information. If you are using ARP spoofing, you can use any packet capture program to bring the packets in because they are being sent to you. Any ARP poisoning program can be used alongside a packet capture program to acquire packets from across the network, regardless of whether you are on a switched network, because all of the systems are being told to just send you everything and they will comply.
Passive Scanning
Another technique to keep in mind is passive scanning. This particular approach just watches the data that passes across the network and reports specific details to you. With this approach, you aren't gathering all of the information that you would using a full packet capture that you were analyzing in Wireshark. You also aren't getting just a summary of header information, as you would get from tcpdump or tshark. Instead, a passive scanner will present you with useful details from all of the different layers. A passive scanner will just run quietly, observing data that is passing across the network interface. A well-known scanner that uses this technique is p0f. Using p0f, you will end up with output that looks like the results shown in Listing 4-6. The output you receive will vary, of course, depending on what traffic it is seeing.
What we can tell from this output is that there is a browser that is open and communicating with Google. The very first block of information tells us that the browser is Google Chrome, and includes the version number. We get the source and destination IP addresses and the source and destination port numbers. Looking more closely at the raw signature (raw_sig), it appears this browser is running on a Mac OS X system. This particular piece of information isn't that surprising because it was captured on the system that I am writing on and it happens to be a macOS system. Because it's providing information about the system where p0f is running, that's less interesting or useful. However, p0f isn't done.
Looking at the next block of information, it appears that the destination address belongs to a system that is running Linux and the kernel version is in the 3.x line. p0f was able to determine this based on the SYN/ACK message that it observed. The message type is in the very top line of the message block. Further down, p0f was able to determine that the remote system has been up for over 26 days. By really pulling all of the packets apart and doing deep investigation, it has been able to provide a lot of information that we may miss by simply doing packet captures and looking at them.
This is not to discount using packet capture programs, however. A good packet capture program, like Wireshark, will provide a lot of tools that we will be able to make use of to do network investigations.
Packet Analysis with Wireshark
Ethereal, later Wireshark, started out as a decent, free alternative to very expensive packet capture software, and it has evolved into a very mature and useful program. Using Wireshark, we can extract a lot of information because Wireshark will do a lot of analysis for us without us needing to go digging into messages one at a time. Wireshark keeps track of a lot of information as it gathers each frame and it also does a lot of the decoding and dissection for us. Additionally, it will provide a lot of statistics about the capture, which can be very useful for certain types of investigations. While the capture is displayed as individual frames, Wireshark will also gather all of the related frames together for us, presenting us with a plaintext view of the data from the conversation. This can save us from trying to pick pieces out of individual frames to add them to information from other frames.
In some cases, the communication will have a number of files that are being transmitted. Consider a typical web page view. In addition to the text that you are seeing on the page, often graphics files and potentially other files are brought in to create the entire experience. You could extract the data from each individual frame and collect it all together or you could just let Wireshark do that for you. Wireshark has a number of other capabilities, and we will be spending some time in subsequent chapters going over some of those. For now, let's talk about some of the basics that we will need as we go forward.
Packet Decoding
Perhaps the most important feature that Wireshark offers is the ability to decode the packet, providing details in plaintext. This saves us from having to do decoding on our own. As an example, you can see part of the decoding that Wireshark does in Figure 4.5. At the top of the screen capture, Wireshark has broken the different layers of the packet into its components. Each line constitutes a different layer and set of headers or data. You may also note that I said packet and not frame. The reason is that Wireshark has very helpfully collected all of the frames to present it all together without much additional work on my part.

Figure 4.5: Wireshark decode.
The first thing to notice, as mentioned previously, is that you get a line for each layer, starting with the physical layer. Wireshark provides a summary of how many bytes were captured and which interface they were captured on. When you get to the data link layer, you will see the MAC addresses but Wireshark has done us a favor by looking up the vendor from the first three bytes, which constitute the organizationally unique identifier (OUI). In the network layer, Wireshark has provided a lookup of the source IP address. What we don't see is Wireshark providing a lookup at the transport layer. This is configurable, however. Going to the View menu, as you can see in Figure 4.6, we can have Wireshark either provide us with the name resolutions, or not.

Figure 4.6: Name Resolution view.
One thing to keep in mind is that some of these name resolutions will require additional network traffic. In the case of the network layer, for example, it's not as though www.mobileread.com was provided in the packet that was captured. Instead, there was an IP address and Wireshark did the lookup. That lookup required Wireshark to initiate a DNS request. In the middle of the capture, you will see these DNS lookups as Wireshark observes traffic with addresses that need to be resolved.
Digging a little more deeply into the packet, we can look at how Wireshark has broken out all of the pieces of the different headers. In Figure 4.7, you can see how each of the different fields in the IP header has a line telling you what the field is and the value of that field. This includes breaking out the value of each of the flag fields, as in the fragmentation flags. If you want to see the individual flag bit values, you can click the little arrow on the left-hand side of that field. Otherwise, Wireshark has provided the value of the byte and a brief explanation of what that value means. In the flags byte, we have a value of 0x02, which means that the Don't Fragment bit has been set.
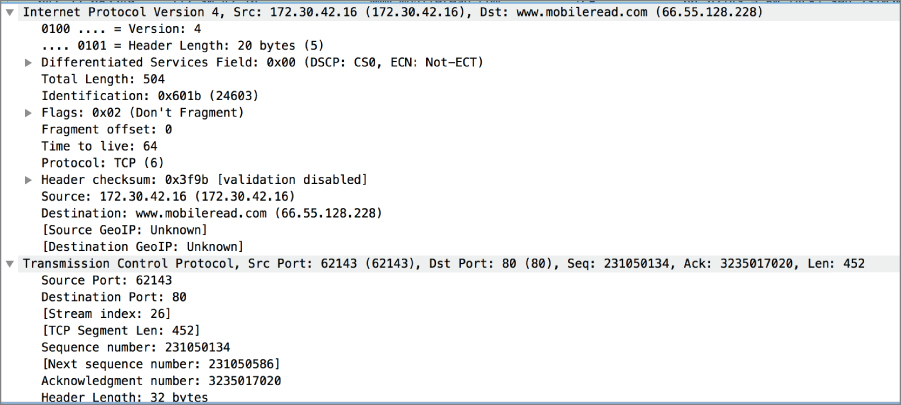
Figure 4.7: Header field values.
Similarly, you can see the different header fields for TCP have been decoded for us. In this view, we can see the actual value of the sequence and acknowledgment numbers. In most cases, however, Wireshark will take care of those values for us, providing relative values instead. This means that Wireshark will keep track of the base value and present that to us as if it were 0. Every subsequent value will be the amount incremented over the base value. In some cases, it may be easier for you to see the actual values that are being used so you can tell Wireshark to provide the values that are sent rather than the values that Wireshark will compute. Because the values are so large, it's generally easier to just allow Wireshark to compute the value rather than trying to keep track of it manually.
Wireshark will also provide you with the checksum, which is the value that is computed across different sections of the packet to ensure it hasn't been corrupted. You can have Wireshark compute the checksum or not. Disabling checksum validation can improve performance very slightly. If checksum validation is enabled, Wireshark will be able to tell you whether the checksum is valid. By default, Wireshark will not compute the checksum for you because often modern operating systems along with the network drivers will offload the checksum computation to the network hardware. This can end up with it appearing that the checksums are incorrect.
In addition to all of the decoding, Wireshark will also provide the raw packet data. This is shown in the bottom pane of the Wireshark capture window. You can see in Figure 4.8 the raw capture data from the packet that was shown earlier. This provides the raw bytes on the left-hand side, displayed in hexadecimal. On the right, in a traditional hexadecimal dump format, is the ASCII decode. The ASCII decode shows any printable characters. Otherwise, all you will see is a dot because the character can't be printed. What we can see in this particular pane, though, in addition to seeing the raw data, is where each value is located. As an example, the IP header checksum field has been selected. This is the 9th and 10th byte in the first line. At the very bottom, in the status line, Wireshark tells us the field that has been selected.
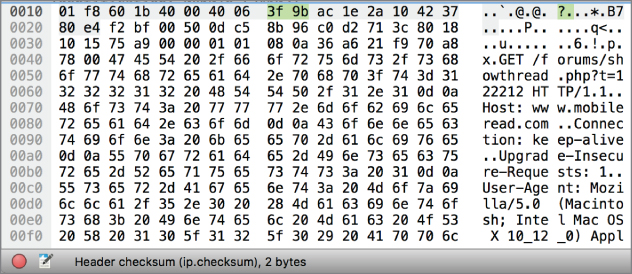
Figure 4.8: Raw packet data.
This is just a very quick overview of the different areas for which Wireshark does decoding of the packet for us. In addition to decode details, Wireshark keeps track of a lot of other useful information for us. We will take a look at some statistics that Wireshark provides a little later on in the Statistics section. One thing you may notice if you have started to do any captures on your own is that Wireshark captures a lot of information. The more information you capture, the more disk space you are using, if you are storing. Also, the more you capture, the more you have to wade through as you are looking for specific information. Having a way to narrow down whether what you are capturing or looking at is helpful. Wireshark offers a very rich filtering capability.
Filtering
Wireshark will allow for the use of both display and capture filters. You have a number of ways to perform filtering. In the display filter box above the list of frames captured, Wireshark will offer suggestions when you start typing. Filtering using protocols is easy. All you need to do is type the protocol, as in ICMP, HTTP, TCP, or UDP. Wireshark will then display all frames that match the protocol that you have specified. Beyond that, though, you can get into the specifics of the protocol. As an example, you can indicate that you want to just display packets where the IP address is 172.30.42.1. To display only those packets, you could type ip.addr == 172.30.42.1. This tells Wireshark that either the source or destination addresses should be the IP address specified. Note that Wireshark uses two equal signs to specify a match.
If you only want to see the packets where the source address is a particular address, you can specify ip.src_host as the parameter you want to match. Different protocols are capable of breaking out different parameters to filter on. As an example, if you are trying to filter through a lot of web traffic, you can specify different parameters of HTTP. You may only want to look for POST methods, meaning you are looking for where the client is sending information to the server. To filter based on that, you would use HTTP.request.method == POST. This would show you only packets that include a message to a web server where the request is a POST rather than a GET or any other method.
The filter box is not the only place that you can specify a filter, however. You can automatically create a filter by right-clicking any packet in your list. You will get a context menu that allows you to choose either Apply as Filter or Prepare a Filter. In either case, you will be able to use that specific packet to either include or exclude. The difference between Apply and Prepare is that with Apply, the filter is immediately applied, whereas selecting Prepare places the prepared filter into the filter box so you can edit as you would like.
Wireshark keeps track of a lot of information and to perform some of these types of filters, it identifies communication streams. When system A starts to communicate with system B, Wireshark will know, based on the same source and destination IP addresses and port numbers, that a number of frames may belong to that particular stream. Because it keeps track of all of that information, Wireshark can present you with specific conversations without you having to do a lot of work.
Statistics
Wireshark digs through the entire packet as it is displaying and decoding packets. In the process, it learns a lot about the entire data set. Using the various statistics that Wireshark provides, we can get a much better look at the entire capture. You can see the entire Statistics menu in Figure 4.9. In the middle of the menu are a number of protocol-specific statistics. These may not be useful to you, depending on whether you have captured any of those protocols. As a result, we can start with a broader view of the entire capture.

Figure 4.9: Statistics menu.
Two statistics views display similar information: the Conversations view and the Endpoints view provide specific details about the number of packets that are being transmitted. In the Endpoints view, this is displayed solely by the address that is responsible for the traffic. In the Conversations view, you will see both endpoints. Figure 4.10 shows the Conversations view. The difference between Conversations and Endpoints is that the Endpoints view only shows the endpoint and not the aspects that are related to the conversation. In the Conversations view, you will see the counts in both directions with addresses associated with both ends. In the Endpoints view, you will see A ⇨B and B ⇨A counts without distinguishing between different B hosts. All those counts show is how many bytes are going out versus coming in.
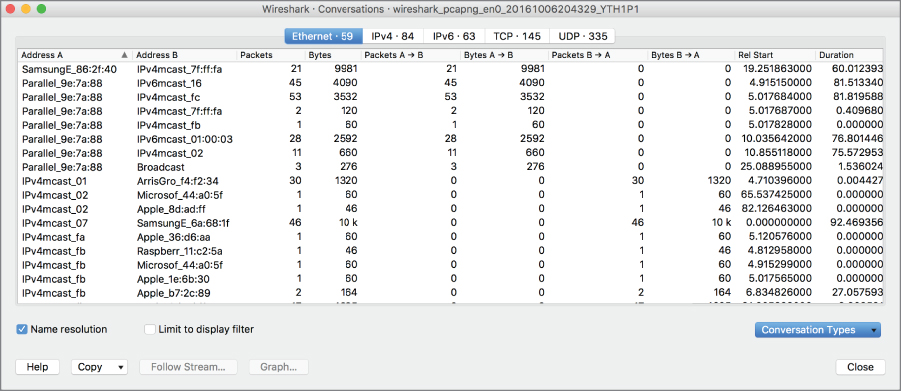
Figure 4.10: Conversations view.
Both of these statistics views provide both byte and packet counts. Because packets are variable length, just having a byte count won't tell you the number of packets. You similarly can't get a packet count based on the number of bytes. Both pieces of information can be important. You may also note that you can enable address resolution. This will provide address resolution of the vendor for the MAC address and if you click other tabs, you would be able to see names where Wireshark was able to look them up. As an example, Wireshark would provide the hostname that belonged to an IP address or the name of a port that had been used, assuming it was one of the well-known ports.
While you can sort the captured frames to organize the list by sender or recipient, using either the Conversations or Endpoints view is more convenient to be able to get a complete list of the endpoints and the conversations that are happening. One reason for that is the number of frames. Even if you are sorting your list of frames by the sender, each sender may have dozens or hundreds of frames. You would need to still read down through the entire list to make note of the different senders you have captured. Using the Endpoints statistics is much more convenient. Once you know who your endpoints are, you could move on to the Conversations view to determine who those endpoints are communicating with.
Using the Conversations view, you can get a look at the ports that are being used. If you click the TCP tab at the top, you will get a list of the conversations between source and destination and on that tab, you will see the ports on both the source and destination side. This may be able to tell you what is happening between these two systems, but it could also be that the ports don't tell you what you need to know. Another way of looking at the packet capture is to look at the Protocol Hierarchy view. This view, seen in Figure 4.11, can not only tell you where all of the data is being transmitted, but can also provide you with some outliers as well. Skimming through the packet capture may not tell you that there is an odd or unexpected protocol being used.

Figure 4.11: Protocol Hierarchy view.
As an example, scrolling down through the Protocol Hierarchy view, there was an entry for the Internet Control Message Protocol (ICMP). This seemed unexpected, so right-clicking that protocol allows me to create a filter. If you select Apply as Filter, Wireshark will prepare a filter for you based on the characteristics of what you have selected. Since I have ICMP highlighted, applying the filter based on that protocol places ICMP into the filter box at the top of the capture window. Wireshark will then only display frames that are using ICMP, as the display filter has indicated, and all other frames will be hidden.
Another statistics view that can be very useful is the IP statistics. As you saw in the Statistics menu, at the bottom there are entries for IPv4 Statistics and IPv6 Statistics. When you select one of those, you get a flyout menu offering the choice of All Addresses; Destinations and Ports; and IP Protocol Types or Source and Destination Addresses. Selecting Destinations and Ports shows you a view like the one in Figure 4.12. The advantage of this view is that you are able to see what the burst rate for the traffic is. The burst rate tells you what the peak speed is so you know how fast the traffic was moving at its fastest. This does not mean that it was sustained at that rate, just that it peaked there.

Figure 4.12: IPv4 statistics view.
In the last column on the right, you will also see the time that the burst started. Looking at the capture window in Wireshark, the time, relative to the start of the capture, is in the second column from the left. Using this column, you can identify the point in the capture where the traffic burst started. Once you have identified the point in the capture where the burst starts, you may want to be able to identify the complete traffic stream. Fortunately, there are ways to do that using Wireshark.
Following Streams
As mentioned previously, Wireshark keeps track of the different streams that have been captured. To filter based on just one stream, all you need to do is right-click one of the frames from that stream and select Apply as Filter using Selected. That will create a filter based on specific details from the packet, which may include the IP address. That's not the only way, though, that you can filter on a stream. Additionally, while TCP is often referred to as a stream-based communication protocol, Wireshark also keeps track of the communications that happen over UDP and can identify a UDP stream as well. Wireshark will use internally stored information to do this filtering.
Right-clicking one of the frames that's potentially part of a stream you are interested in will allow you to select Follow Stream from the context menu. This will immediately apply a filter by identifying the stream that Wireshark has attached the frame to. In Figure 4.13, you can see the filter that Wireshark has applied is tcp.stream eq 69. This is not the sort of information that you will find looking at the packet itself without Wireshark. Only Wireshark knows that stream number. If you were to open up the TCP header information, you would find a value that Wireshark has applied indicating the stream index. In addition to applying a filter using the stream index, Wireshark will also collect all of the data from the packets and present it in a single view. You can see that in Figure 4.13 as well.
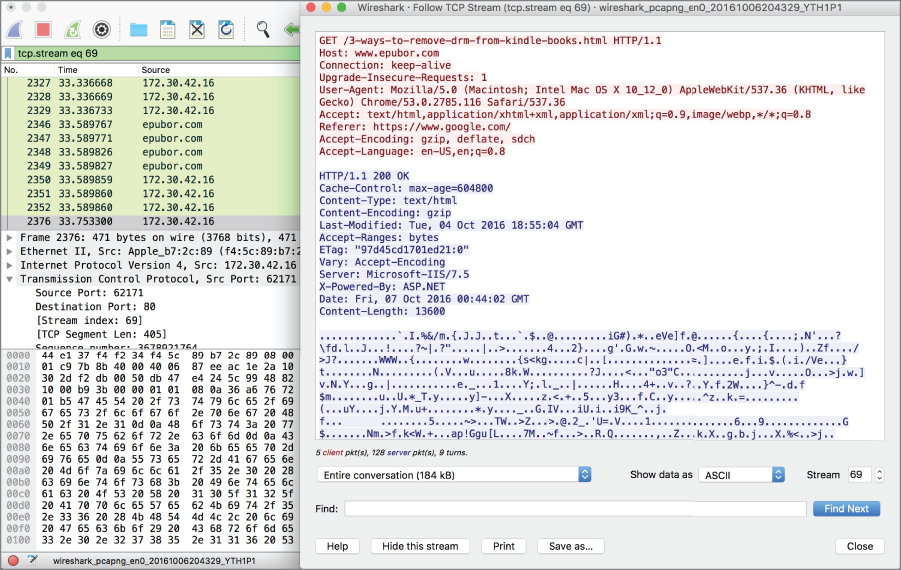
Figure 4.13: Follow stream.
While the plaintext of the capture here has been rendered by doing an ASCII translation, Wireshark is capable of performing a decode in other ways as well, including EBCDIC, C strings, hex dumps, UTF-8, Yet Another Markup Language (YAML), or raw. In this case, the web traffic was sent using ASCII for the encoding, but that won't always be the case depending on where you are in the world and the protocol that may be in use. Wireshark can help with just about any decode type that you may run across.
Following TCP streams works well if you have any plaintext that you want to be able to read across a number of frames or packets. It's considerably harder to try to extract all of that data manually. It's not impossible, because you can extract the data from each packet and put it together yourself, but it's quite a bit harder. If you have a text file that's being transmitted, you can still use the Follow Stream feature to get the contents. If you have binary content, that's harder to deal with. Wireshark can handle that, though.
Gathering Files
There likely will be a lot of files in a packet capture. This may not be immediately apparent, however. If you were just capturing web traffic, for instance, it may not occur to you that the data that is coming across the wire is a collection of files. Every image is another file. A web page may also contain JavaScript files if they are imported into the page rather than being included directly into the Hypertext Markup Language (HTML). Often, pages will include a number of other files as well, including Portable Document Format (PDF) files or Java applets, Flash scripts, or a number of other file types. This is just from web traffic. On a corporate network, files are being sent back and forth on a regular basis between file shares or as print documents.
Using Wireshark, you can identify all of the files from a packet capture. You can do this by just going to the File menu and selecting Export Objects. That gives you the option to select protocols that you want Wireshark to look at, including HTTP or the Server Message Block (SMB), which is a protocol that Windows systems will use to share files. Once you select which protocol you want, you will get a window like the one in Figure 4.14, which shows a list of all of the files that have been discovered being transmitted over HTTP from this capture. This list is mostly images that were grabbed from a couple of web searches, but it also contains PDFs.

Figure 4.14: Exporting files.
Once you have the list of files, you can select a single file and export that from the capture or you could just export all of the files from the capture. Again, though, this is protocol specific. Using a different protocol, like SMB, we get a different list from the same capture. Figure 4.15 shows a list of files that were identified as being transmitted over SMB. Just as in the previous case, you can see where the files came from. The hostname column shows the host and the file share that each file came from. You will also see the content type. In the case of web content, you will see the Multipurpose Internet Mail Extensions (MIME) type. SMB doesn't use MIME types, though, so all we see in the content type column is FILE. The filename itself is in the last column.
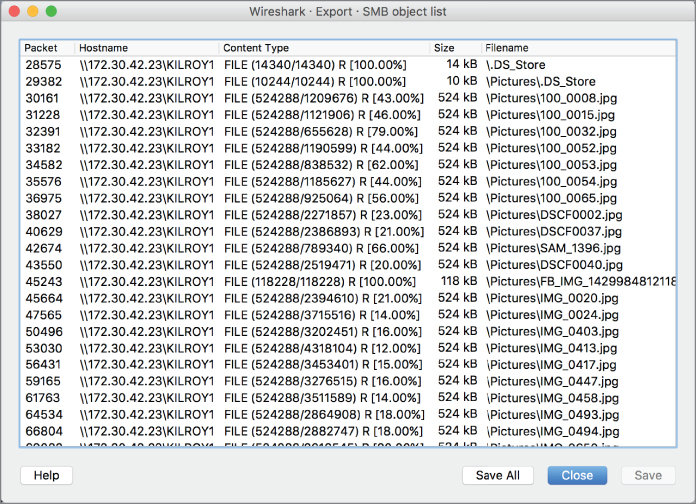
Figure 4.15: Files shared over SMB.
The one case for which this won't work is where the content has been encrypted. Encryption may use the Secure Sockets Layer (SSL) or the Transport Layer Security (TLS) encryption mechanisms. Web traffic that has been encrypted can't be decrypted using Wireshark unless you have the keys. In the majority of cases, you won't be able to get the keys to perform the decryption. If you were able to easily obtain the keys, the encryption wouldn't be of much value.
In cases where files are being transmitted across different protocols, you may need to go through the process of exporting the data from the individual packets. Wireshark is not the only program that can extract a lot of useful information from a packet capture, however.
Network Miner
Other programs are capable of extracting information from a packet capture. One of these is Network Miner, by Netresec. You can buy a professional version, and there is also a free version. The professional version adds a number of additional features that may be useful if you end up using this a lot, but for our purposes here, the free version will work fine. Because Network Miner is written in .NET, it can be run not only on Windows, but any operating system that can run the open source Mono platform. Network Miner will take the pcap file format that Wireshark writes and use that as input, extracting information like files, credentials, messages, keywords, and parameters.
Using Network Miner will save you a lot of time and effort that would be required to search for and extract information manually. Figure 4.16 shows a partial list of all of the files that were identified in the pcap. This includes the usual set of files that you would expect to see like image files, JavaScript files, cascading style sheet (CSS) files, or other documents. The list shown here includes certificate files that are associated with the encryption that is being used. When a client and server negotiate encryption, there is information that is shared. During the packet capture, files associated with that negotiation were captured.
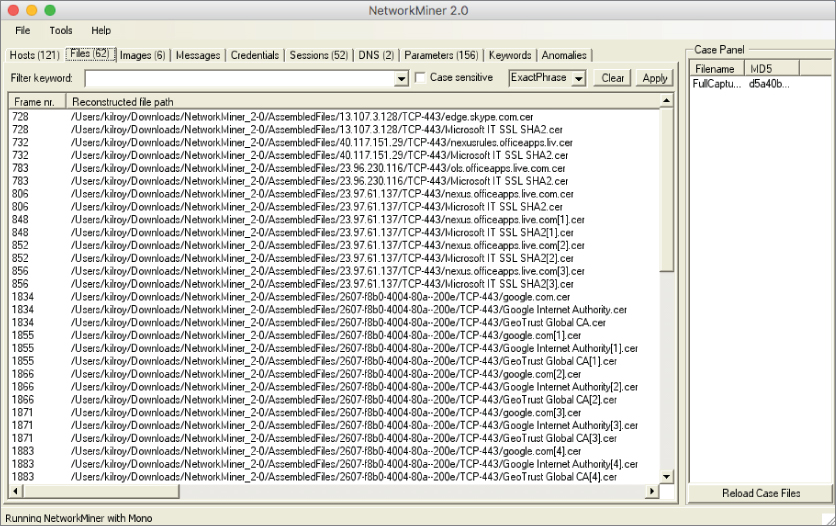
Figure 4.16: Files captured using Network Miner.
Looking at the tabs across the top, you can see other types of assets that have been captured. Wireshark can provide you a list of all of the endpoints and Network Miner will give you a list of hosts. Network Miner provides additional details about the host on the same tab, where in Wireshark you may need to look in more than one place to get this information. Each IP address shown in the hosts tab on Network Miner can be drilled open to get the MAC address, open ports, traffic statistics, and sessions. If available, Network Miner will tell you what the operating system is. Network Miner will also provide you with the hop distance, meaning how many routers the packets had to traverse to get to the system where the packets were captured.
What you will also notice on the hosts page in Network Miner is that the MAC address associated with the IP address is shown. In most cases, the MAC address will be for the gateway device on the network. The MAC address shown in the hosts in Figure 4.17 is for the router on this network. The only way to have the real MAC address associated with the IP address is for the two systems to be on the same physical network; otherwise, you get the MAC that's associated with the gateway used to get to the destination network. Network Miner, like Wireshark, will also provide the decoding of the MAC address to indicate the vendor of the network interface.
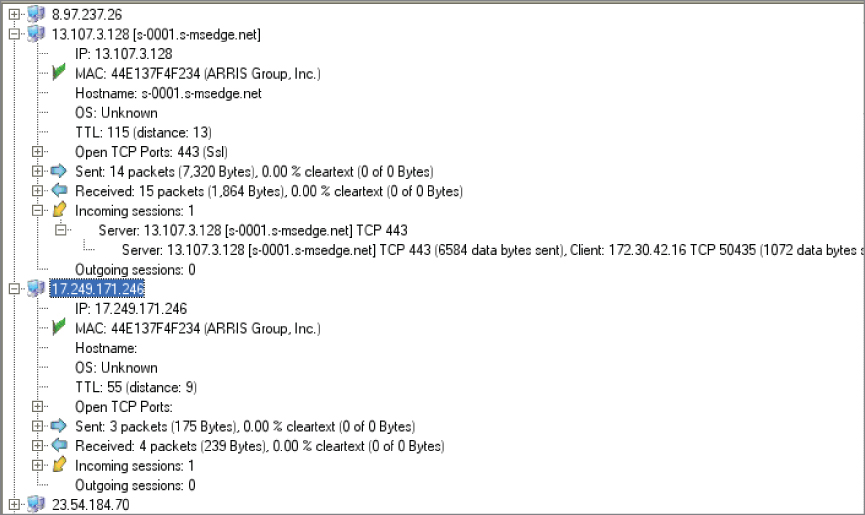
Figure 4.17: Hosts tab in Network Miner.
Summary
While there are certainly tools that will do a lot of the work for you in terms of decoding and analysis, it's still important to understand how to make use of those tools and also know what the information you are looking at means. There is no big report that will be created by these tools to tell you everything you need to know so you still need to know how to perform investigations of network attacks. Much of what we do in the rest of this book will be based on the information in this chapter because network investigations will often require taking a look at the data being transmitted over the network.
To start with, you have to be able to capture network traffic. There are programs you can use for that. Although Wireshark will provide a graphical interface that will allow you to capture data, there are problems with using Wireshark for that task. To capture network traffic, the application doing the captures requires administrative privileges and once you have enabled those privileges, you run the risk of exposing your system. You may also try to capture data on systems without graphical interfaces, so in either case, tcpdump, windump, or tshark may be good options. They are free and they use the same command-line options, based on how tcpdump has functioned for years. Using one of these command-line options, you can store data into pcaps that can then be opened later on in a graphical interface for analysis.
One of the challenges of performing packet captures is that networks are currently designed to only send relevant packets to systems. This is done using a network switch that knows the physical (MAC) address of all of the systems on the network. Based on that, only packets that are destined for a host, whether directly or via broadcast, will be captured on end devices. To get more packets requires something like a port span (SPAN port) on a switch, a hub that sends all packets out to all ports, or another technique like ARP poisoning to get traffic to a device that is capturing the network traffic and storing it for future investigation.
Wireshark provides a lot of functionality when it comes to analyzing network traffic. At first glance, just looking at the packets that have been captured, you can see a lot of the decoding that Wireshark does for you. For a start, it provides readable explanations for all of the header information. It will also break out the different header layers, explaining them individually rather than just presenting them in a single incoherent chunk. Wireshark can also perform resolutions of names at the network and transport layers. Saving steps for name resolution as well as vendor lookups from MAC addresses can be very helpful as you are starting to look at a packet capture.
Statistics to get an overall look at the capture are helpful as well. When you start up a capture or load a saved capture, you may see just a collection of thousands and thousands of individual frames. You need to have a way to organize all of those frames into aggregated data to have a place to start. The various statistics views can be very helpful to show you the endpoints and conversations as well as the different protocols that are available in the packet capture. Once you see where the bulk of the information is, you may be able to start looking a little more deeply. You may also use the various statistics as a place to create filters of the data, which will allow you to only show the data you really want to see, hiding extraneous data.
Filtering is an essential skill to have when working with Wireshark. Wireshark allows for both display and capture filters, allowing you to only look at data that you really want to look at. The filters will provide you with functionality to narrow the data based on addresses, ports, streams, or another specific field from headers available from different protocols. Wireshark will automatically create some filters for you or you can just type in your own filters to the display filter box. Once you have the ability to filter, you can start to actually look at the data.
Wireshark will also allow you to extract files from the packet captures. Beyond files, though, a lot of other types of data may be of interest. Credentials may be one type of data that you want to collect. Network Miner will automatically extract credentials, files, session information, and other types of data from the packet captures. You could acquire a packet capture using tcpdump, tshark, or even Wireshark, save it as a pcap file, and then load that pcap into Network Miner. Network Miner will do a lot of automatic extraction for you, presenting the different data types in tabs.
Fortunately, programs like Wireshark, tcpdump, and Network Miner are not limited to a specific operating system. Instead, they run across multiple platforms. Wireshark has versions available for Windows, Linux, and macOS. Tcpdump will run on Linux and macOS with a port named windump available for Windows systems. Network Miner is portable due to the fact that it is written in .NET and there is an open source project called Mono that implements .NET on systems other than Windows. This enables you to become highly skilled as a network investigator, no matter what platform you are using as your primary operating system.