This chapter presents some of the key network protocol analyzers along with other tools used to capture and evaluate the relevant data and statistics required when performing a network baseline study. Various tools can be combined with some of the tools mentioned in this chapter that are custom to certain networking infrastructure environments. Some of these tools include network management systems for internetwork hubs, switches, and routers. This particular chapter is dedicated to a review of specific tools in the category of network-based protocol analyzers, which can capture data and enable an analyst to view that data from a LAN and WAN analysis viewpoint.
Specifically, this chapter covers some of the most popular and technically competent protocol analyzers used to analyze LAN and WAN network topologies, and associated higher-layer protocol suites that travel across LAN and WAN mediums. Some of the tools are considered industry-standard products for network analysis, whereas other tools are somewhat unique and apply to a particular analysis or monitoring requirement.
To perform a network baseline efficiently, an analyst must use a protocol analyzer with proficiency. This section presents a general description of protocol analysis and performance tuning. From a methodology standpoint, protocol analysis can be considered the process of using a protocol analyzer to capture data from a network, to display the data, and then to next review the data and analyze how certain protocols are operating within a particular network architecture.
Also from a methodology standpoint, performance tuning is the process of using workload characterization measurements gathered from a protocol analyzer and using the statistics for the purpose of tuning a specific component of a LAN/WAN environment. It is always the goal when performing a network baseline study to ensure stability, reliability, and enhanced performance within a particular internetwork architecture.
Before an analyst can tune a specific network topology, such as a Fast Ethernet or ATM network topology, the analyst must understand the particular topology specifics. Chapter 7, "LAN and WAN Protocols," covers the exact protocol analysis methodology that should be applied to a specific LAN/WAN topology or protocol environment when performing a network baseline study. The reader should refer to these chapters to truly understand the required methodology for analysis within a specific topology or protocol environment.
When performing a LAN/WAN baseline study, it is also important for an analyst to have the required skills to interpret the upper-layer protocols while performing a protocol analysis decoding exercise.
If an analyst is using a protocol analyzer on an Ethernet network that utilizes Novell servers, for example, the analyst should have experience in decoding Ethernet packets and Ethernet protocol layers within the Novell protocol suite, such as IPX, SPX, and NCP. This is just one example of the exercises an analyst may be required to perform. If an analyst were studying a 16Mbps Token Ring internetwork architecture with Windows NT Servers, the analyst might need to closely review the Token Ring packet for the general physical and header information as related to the Token Ring physical layer. The analyst would also need to understand the NT protocol suite within the packets captured in the applied baseline session. This would include protocols such as IP, TCP, NetBIOS, and Server Message Block (SMB). Chapter 7 discusses, among other things, how an analyst should review certain protocol environments such as the Novell NetWare protocol suite and the Windows NT protocol suite.
In summary, it is important for an analyst to understand that both the topology and the network protocol suite components combine to create a network architecture that should be reviewed in a network baseline study.
With that said, it is also important for the protocol analysis tool being used for the baseline study to be able to decipher the physical topology header information and display the information within a clear protocol analysis view. The protocol analyzer must also have the capability to provide an expanded, detailed decode of the particular protocol suite being analyzed.
In reality, protocol analysis is an art that must be used by an analyst when performing a network baseline study. To perform a network baseline study, an analyst must develop the required technical skill set to competently perform protocol analysis. After an analyst has developed a solid technical understanding of the LAN and WAN topologies and protocol suites that must be analyzed, it is next important that the analyst become inherently familiar with the process of troubleshooting and performing a network baseline study.
It is a given that developing the skill set and technical underpinnings required to engage protocol analysis and performance tuning requires time, and a methodical learning approach is needed to truly understand network baselining.
Before performing any type of network baseline study, an analyst needs to understand a specific protocol analyzer's use and operation. This chapter presents some of the general features available among the popular protocol analyzers. The analyzers have similar features. They enable an analyst to capture the data, display the data in different views, and also perform an analysis process (reviews) on the data in many different ways (based on the tool). Some protocol analyzers are more advanced than others; some even have artificial intelligence–based Expert systems that enable an analyst to immediately capture certain statistical data and to review result measurements on the data prior to even stopping the analyzer tool capture mode and decoding the information gathered.
Note also that some tools are rather rudimentary and only enable the analyst to capture the data and view it in basic form.
The discussion now turns to a brief description of a high-level methodology for protocol analysis and performance tuning, and then moves into an overview of some of the key industry tools. Chapter 4, "Quantitative Measurements in Network Baselining," and Chapter 5, "Network Analysis and Optimization Techniques," provide more detailed methodology and a description of the required steps for engaging protocol analysis and performance tuning.
A protocol analysis session requires specific steps considered basic to the function of capturing and decoding data packets during a LAN/WAN baseline session. These steps include the following:
Preparing the analyzer for data capture
Capturing the required data
Setting up the analyzer for proper display views
Decoding the data in the display view and reviewing data from a general analysis standpoint
Examining the data for key statistics
Checking the data for physical errors
Reviewing the data captured for general performance for end-to-end communications
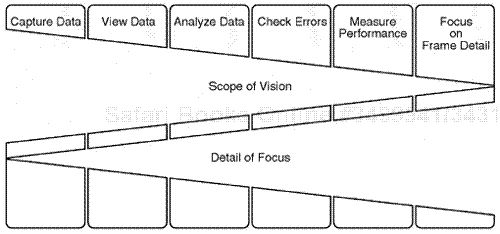
Focusing on problems in the data through further automated display feature views, such as filtering, triggering, time-structured mark setting, and setting other display features to isolate the scope of vision on the problem to a detailed level
The key to a highly effective protocol analysis is to get as much network data as possible to analyze. The analyst can do this by using a wide-spectrum horizontal approach as to a scope of vision. For the analyzer to capture relevant information, the analyst must apply certain filters and triggers (discussed later in this chapter). After the data has been captured and saved, the analyst must then concern himself with setting up the analyzer for a proper display view. The analyst must then, when a "good" view is attained, analyze the data and extract any key statistics, such as utilization, along with other metrics, such as physical problems or errors in the data. Overall, it is important that the performance of the baseline session be measured for general benchmarks (discussed in more detail in Chapters 4 and 5)(see Figure 3.1).
The last focal point of any network analysis session is to refine the protocol analysis session review process by closely examining any detailed information that may relate to the baseline study session or to the problem being analyzed. The key here is that at the end of the protocol analysis process, the analyst should be able to accurately focus on specific statistics, data, and any problematic issues.
During a performance tuning session, an analyst will most likely be reviewing a new device in the network, or a recent implementation or change. As discussed earlier, there is a strong emphasis when performing a network baseline to ensure that any new devices or products added to an internetwork are implemented properly in terms of configuration, design, and operation. This applies to hardware, software, and application components, and even to network operating system changes.
If a new router is implemented between two key locations, for example, a pre- and post-analysis method should be used. If the older router is reviewed with a pre-protocol analysis approach, the analyst can benchmark statistics such as frame-per-second forwarding rates, effective throughput forwarding rates, and various information related to how the preceding router provided connectivity and performance between two specific LAN sites. This "pre-baseline analysis session" should be saved. If the router is changed and a new router is implemented with a higher-performance criteria, the analyst can use performance tuning methodology to ensure that the router implementation is effected positively.
Several steps are considered basic to the methodology of implementing changes to a network and performing a tuning exercise with a protocol analysis tool. Some of the key steps include the following:
Perform a pre-analysis session on the network area prior to the change.
Perform a post-analysis session and review any details regarding statistical change that may be required.
Pinpoint any differences noted in statistics or trends in the data analysis session that may enable you to further identify issues in the trace and to fine-tune the configuration.
Identify any errors or problems that point to a required tuning step to improve performance.
Define and document the changes necessary to fine-tune the network analysis session.
Perform a configuration change by implementing new hardware or software or reconfiguring, as required, to implement the final change operation.
Perform an additional post-protocol analysis session to see whether the implemented changes are valid and effective.
Document, in detail, the findings from the pre- and post-analysis session.
In summary, if a new device such as a router is implemented within a network, an analyst can use protocol analysis to evaluate the new router and thereby fine-tune the network's performance. If the results from the first post-protocol analysis session show that the router is not forwarding the correct size frame, for example, the analyst can analyze the data, review any problems, and pinpoint an exact cause. The analyst can then reconfigure one of the router's parameters (if that is the cause of the problem). When doing so, the analyst might identify parameter changes that could enhance network performance in other areas (the data-forwarding rate, for example). He can document potentially favorable changes, implement them, and then review the data after the change(s). The final step is to document the final fine-tuning process (see Figure 3.2).
As noted earlier, an analyst needs a thorough understanding of the network topologies and protocols involved when performing a network analysis session. To be extremely effective in a complex internetwork environment, an analyst must have a full understanding of the following:
The LAN/WAN architecture involved. . This includes understanding the topologies and the associated protocol suites within the dataflow of the internetwork.
The correct approach for a network baseline session. . This includes protocol analysis methodology and performance tuning methodology. Chapters 4 and 5 detail the specific methods that an analyst should follow when conducting a network baseline session. However, a thread of information about network analysis methodology runs throughout this book. An analyst must keep in mind that a network baseline session requires a structured approach for each specific occurrence.
The protocol analysis and network baselining tools being used. . This includes an understanding of the basic function and operational modes of those tools.
The first two items are extremely important, because it is vital for an analyst to understand the LAN and WAN architecture of an internetwork, as well as to understand the steps required for a successful network baseline session. The easiest portion of the process is understanding the operation of a particular protocol analyzer.
Most protocol analyzers provide strong documentation online when using the analyzer, as well as a reference manual to assist with the tool's operation. An analyst should try to receive some training on the specific tool's operation. If an analyst knows how to use the analyzer, but does not understand the LAN architecture, topology, or protocol suite operations, or does not have a handle on the correct methodology, the analyst will most likely not be effective when using the protocol analyzer in a network baseline session. Again, understanding the specific tool operation is the easiest portion of the network baseline process. Such an understanding requires knowledge of how a protocol analyzer is configured.
The following is brief description of the basic components of a protocol analyzer.
Most protocol analyzers and network baseline tools are both hardware and software device platforms that enable an analyst to view data on a LAN/WAN. The protocol analyzer usually has a network interface card (NIC) that can physically connect to the LAN/WAN and create interconnection capability. In intrusive connections, such as WAN connections, the analyzer may have special cables, pods, or NICs that allow for a unique connection. The protocol analyzer usually has a special built-in NIC that interfaces with a specific suite of protocol layer decodes, which make it possible for the analyzer to interpret packets captured from the network. The protocol analyzer connects to the LAN or WAN topology point and functions as a separate node on the LAN or WAN area. When the protocol analyzer is activated for capture, it can capture all packets on the internetwork channel to which it is connected (versus just packets identified for a specific node). In other words, the device can operate in "promiscuous" mode and can captures all packets traveling across the LAN or WAN topology point where the analyzer is connected.
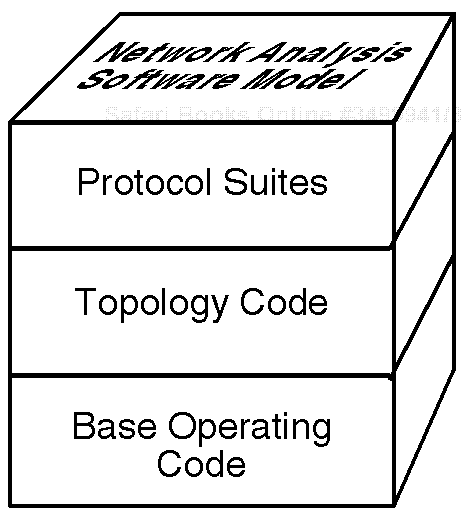
The NIC captures the packets and then passes data into an internal protocol-processing engine, which enables the analyst to quickly execute the "review decode" function and to display and review the captured data. Network analysis software models tend to be based on specific layer model designs. Most protocol analyzers include a base operating code along with a specific code for decoding certain data captured for specific topology and protocols. Most protocol analyzers, based on their design, vary as to their type of base operating code for the use of the analyzer—that is, the specific code that allows the analyzer tool to function.
The next important feature of a protocol analyzer to consider is its capability to look at a specific topology. Most protocol analyzers have a built-in NIC that allows connectivity to a LAN or WAN topology. One protocol analyzer might be configured with an Ethernet interface card or Token Ring interface card, for example, whereas another analyzer might be configured for WAN topologies. It is important to understand that the protocol analyzer, depending on its NIC configuration, will also have an associated code on the hard disk that allows for the topology packets to be interpreted.
Another area of importance in the network analysis software model for a protocol analyzer is the protocol suite decodes. These are the software module decodes that allow a protocol analyzer to properly interpret any of the decodes for protocol suite layers that can be displayed in the analyzer, such as IPX, SPX, or NCP in the NetWare suite, or IP or TCP in the TCP/IP suite.
The analyzer software modules work together to form the network analysis software model that works with the protocol analyzer hardware components, such as the NIC or the pod, that connect to the network. Again, the key network analysis software model protocol layers include the operating code, the topology code, and the protocol suite code (see Figure 3.3).
The main functions of most protocol analyzers used in a network baseline session are as follows:
Preconfigured capture setups
Active capture operation
Display setup and processing configurations
Detailed display features for focusing on data issues that involve complex schemes such as filtering or triggering
All protocol analyzers feature basic capture setup, active capture, display, viewing and decoding of a packet captured. Certain protocol analyzers are more advanced than others and have more features built in for general operation. Some of the more advanced analyzers even have Expert systems that provide automated review of statistics and data captured. Other protocol analyzers are rudimentary and just provide the actual data displayed onscreen.
Other more-advanced protocol analyzers display symptomatic statistics that enable an analyst to immediately identify a problem as data is being actively captured on the network. This is an enhanced view of protocol analysis and is built in to the more high-end analyzer tools, such as the Network Associates Sniffer, Shomiti analyzers, and the Wavetech Wandell Goltermann Domino line.
Most of the mid-range to more-advanced protocol analyzers provide detailed review and display features. Some of the main display and detail features include triggering and filtering.
Triggering is a technique that allows a protocol analyzer to start capturing upon the triggering of a specific event, such as when a specific workstation or server attaches to the LAN or WAN. In this case, the analyzer triggers upon this connection event and starts capturing data upon transmission from that device.
Filtering techniques are also available from the advanced protocol analyzers. Filtering enables an analyst to set up the analyzer in a precapture mode to filter out data types such as one particular protocol suite. Certain analyzers can also filter a specific protocol suite after the data has been captured, if properly set up prior to analysis. An analyst could, for example, set up a protocol analyzer to filter just on NetWare Core Protocol (NCP). In such a case, the analyzer would capture and save data for display related to the NCP suite only. No other data would be present in the final trace, if so set in a precapture mode for NCP. If the analyzer is set in a nonactive precapture mode, the tool could capture all the data, which could then be saved to disk. In this case, a post-capture display filter could provide for review of the NCP, and removal of the filter would enable an analyst to review all the other data in the captured trace.
When performing a network baseline exercise, triggering and filtering can be excellent aids. These steps are interlinked and described in detail in Chapters 4 and 5 (see Figure 3.4).
Note that cabling problems cause a high percentage of network problem symptoms. In the past, troubleshooting of a possible bad cable required many medium-testing techniques. Today most protocol analyzers provide internal testing features that engage a Time Domain Reflectometer (TDR) for testing the physical medium of the network area medium being studied. A TDR testing feature is a device mode operation within a protocol that can generate a specific signal on a LAN or WAN medium and then monitor the cabling medium for certain physical characteristics.
TDR testing modes are helpful for cause isolation when engaging a network baseline study related to physical problems that may be present on LAN and WAN media. Some TDR tools are separate, handheld devices; others are built in to a protocol analyzer.
This section describes some of the most prominent network protocol analyzers and network management tools relevant to a network baseline study.
Keep in mind that other tools are also available within most of the large internetworking environments and that an analyst can use these other tools in direct conjunction with a portable protocol analyzer. Because of the limited scope of this chapter, only a brief review of the key protocol analyzers is given. Note that some of the key network management systems for internetwork hub, switch, and router infrastructure also have built-in features that provide automatic baseline processes. Included among these management systems are tools such as HP OpenView, which can provide device status and discovery capabilities for topology review along with many other statistical metrics. Also available are internetwork hub management systems such as CiscoWorks, Cabletron Spectrum, and Bay Optivity. All these management systems have the built-in capability to provide assisted baseline statistic metric gathering and also may assist in the baseline study process.
In the late 1990s, the Network Associates corporation acquired Network General, a company that developed and produced the original Sniffer analyzer (well-known to the protocol analysis market). Network Associates has developed and released a series of technology enhancements related to operational features of the original Network General Sniffer product line.
The new Network Associates Sniffer Pro is an extremely powerful analyzer that provides for a cross-internetwork visibility of many issues that may affect a network topology and protocol infrastructure. The Sniffer Pro offers an intuitive capability to monitor data traffic on a network area as related to dataflow activity on a real-time basis (see Figure 3.5).
Many different statistics and metrics can be gathered in a detailed view, such as utilization, error statistics, individual node-by-node station statistics, and error rates. Historical monitoring is available for statistical metric views of utilization, protocol percentages, error rates, and other key statistics over a selected time period. Intuitive alarms are built in to the Sniffer Pro system. An analyst can set these for immediate identification and associated isolation of issues.
The Sniffer Pro analyzer can monitor a network and can also generate traffic on a real-time basis. With this tool, an analyst can evaluate response times and associated latency on the internetwork. The Sniffer Pro is built to operate on and take full advantage of the multibit-level Windows operating system features. The Sniffer Pro product has been fine-tuned so that it can be colocated and can coexist in core residency with other applications without any major issues occurring (as related to the capture capability of the tool or its operational performance). The Sniffer Pro is an extremely high-performance system that supports most main topologies, including Ethernet, Fast Ethernet, and Gigabit Ethernet, along with Token Ring engaging 4Mbps and 16Mbps data rates, Asynchronous Transfer Mode (ATM), and key WAN network analysis modes such as T1, Fractional T1, High-Speed Serial Interface (HSSI), and basic and primary ISDN networks.
In the near future, Network Associates will introduce Sniffer Pro connectivity for higher-speed broadband technologies such as SONET, and other key high-capacity and high-speed network product lines.
The Sniffer Pro platform offers two major features from a network capture standpoint: analysis and monitoring. These features are comparable to the original Network General Sniffer in that they offer monitoring and capturing capability.
In the monitoring mode, the Sniffer Pro has various screens that can be viewed quickly to gain an assessment of the internetwork traffic statistics and dataflow metrics.
The Sniffer Pro Monitoring view offers the following:
Dashboard view
Matrix view
Host table view
Protocol distribution view
History view
Global statistical view
Smart Expert screen
Physical layer statistics
Switching statistics
In a capture mode related to the Analysis view, the Sniffer Pro offers the following:
Real-time analysis for statistics produced by an expert artificial intelligence engine for true cause-and-effect isolation
Display features for reviewing data at a decode level for Summary, Detail, and Hex views
Host Table view
Protocol Distribution view
Matrix view
Statistical view
One of the key features of the Network Associates Sniffer Pro product line is that the tool provides simultaneous statistical monitoring from a full-spectrum viewpoint and, in direct correlation, the capability to immediately view the trace data captured that is producing the statistics in the monitor mode. This differs from the original Network General Sniffer product line, which separated the two products (such as Ethernet Monitor and Ethernet Analyzer). In today's Sniffer Pro product line, these processes coexist and can be operated in parallel, so an analyst can quickly transition between statistical views and data trace analysis views.
If an analyst requires Expert system capability assistance, the Sniffer Expert system decoding engine can be launched immediately to help isolate cause-and-effect issues.
The monitoring feature in Sniffer Pro enables an analyst to immediately review network load statistics, including a review of a percentage of utilization as related to general utilization, along with broadcast and associated frame and byte counts. Error statistics are available for most major topologies. When monitoring Ethernet, for example, the Sniffer Pro enables the analyst to quickly review CRC errors, long and short packets, fragments, jabber conditions, bit-alignment errors, and collision counts. For Gigabit Ethernet and Fast Ethernet conditions, CRC errors, code violation errors, jabbers, and runts can be quickly reviewed.
In a Token Ring environment, standard soft errors and hard errors can be monitored (such as a beaconing). The analyzer also enables an analyst to monitor ring purge counts and ring change events at the physical Token Ring MAC layer.
Protocol statistics are available for all major protocol suites. Individual stations can be monitored in a node-by-node mode, and packet-size distribution counts can be quickly monitored. All these features are integrated through a toolbar based on a Windows graphical user interface (GUI) in a monitor application window.
The Sniffer Pro dashboard feature is unique: It provides a real-time view of the internetwork traffic flow in a quick graphic display mode that shows packet-per-second count, errors per second, and utilization percentages. The gauge counters move quickly to show the actual changes as related to real-time traffic.
One of the key features in the monitoring process is the Host Table feature. The Host Table view offers an instant view of the LAN adapter statistics and metrics for each LAN network device active on the network. Physical addresses, network layer addresses, and application layer addresses can be quickly viewed. For high-speed platforms such as ATM, the host table shows a speedy view of the permanent virtual circuit (PVC) and switched virtual circuit (SVC) for ATM UNI and NNI connections. At the WAN level, virtual circuits can be viewed for Frame Relay, HDLC, and T1 connections (required for analysis review). The complete view is again integrated through a GUI.
One of the real benefits of the Sniffer Pro monitoring features is the matrix screen. The Matrix view shows real-time communications traffic flow from node to node across the monitored internetwork. An analyst can quickly view the matrix and associate the traffic map with actual real-time traffic occurrences back and forth across the internetwork. This view works for both LAN and WAN monitoring.
The Historical Sampling view available in the monitoring mode provides a rapid review of key samples, such as packet-per-second error rates, utilization, packet counts, broadcast levels, and physical error rates, along with packet-size indications from a historical standpoint.
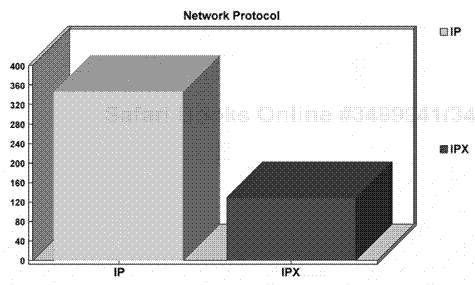
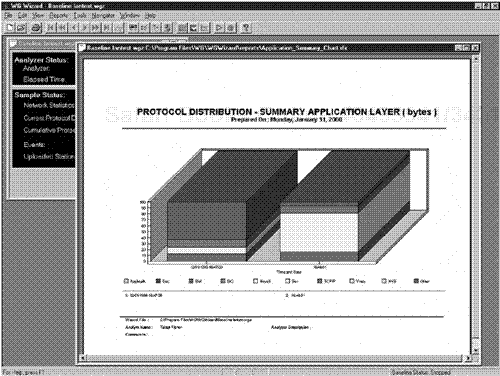
The Protocol Distribution view is extremely powerful because it covers such a wide range of protocols. Some of the key protocols supported are IPX, SPX, NCP, NCP Burst, IP, TCP, NetBIOS, AppleTalk, and DECnet. Sniffer Pro can decode the IBM SNA, NetBIOS, OS/2, IBMNM, SMB, Novell 2x, 3x, 4x, 5x, and 4x plus NDS decodes, XNS: MSNET, Banyan VINES, XNS, SUN:NFS, ISO, PPP, SNMP v.1 and 2, LAPD, Frame Relay, FDDI and FDDI SMT, DLSw, X Window, X.25, SDLC, and HDLC. Also supported are many of the process application layer protocols for the TCP/IP model such as FTP, TFTP, NFS, Telnet, SMTP, POP2, POP3, HTTP, NTP, SNMP, Gopher, X Window, and many other key protocol suites (see Figure 3.6). The key factor is that the protocol screen is extremely dynamic for viewing protocol percentages on an internetwork.
The Global Statistics screen offers a quick view of the statistics required for an analyst to understand some of the key general workload utilization measurements.
Some statistical display views called smart screens are also available for some of the high-speed broadband technologies such as ATM. With the ATM adapter interface, an analyst can quickly review cell traffic as related to cell type, cell frame counts, OAM cell types, and LMI cell types. This is an extremely dynamic process.
Physical layer statistics can be viewed on an ATM network for each device operating in a PVC- or SVC-established connection, along with error rates. You can also view the exact cell traffic–to–error counts as related to ATM physical medium.
During a WAN network physical layer statistic review, an analyst can review traffic from a DTE-to-DCE perspective, quickly and in a clear graphical table.
The Switched Statistic screen is one of the new features and is extremely useful when monitoring virtual LAN (VLAN) configurations and switching statistics in a high-speed channel Ethernet environment. Each switched module connected and configured by Sniffer Pro for review can be quickly monitored. The switch module status, the port status, the VLAN assignment, and the traffic rates in and out of each port assigned from the switch can be quickly monitored. Error statistics can also be quickly viewed.
The Sniffer analyzer also offers a set of complex alarm features that are extremely dynamic and assist in managing the overall alarms that are preset by the analyst prior to starting the baseline analysis review.
The Sniffer Analyzer enables an analyst to filter on network data when capturing and displaying by protocol via data pattern matching and addresses filtering. The Sniffer Pro offers excellent time-relationship data views that an analyst can trigger when capturing and displaying by external and internal pattern matching. The display features enable the analyst to view in both numeric and graphic formats. An analyst can configure multiple view windows to view the summary of packets, packet detail, and hex representation on the same screen.
The Network Associates Sniffer Pro is an extremely powerful platform that offers an automatic fault isolation and true-performance enhanced management for small to large internetworks. The Sniffer Pro high-speed analyzer can quickly enable an analyst to isolate issues and identify problems and make recommendations. It enables true visibility across multiple internetwork topologies and protocol environments.
Network Associates also offers a software-only analyzer called Sniffer Basic. The Sniffer Basic tool offers the main statistical screens and some basic decoding engines for certain protocols. It does not offer any real Expert analysis and does not enable an analyst to use certain high-end filtering processes for cause isolation and analysis featured in the Sniffer Pro tool.
The Sniffer Pro tool evolved from the original Network General Sniffer. Network Associates will be adding many features to Sniffer Pro on an ongoing basis, and will offer enhanced support for all product lines. The original Network General Sniffer is still used by many analysts. Because of this, the following brief presentation of some of the features in the original Network General Sniffer is offered.
The original Sniffer analyzer product family offered many different configurations, including portable analyzers and complex distributed Sniffer configurations. The portable analyzer was offered in three versions:
A preconfigured PC analyzer packaged in either a Compaq or Toshiba portable
A PCMCIA version for most compatible laptops
A NIC/software package for configuring the Sniffer Analyzer in a PC
The Distributed Sniffer System (DSS) supports the same analysis functions as the portable analyzer, but its main operation is to monitor an internetwork of distributed analyzers from a central-point console that inter-communicates with analyzers dispersed across multiple LANs. The DSS product line has three main components: SniffMaster Consoles, Sniffer Servers, and DSS application software.
The DSS Sniffer Servers are placed on different network segments as slave devices and continuously monitor the data and statistics for these segments. The DSS slave units communicate inband across subnetwork areas to the SniffMaster Console. The SniffMaster Console acts as a central client for main DSS server operations and gathers the dataflow and statistics from the Sniffer Servers.
The DSS hardware and software provide all the main Sniffer functions, but from a distributed view against multiple network areas. The Sniffer DSS data can be imported into a Sniffer and RMON combination, which allows for cross-platform views with SNMP management systems such as HP OpenView.
The original Sniffer supported most major protocol suites. The original Sniffer main menu option included a traffic-generation feature and a cable tester. The traffic-generation feature enabled an analyst to load a network with traffic. The cable tester operates as a TDR.
The original Sniffer offered a software module separate from the main Sniffer protocol analyzer software known as the Sniffer Monitor. The module's main purpose was to monitor and display vital Token Ring or Ethernet network statistics. Displays were available for Station Statistics, Transmit Timing, Error Statistics (including CRC, collisions, and TR hard and soft errors), Protocol Statistics, Packet-Size Statistics, Traffic History, Routing Information, Reporting Writer Tool, and Alarms Indicator. The Routing Path was a unique feature that could show the location and percentage of packets routed through a multiple Token Ring environment, in relation to each ring (see Figure 3.7).
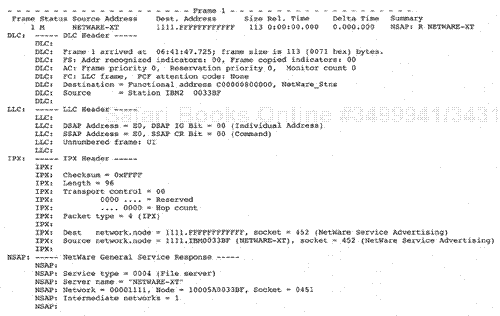
The original Sniffer then allowed analysts to quickly launch a separate program known as the Sniffer Analyzer. The original Sniffer Analyzer offered most of the capture, decode, and analysis display views as the new Sniffer Pro, but was mainly based on a DOS engine. The original Sniffer Expert system assisted an analyst with automatically locating problems on a network and offered advice on resolving particular network issues or problems. This system has been significantly enhanced in the new Sniffer Pro product line to offer an integrated data view of real-time statistical issues, along with direct hotkey mapping of error occurrences to real data (see Figure 3.8).
The Sniffer Analyzer's strengths are clearly the expanded range of support for all major network topologies and protocol suites.
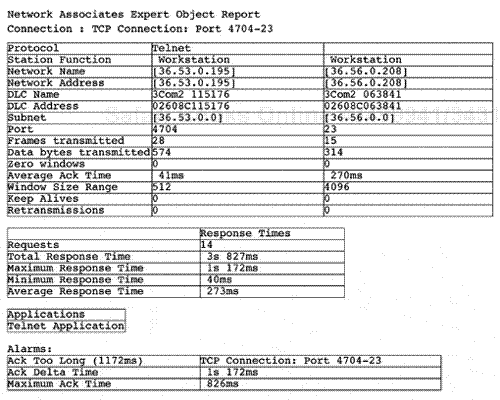
The built-in Expert system capability to isolate issues on-the-fly and help an analyst identify the cause of network problems is a significant plus because of the accuracy, along with the online Expert help system that is available to an analyst. The Sniffer Pro report-generating features are excellent for creating network baseline data reports. Almost all the network statistics gathered with Sniffer Pro can be quickly viewed in multiple windows and then fed directly to the reporting engine and also can be printed in various standard formats and fed into most major PC third-party applications for management reporting (see Figure 3.9).
The Shomiti Systems Inc. network analysis tool company offers an excellent palette of network analyzers and monitoring tools for small, medium, and large internetworks.
One of the key tools that Shomiti has introduced is a Windows platform analyzer called Surveyor. Surveyor offers the capability to monitor an internetwork quickly through the Windows platform. Real-time analysis display views are available for multiple topologies. Surveyor can sample and enable an analyst to review network physical layers. The tool also provides decoding capabilities for a multiprotocol layer model, including all seven layers for many major protocols. There is also an artificial intelligence analysis engine Expert module built in to the system, called the Expert module for Surveyor. This system offers automatic problem detection capability for network issues. The Expert module enables a network analyst to be quickly notified of any issues that may require further decoding and corrective actions via cause analysis. The Expert system works dynamically with the main Surveyor analyzer engine and enables an analyst to quickly associate problems and issues to actual data trace internals captured with the Surveyor tool. The symptoms can be reviewed on standard LANs and on VLAN systems (see Figure 3.10).
Many unique symptoms can occur on a network. Because of this, the Surveyor Expert system enables an analyst to isolate physical issues and transport retransmission issues as well as application layer communication problem-based issues. These are just some of the symptoms that can be quickly identified with the Shomiti Surveyor analyzer. The analyst can then engage a filter to quickly move to the trace analysis data area where the problem may be present.
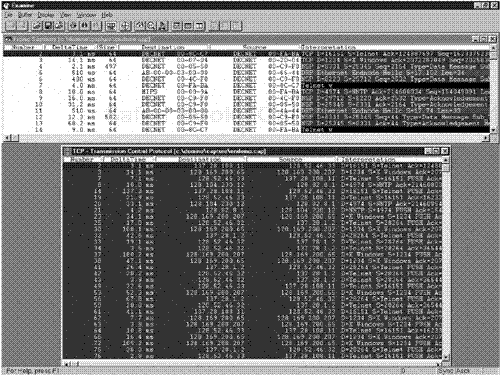
The main Surveyor analyzer engine supports most of the main physical LAN topologies, such as 10Mbps and 100Mbps Ethernet, and 4Mbps and 16Mbps Token Ring. A real-time monitoring capability enables an analyst to gain statistical views of utilization, frame-per-second rate counts, protocol percentages, and error-rate statistics for all the key topologies. The main Surveyor analyzer platform has many display views in the statistical mode comparable to other tools. The Surveyor offers Protocol Distribution views, and Host Table views are available for node-by-node associated statistics, along with multiple upper-layer decoding capability for key statistics. In summary, the Shomiti Surveyor statistical mode enables an analyst to quickly view statistics such as utilization and frame-size distribution, protocol distribution, physical MAC layer statistics, network layer statistics, and application layer statistics, along with the top transmitters and receivers at the physical, network, and application layers (see Figure 3.11).
The Surveyor product line supports a full range of protocols. For a list of these protocols and further manufacturer information, refer to Appendix B, "Reference Material." For the purpose of general discussion, the Surveyor tool supports full MAC layer data investigation for all major Ethernet frame types, Token Ring frames, and other key suites such as the PPP suite and the Cisco suite. At the network layer and transport layer, the IP layer is supported, along with the TCP layer. The analyzer engine also supports the IPX, SPX, and NCP protocols and all other protocols in the Novell suite.
The Microsoft Windows NT layer can be monitored for SMB Plus, SMB, and CIFS, along with MMPI. All process application layer protocols are available for decoding and viewing, including the TCP/IP DOD model for TCP/IP, such as SNMP, TCP, Telnet, TFTP, UDP, UNIX, Web, NFS, XDR, XDM, MCP, X Window, and UNIX Remote Services. The Surveyor application database processes can be reviewed for the Oracle suite, such as TNS and Sybase. Other key protocol suite decoding is supported, such as AppleTalk, DECnet Phase IV, the IBM protocol suite including SNA, NetBIOS, and NetBEUI, along with the Banyan VINES suite. The Surveyor analyzer supports decoding for application suites including cc:Mail and Lotus Notes. All these decodes are available for display view via network analysis within the seven-layer model.
The Surveyor tool also offers an automatic traffic-generation capability that is used as a module, called the Packet Blaster Engine. The Blaster Engine offers advanced traffic-generation capabilities that allow for an immediate traffic stream to be generated from the NIC in the Surveyor analyzer. Data traffic patterns can be created in a unique and custom format by an analyst and then sent outbound for generation onto the network. This feature should be used only when proper planning as to analysis and traffic-generation exercises are engaged in predeployment testing and in the process of troubleshooting (but always in a careful manner). The Packet Blaster is inherently designed to enable an analyst to capture a file off the network and can replay the precaptured traffic file back in simulated real-time fashion against the network. This enables a user to create certain test scenarios for application testing and characterization that can also be used for predictive modeling in an application environment. Certain network physical issues can also be isolated through generating traffic and reviewing any effects on certain network devices via the Surveyor monitoring analysis engine.
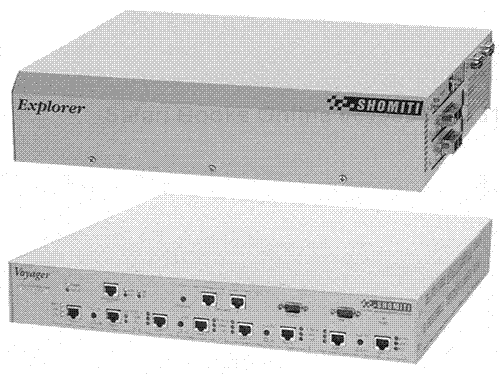
The Shomiti company also offers extremely high-speed platforms that make it possible to capture data at high data rates through certain additional hardware-partner tools, such as the Shomiti Explorer. The Explorer is a hardware platform system that interconnects to the main analysis engine.
The Explorer system is a hardware platform that can be deployed throughout the internetwork in various areas or can be mounted in a main computer room rack. The Explorer system has a form factor approximately the size of a standard rack-mounted platform. The system can connect to a 10Mbps, 100Mbps, or Gigabit Ethernet medium and allows for automatic sensing and detection of data rates. This tool enables an analyst to rapidly deploy the Explorer in any specific area of an Ethernet internetwork, and then to remotely review data and statistics that the Explorer captures. The Explorer can connect to multiport and single-mode fiber connections and offers full- and half-duplex interconnection schemes. A network analyst can quickly use the Explorer for a real-time view of high-speed broadband transfer on Gigabit Ethernet channels. As noted, the Explorer can be deployed across the internetwork at certain points and then the Explorer can be activated to connect to the medium. When connected to the medium, data and statistics are transmitted through the Shomiti Surveyor engine for analysis and monitoring.
Another key tool offered by Shomiti is the Voyager platform. The Voyager platform is a separate hardware and software platform tool that allows for RMON1- and RMON2-compliant monitoring capability for both full- and half-duplex 10- and 100Mbps Ethernet LANs. This tool is a separate device with a form factor that again can be mounted in a standard rack or physically placed throughout an internetwork configuration. It offers an immediate synchronized view of half- and full-duplex Ethernet channels and can also monitor Fast Ethernet channel environments such as in the Cisco platform. It can automatically configure host tables and has multiport-capturing capability. The Shomiti Voyager platform is based on a silicone-accelerated multiport RMON2 engine and is extremely capable of keeping up with the high-speed data rates on the internetwork. It is built on application-specific integrated circuit (ASIC) technology and can filter the real-time line rate. Monitoring ports are available on the main platform for 10/100Mbps Ethernet, along with external taps that can be utilized as required.
The Shomiti product line also offers a seamless product purchase capability to acquire Shomiti Century taps, which have been available for quite some time. These taps allow for interlink taps of uplinks and key channels in networks for 10BASE-T Ethernet, 100BASE-TX Ethernet, and Gigabit Ethernet. The taps enable seamless interruption of traffic flow, so an analyst can monitor key network traffic channels such as intermediate distribution facilities (IDF) or user closet areas to main distribution facilities (MDF) or main computer rooms uplinks that cannot normally be interrupted for analysis.
Wavetek Wandel and Goltermann(W&G) has been a long-time leader in the protocol analysis tool marketplace. W&G is well known for its robust protocol analysis engine tools such as the DA30 protocol analyzer. The DA30 tool has been used heavily for several decades by network product manufacturers for protocol analysis along with end-market enterprise protocol analysis.
In the 1990s, W&G also developed a product line for protocol analysis that was more geared toward the corporate enterprise in terms of network support: the WAVETECH Wandel and Goltermann Domino. W&G has enhanced the Domino product line with many intelligent features for the end user, such as the Domino Wizard, which creates automated reporting capabilities for network baseline purposes.
W&G has introduced the WAVETECH Wandel and Goltermann Mentor, which is an artificial intelligence Expert-based system designed to guide a network analyst through protocol analysis exercises. W&G also offers lower-end analysis tools to clients who may not have a requirement for high-end platforms. This product line includes the W&G LinkView Pro analyzer.
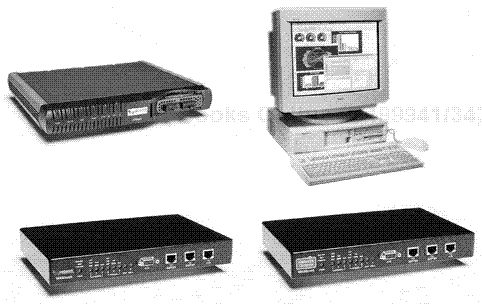
The following is a brief description of some of the products that Wandel and Goltermann offers to the networking industry (see Figure 3.12).
It should be mentioned that Wandel and Goltermann recently merged with Wavetek, and the new company is now known as Wavetek Wandel Goltermann. The company is headquartered in the United States out of Research Triangle Park, North Carolina and also has international primary offices in Germany.
The Wandel and Goltermann Domino DA30 product line is not heavily discussed in this chapter, because it is mainly geared toward the higher-end market—that is, the manufacturer product line for analyzing networking devices such as routers, switches, and other key devices. Specifically, product manufacturers use the DA30 tool because of its high-end capability to test products before release.
The Domino analyzer product is a small, portable device that really fits the end-user market in the enterprise internetwork support area. The tool form fits a normal laptop size and can just fit underneath the laptop. The Domino analyzer can interface directly with a personal computer at the parallel port on a specialized cable. Specific software is loaded from the Domino interface analyzer software family that allows applications to run and Domino to display key statistics along with network traffic decodes. The Domino is the actual protocol analyzer and links to the network interface, such as a Token Ring network and Ethernet 10/100 or Gigabit Ethernet LAN. The Domino analyzer is a pod unit, which then interfaces with a PC laptop and directly links through a parallel port to the PC's Windows interface. Within the Windows interface, an analyst can view captured data and monitor traffic statistics, examine decodes, and also transmit network traffic.
The Domino analyzer platform enables an analyst to view key statistics such as utilization, protocol percentages, error rates, and other key station-by-station statistics relative to traffic flow in the internetwork. The W&G Domino interface, as it relates to the GUI operations of Windows, enables the user to quickly move through the Domino analyzer functions.
The base Domino software offers the following key modes of operation:
Monitor
Capture
Examine
Transmit
The analyzer monitor screen allows for a comprehensive review of all key statistics, such as the Domino analyzer main status as to its operation, along with network statistics for utilization, frame count, and other key workload statistics. The protocol distribution pie chart gives the analyst a quick view of protocol percentages. There is also a frame-size area graph that illustrates frame-size distribution. In Monitor mode, internetwork traffic flow can be reviewed for all key workload characterization measurements. In the Domino Capture mode, an analyst can configure and start the Domino for active capture of data live from the network or from a precaptured file. The Examine mode enables an analyst to view a summary breakout of packets along with Detailed and Hex view. The Examine view provides many different display views of patterns of particular data and protocols.
In the Examine mode, an analyst can quickly stop the Monitor mode and go directly into a trace review of all frames that were captured. All the main protocol layers can be reviewed, from the physical layer through the application layer model. Hotkey filtering systems are available along with strong filtering systems that allow for extraction or internal inclusion of frame types or specific field data types. In addition, automated applications can be run on network analyzers via a toolbox bar from which specialized W&G tests can be engaged on a live network. The Domino offers a result data trace to be captured and imported into a common separated value (CSV) file format, and then data can also be imported into spreadsheet charting programs such as Excel and Lotus. The tool also has built-in reporting macros that can be engaged for unique baseline and statistical charting.
The Domino supports Standard, Fast, and Gigabit Ethernet. Different Domino pods can be purchased, depending on the end-user requirements. If all standard Ethernet types are required, one specific pod can cover the complete interconnection scheme. The Domino product line also supports analyzer pods for Token Ring, 4/16Mbps, FDDI, most major WAN network types, and other major network interfaces. There is also a Domino product platform for ATM interconnection analysis.
A notable factor is that the Domino platform is portable so that the actual Dominos can link together and then link into the PC. This enables multiple Domino sessions to be run simultaneously and viewed in one PC through the Windows interface, such as Ethernet and ATM (thus, the name Domino). There are restraints, however, related to the PC configuration and how it should be built to handle multiple Dominos running simultaneously. Most of the processing is actually done in the Domino physical engine, but, for the record, the actual PC platform is also critical as related to memory and processor speed to allow multiple sessions to run simultaneously.
As mentioned earlier, the Domino product line introduced the Domino Wizard in the 1990s. This particular tool is excellent for monitoring an internetwork from a baseline perspective. Automatic baseline statistical view capabilities can be stored in a database and then saved to different formats, such as a CSV file. Automatic reporting features are also built in to the tool; an analyst can use these tools to automatically chart generation for historical baseline requirements. An analyst's efficiency increases by monitoring and baselining a network with just one tool. An analyst can actually decode and baseline a network at the same time!
An analyst may also decide to use another tool on the same segment to complement the baseline study, such as the Domino Wizard. The wizard can be used for charting the network from a historical standpoint. Key workload characterization measurements can be charted, such as utilization, frame rate, broadcast rate, multicast rate, and physical error rate. The analyst can then decode the traffic using another analyzer in a correlating fashion. It is possible to use the Domino Wizard in direct correlation with the standard Domino Examine software and simultaneously perform active decoding of data while charting a network with the wizard product. One concern is that at times, this type of process may cause a gap in the overall charting method, depending on how configurations are applied in the PC running the Domino Wizard and Examine software. If everything is fine-tuned in the PC configuration, it is possible to use the tools at the same time and perform one baseline with the tool in a seamless fashion.
The Examine software engine in the Domino allows for performing LAN traffic analysis against the decodes for all the main protocol layers. The Examine decode engine offers an internal decode quick-filtering capability for more than 225 protocols based on the W&G examine engine. Quick filters are available for protocols, patterns, and station addresses, and protocols can be reviewed from multiple topology types. The protocol suite support is widespread; the following protocols are some of the key types included: 802.3 MAC, 802.5 MAC, LLC, LLC2, TCP/IP, UDP, OSPF, TFTP, SMTP, SNMP, Telnet, FTP, PPP, ARP, IPX, SPX, NCP, ISO, HDLC, SDLC, SMB, SNA, QLL, NetBIOS, Sun, DECnet Complete, X.25, Frame Relay, S.75, LAPB, LAPD, Cisco, AppleTalk Complete Suite, VINES, XNS, and SMDS.
Wandel and Goltermann offers other tools that allow for statistical analysis review, such as LinkView Pro. LinkView Pro provides an automated capability to examine traffic with the combined W&G examine engine, but also enables an analyst to gather immediate statistics through key tools such as discovery topology map features. The LinkView product allows the topology map to be discovered quickly and for statistics to be built for metrics on the network being analyzed. The result is a network analyzer platform that allows for statistical measurements at the same time that a network analysis is being performed. Traffic analysis statistics are available via station audit discovery and protocol distribution, top traffic generators and receivers, along with historical long-term statistics for all key protocol layers including the TCP/IP protocol layers (see Figure 3.13).
The W&G Mentor product is an interactive Expert analysis system that allows for automatic artificial intelligence review and detailed analysis of data in an immediate drop-down mode. The W&G Examine decode engine can be reviewed at any time when running Mentor. The key factor is that when symptoms occur on the network, the interactive W&G Mentor can pose a question to an analyst, such as whether the network is operating properly or whether there is a performance problem. Depending on the answer provided by the analyst, the W&G Mentor, which runs under a Windows GUI, can in most cases offer an immediate recommendation related to traffic analysis indications based on the live capture in conjunction with the analyst's answers to the automated questions that were posed (see Figure 3.14).
The W&G Mentor offers immediate diagnostic capabilities that enable an analyst to find a specific area that may need to be worked on further through a detailed analysis. From a quick analysis standpoint, an analyst can engage W&G Mentor and quickly answer a series of questions, start a statistical analysis session, and forward through a major and minor symptom map to a specific area that may be causing a problem. The W&G Mentor helps an analyst to quickly focus on the issues at hand within the network traffic analysis session.
One of Domino's key positive points is the separate processing engine designed into the separate hardware unit.
Today, many manufacturers are moving away from hardware. W&G appears dedicated to supporting a separate hardware platform for the capture and analysis of data, which allows for processing data on high-speed network topology links without loss of any packet during traffic analysis. The product line also offers a very user-friendly interface with true multitasking network baseline monitoring features and real-time data analysis (see Figure 3.15).
The Novell software LANalyzer product is a software analyzer that can analyze Ethernet and Token Ring LANs. The LANalyzer runs under Windows. The tool allows for monitoring and analyzing data traveling on an Ethernet and Token Ring LAN. Traffic can be analyzed for troubleshooting and for network baselining reasons.
The LANalyzer offers strong monitoring features for statistical metric views. The LANalyzer has a screen that presents a graphical view of frame-per-second rate, utilization, and errors. The screen is called the Dashboard. It runs in a gauge-type format and provides an analyst with a rapid view of key network statistics. This feature enables an analyst to see problems when they start to occur. The Dashboard is excellent for gaining an initial view of the main workload characteristics. Further review can be performed against specific stations by querying stations for statistics as related to individual data flow on a node-by-node basis. Metrics can be obtained and displayed as views of network traffic, such as packets per second, broadcast rates per second, and multicast rates.
The LANalyzer also provides a Display mode screen that presents individual station statistics: the Station Monitor. An analyst can capture data and stop the analyzer to review the internal trace data. The decode screens are fairly simple to engage. The data captured can be viewed in a Summary mode, Decode mode, or full Hexadecimal View mode. The LANalyzer software requires a robust platform. It is recommended to use a high-end PC with a high-level memory configuration. Only certain types of NICs are compatible with the software.
The LANalyzer for Windows versions include a full decode palette for all major protocol suites, but is biased toward the Novell NetWare suite. Support is available for other suites, such as the TCP/IP protocol suite, AppleTalk, and others. Certain third-party manufacturers offer sets of extra decode software modules that can be added to the core engine and can be used for protocol suites that Novell is not currently offering.
The LANalyzer software also offers a scaled-down reporting engine. Statistics can be viewed in the detailed packet window, and historical legends can be configured for utilization over a specific time period. This information can be imported into third-party spreadsheet charting applications. Most data files that are captured can also be saved into a CSV file format. One of LANalyzer's strengths is its built-in capability to perform rapid physical layer analysis in both the Ethernet and Token Ring LAN environments. The tool's internal capability to filter on individual stations makes it somewhat comparable to certain hardware analyzers. The LANalyzer is an analyzer that offers a cost-efficient way to quickly view data and statistics on a network that usually can only be viewed through more sophisticated protocol analyzers.
Hewlett-Packard has released many different analysis tools, along with other test equipment. The HP Network Advisoris a standalone platform unit based on RISC architecture and is still used for protocol analysis in many networking environments. The HP Network Advisor is a high-performance tool that engages RISC-based hardware architecture, enabling an analyst to capture data quickly on high-speed media and review the data in a technical format that is intuitive as to problem resolution.
The Network Advisor product supports most major LAN and WAN topologies. Most major protocol suites are supported, including IBM SNA, NetBIOS, Novell, TCP/IP, Novell, Windows NT, DECnet, 3Com, and XNS.
The Advisor main menu presents subdisplay menus for access to the Advisor Control, Config, and Display Setup. The Network Advisor presents key workload characteristic statistics in unique gauge-type displays that change based on real-time dynamic traffic cycles.
The Network Advisor engages a unique feature for artificial intelligence systems called the Finder Expert System. This feature dynamically analyzes captured data from an analysis session and then presents an analyst with recommendations to resolve issues based on cause analysis. This system enables an analyst to focus on the symptoms that are occurring while still allowing the data analysis capture to continue. This process enables an analyst to rapidly locate the cause of network problems more efficiently.
The Optimal Software company has introduced one of the more revolutionary analysis and network management products available today. With the amount of application deployment now affecting the internetwork community, it is important that applications be critically monitored.
Because applications are being deployed at such a rapid pace and are deeply impacting networks, it is important to understand how applications are deployed from a predeployment standpoint, and it is critical to ensure that they are properly planned for deployment. Such an understanding enables an analyst to determine whether the network is available to support the application and whether network adjustments are required.
We can also quickly evaluate whether the application needs to be fine-tuned to apply for a proper performance level on the internetwork from a planning standpoint. Even in situations where the application has been deployed, and we are in a post-review phase related to reactive analysis, problematic issues require rapid cause analysis.
Optimal Software has introduced a tool that allows for immediate isolation of critical issues (see Figure 3.16).
The discussion now focuses on a general review of one of the main Optimal products: the Application Expert.
Application Expert is a unique tool because it allows for a rapid capture and data review of application traffic models across key internetwork points. The Optimal Application Expert system can monitor network application performance and application events at a rapid but concise and technically competent level. The platform is built on a multiple data-analysis engine system that includes multiple views of application traffic flow in very unique ways. Some of the key views involve very innovative screens that enable an analyst to isolate issues rapidly.
One of the key views is called an Application Thread. This particular view enables an analyst to capture an application trace via another network analysis platform, such as the Network Associate Sniffer, or directly from the Optimal Application Expert tool. The Optimal Expert system platform NIC can be configured to capture the traffic directly off the network. The Optimal Expert Threading System view feeds the trace analysis results from a packet trace and processes the binary data into an application thread. The thread can be defined as a sequence of application events that occur on the network.
If a packet trace is captured via the network analysis platform or Optimal Application Expert, for example, there may be 50,000 frames or 100,000 frames. One of the key features is that the Optimal Application Expert can actually interpret all the frames and display the simple events that occur as related to application dataflow. For example, 100,000 frames may break down to only 10 or 20 main application events. This is a very unique view and makes it possible to determine how application data movement is affecting the internetwork.
One of the key features is that when the actual thread is identified (such as a read file call from a workstation to a server for an Oracle database), the application threading tool shows the device addresses at the physical or network layer, along with the number of data in bytes and packets that are moved in transmission, along with the amount of time and latency for a server turn time and workstation turn time, and network transmission time. These are just some of the views that can be quickly displayed via the Thread Analysis screen display and report.
The thread analysis report integrates with a Bounce Diagram view in the Application Expert tool. The Bounce Diagram view enables an analyst to make an immediate assessment of the timing measurements and the gaps involved in traffic bursts. If a client sends a specific packet across the internetwork, for example, the time that it took to send that packet can be quickly viewed, and the behavior of the overall event as related to the application thread can be cross-correlated. The Bounce Diagram view is integrated with the actual Application Threading screen. The bounce diagram also offers an immediate view of traffic efficiency, and any inefficiency is identified in certain colors. Actual traffic types and direction of traffic can be quickly viewed in timing modes.
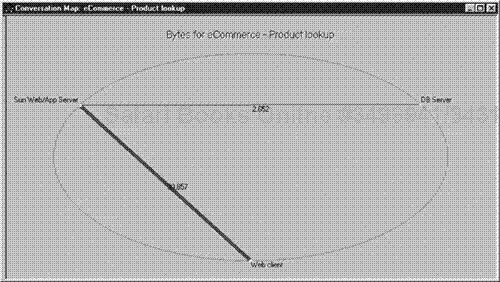
Another important feature is the conversation map. The conversation map is a unique view of how dataflow occurs from an application standpoint from one node to another across an internetwork. During an application analysis, analysts may have a general understanding of the application dataflow from one device to another. When a data trace is actually fed into the Optimal Application Expert or captured from the Expert tool, however, the analyst may be surprised to find that the conversation map is showing another view as to exactly how data is flowing.
On communication from a client to a server, for example, an analyst may also discover many other servers are quickly contacted and briefly reviewed. It is also possible when running data-trace analysis results into the Optimal application conversation map that an analyst can quickly see the servers that are being contacted at other sites that he was not aware of prior to viewing the conversation map.
This allows for an immediate understanding of how data flows through an internetwork from point to point. This is an extremely useful tool from a general network analysis review standpoint and from a reporting perspective.
Note that if excessive traffic is captured with the Optimal Application Expert, the conversation map can be edited so that only those devices relevant to the analysis process can be viewed.
The tool offers other key features, such as a direct view of a packet trace. At the present time, the packet trace works up through the network layer area only, but it will most likely be enhanced in the future to include multiple layers and offer true trace analysis capabilities. At this time, it is quite easy to use another network analyzer such as the Network Associates Sniffer, take a data capture, and then feed the data trace into the Optimal Application Expert. It is also possible to directly capture a packet trace from the Expert system. The key factor is that an analyst, by using the Optimal Application Expert, can quickly review a trace analysis screen for packet trace data and then quickly cross-view the actual application threads that occur. The analyst can then quickly transition to the conversation map and view the dataflow that actually occurred with the application events as packets traveled through the internetwork when the application was captured.
Other features of the Optimal Application Expert include the following:
The payload versus overhead screen
The response-time analysis screen
The time plot screen
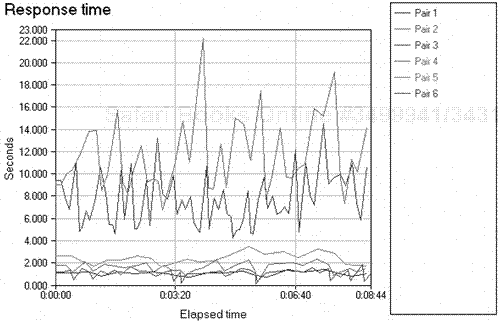
In the payload versus overhead screen, an analyst can quickly separate data frame overhead and protocol overhead from actual data payloads. This is a very useful screen from a graphical and reporting viewpoint. The Expert tool can also offer response time analysis, where the response time can be monitored right down to the timing metrics of an actual application event. Time plots can also be produced on a historical basis. The key is that the response-time analysis graph allows for rapid review of application traffic on a node-by-node basis, and then the client-to-server network time can be quickly cross-correlated.
All these features work together to produce an awesome capability to visualize network traffic from an application standpoint, and to visualize how the application threads are actually occurring on the network. The threads are the events that actually take place related to the main application data transfer on the internetwork. Network analysis is also a unique way to look at data-trace applications through the processes noted in this book as application characterization (see Chapter 4). Note, however, that the Optimal Application Expert enables an analyst to quickly identify application threads and event cycles that take place on a dynamic basis. By quickly reviewing the thread process, sometimes a more simplistic determination can be made of what is actually occurring with the application data movement.
The Optimal Application Expert correlates and works with another tool called the Application Preview. The Application Preview product allows for a streamlined view of predictive modeling related to application deployment.
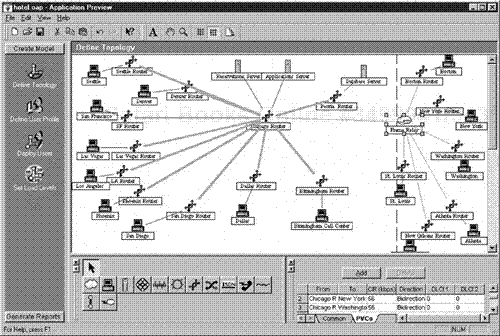
An analyst can use Application Preview to design a topology for an area where an application will be deployed. The analyst would use certain features of the Application Preview to perform this task. The first task for the analyst would be to build the topology map. This would include using automated icons from Preview, such as network segment, router, or switched devices. After the topology has been built, an analyst then would build a user profile. The user profile would allow an analyst to decide how many types of users would be deployed and where they would be deployed against the topology that was built. The user profile building process enables an analyst to decide what types of user profiles will be using a certain application data file and what types of tasks will be performed. By using the automated feature, the profile can then be built. The analyst can then take Preview and deploy the users across the internetwork. To do so, the defined user profile step along with the deployed user step requires an import of the trace data that is going to be deployed. This is where Application Preview interfaces with Application Expert. The trace is taken from Application Expert or a Sniffer file, and then is cross-threaded into Application Preview. The steps in "deploy user profile" create an automatic step to perform this exercise. In the deploy user phase, the analyst actually deploys the users against the topology that is performance, once the user profile is established. At this point, the traffic analysis results from the application capture via Application Expert are being applied against the topology that was built and the user profiles that were designed.
The final step is to perform a reporting process and set load levels on the internetwork being used for predictive modeling. To do so, the analyst must determine capacity load levels on specific segments of the topology that was built for the Application Preview process. After the load levels have been set, the analyst can then run reports related to capacity and timing latency that are required in the preview process.
The reports that are run allow for WAN recommendation views of the target load levels, the current bandwidth, the recommended bandwidth, and the background load. Capacity reports also allow for determining a resulting load level, a target load level, and the current bandwidth assessment. This enables an analyst to build a topology, identify a user group, characterize traffic and import traffic, and deploy traffic against the topology model. This process enables the analyst to then produce a predictive assessment of what the traffic loads and the resulting latency issues may be for deployment (see Figure 3.17).
An analyst can cross-thread final result information from Preview back into Application Expert to produce an application assessment and predict user response times. The analyst would normally take the capture from the Application Expert system and thread Application Expert results into the Application Optimal Preview. After the topology map and user profiles have been built, the analyst can then identify the application usage and apply it against the topology and user groups created. The user groups then can be assigned against the geographical or logical areas of the topology. Then the analyst can specify final load values. In a final view, the bandwidth recommendation and capacity reports can be run and then cross-threaded back into the Optimal Application Expert to understand final latency and response time effects on the internetwork (see Figure 3.18).
In summary, this tool is extremely powerful for high-performance application deployment predictive modeling and application assessment, in both reactive and proactive network baseline exercises (see Figure 3.19).
Compuware Software has introduced the EcoSCOPE product line. The EcoSCOPE product line is an extremely intuitive platform that enables an application analysis engine to work in a master monitoring mode via a high-speed probe that can be placed in the internetwork. The product line offers a probe based on a physical PC platform device that usually utilizes a high-speed platform such as a Compaq server. The high-speed computer platform is engaged with a specialized internetwork interface card to act as probes. The probes can be placed on the inbound or outbound uplinks or channels of major local and wide area network points within a complete internetwork infrastructure.
The EcoSCOPE platform is based on a Super Monitor operational feature tool that works with Windows NT–based software operating systems. The EcoSCOPE product allows for immediate analysis of data traffic and discovery of devices, protocols, and application traffic statistics. The Super Monitor can monitor all key statistics that are required for workload characterization measurements, such as utilization, protocol percentages, and other key error statistics. The highlight of this tool is that it offers integrated application review traffic capability for application response times, transaction times, and throughput between different key areas of the internetwork.
The Super Monitor can be configured remotely or internally on both exterior and interior edges of an internetwork for monitoring multiple probes. In other words, the probes can be placed in LAN-based uplink channels or at WAN network points, and the EcoSCOPE Super Monitor can view the devices remotely. From a single view, the topology map can be quickly built and reviewed, and point-to-point traffic ratios can be monitored as to how protocols are flowing from one point to another.
The EcoSCOPE monitoring feature offers an immediate view where the topology will be displayed onscreen in a logical format and can be discovered on an ongoing basis. The tool offers techniques that can highlight actual application traffic flowing from one point to another. That traffic will continue to show updates, and graphic, colored views are available to see the traffic patterns from one point of a local or wide area network to another. This enables an analyst to quickly identify, for instance, where a TCP is flowing across an internetwork, or even where a certain application such as Lotus Notes is flowing across an internetwork. By clicking on the automated application monitoring screen within EcoSCOPE, an analyst can collect data from the network, review the reports quickly, and zoom in on a certain traffic application dataflow sequence. This is possible because the EcoSCOPE line intuitively picks up the application data movement by watching actual well-known application calls.
After the application call has been identified, an analyst can click on the call sequence and actually see the real-time data movement across the network topology, and can associate the actual response time of the application between two specific points. The application response time can be monitored to see how servers and workstations are responding, and what kind of internetwork latency may be present. The transaction time for the application can also be monitored, so an analyst can quickly use EcoSCOPE to monitor transaction response times for specific applications and even database movement such as Oracle, Sybase, and Microsoft SQL.
This is a very popular analysis tool because of the need to truly understand application behavior upon networks and how application deployment affects the internetwork from an impact standpoint, capacity analysis, and performance optimization standpoint.
EcoSCOPE can monitor all major protocol platforms and suites, including Windows NT, 3Com, AppleTalk, Banyan VINES, DECnet, ISO, NetBIOS, Novell NetWare, SNA, XNS, TCP/IP, and many other traffic types (see Figure 3.21).
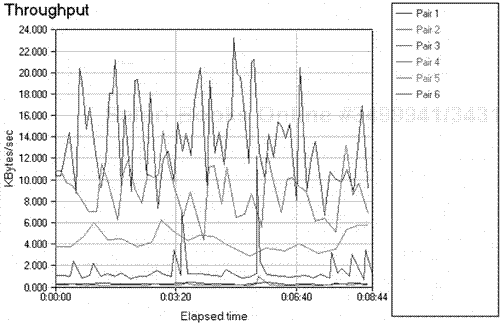
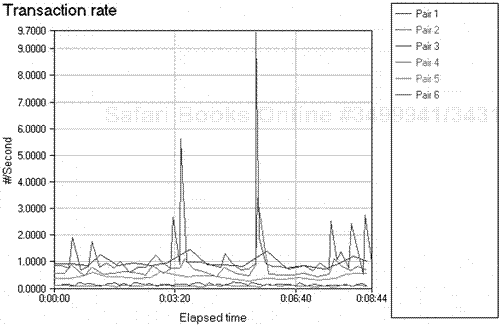
Ganymede Software Inc. has introduced a unique product called Chariot. This tool is designed for immediate performance analysis measurements across network end-to-end points in distributive networking environments. Specifically, the Chariot software offers a component called the Chariot Console. The Console software component would load on one particular device within a networking environment, and Chariot End Point could then be loaded on another device within the same networking environment.
The Chariot Console could be loaded in Segment 1, for example, and the Chariot End Point could be loaded on Segment 2. If Segment 1 and Segment 2 are connected by a switch or a router, the Chariot Console could communicate with the Chariot End Point across the Ethernet Segment 1, over the router, and then communicate on Segment 2 to the actual endpoint. The devices communicate with each other on an end-to-end conversation mode for certain traffic analysis output requirements.
The Console is the main program interface to the overall Chariot system. It is where the actual tests are created and the monitoring software resides to start the test operation and to provide the traffic analysis. The endpoint is the actual point that communicates back to the Chariot console. Note that there can be multiple endpoints, as discussed later.
A quick test can be designed where a certain type of traffic pattern can be generated from the Console directly to the endpoint. The endpoint would then respond with communication via the traffic generation test. Specifically, the test mode would normally be described in the product line as a test script. The test script is a small traffic pattern similar to normal application traffic in the market.
One specific traffic pattern could be a platform such as Lotus Notes, for example. The general Lotus Notes operation has specifically been built into a defined test script mode. It can then be executed from the Console to the remote endpoint. The endpoint would then provide communications back and forth based on the script. The Console would collect statistics that would be valid for the purposes of the output of the use of the product. The main output modes include response time, transaction time, and throughput time for the Lotus Notes script. These variables are excellent from an overall performance testing standpoint.
The main reason the Chariot platform is so powerful is that it allows for an immediate view of response time, throughput, and transaction time related to the type of test script that is generated.
There are many open possibilities for using the Chariot tool during a network baseline study. An analyst could place different endpoints throughout the network infrastructure and place the Console in one key point (for instance, the main computer room) during the network baseline study. By running the scripts simultaneously or consecutively, an analyst could determine the throughput, response time, and transaction time output across each point of testing. This could enable the analyst to understand latency and overall performance between different IDF closets within a network enterprise infrastructure.
There is also the capability to load multiple endpoints within one specific area. In this case, an analyst could test multiple stations against other key stations within one specific IDF domain.
For example, this would allow for testing of older stations as compared to newer workstations that just received a memory upgrade. The response time, throughput, and transaction times should be higher on the newer workstation platform. Ganymede Software offers the Chariot product line multiple node count packages that include 10 to 500 nodes and higher in custom packages. This tool can obviously be used in a major simulation for application predeployment rollout as related to network topology design.
The program is fairly quick. It also allows for multiple test scripts to be run; these are already preconfigured by Ganymede. Over 500 tests of predetermined common scripts, such as Lotus Notes, Novell, and NT-based scripts, are already available to run. The tool can also capture a trace analysis session related to a specific application and, through a certain binary conversion process, create a test script that is actually similar to the application that is going to run. This makes immediate predictive modeling analysis possible and enables the analyst to use the tool in the application characterization mode.
The Chariot tool allows for a quick operation where the Console program is started. A specific IP address is configured into the Console. One or more endpoints are configured with IP addresses at different points within the internetwork. Either a script is launched from the predetermined scripts loaded in the program, or an analyst may modify certain variables in the scripts as required. The analyst starts the test, and the script activates whether the console will communicate to each one of the endpoints across the internetwork channels. After the tests have been completed, the analyst can view the results and the summaries, such as the throughput, transaction, and overall response time screens. The data can be saved in different modes, enabling viewing of the data in HTML format or in other spreadsheet programs such as Excel or 1-2-3 (see Figure 3.20).
The output test screens are excellent. They allow for an immediate view of transaction, throughput, and response time testing modes. In relation to the actual throughput testing mode, an analyst can look at throughput on an average between the Console and endpoint pairs, along with a minimum throughput and a maximum throughput. A confidence interval is applied by Ganymede Software up to a 95% level, along with a relative precision and final measured time. The transaction rate can also be monitored for average, minimum, and maximum, along with confidence interval, measure time, and relative precision. The response-time measurement also offers an average, minimum, maximum, and a confidence interval and relative precision measurement (see Figure 3.21).
The key factor is that all these output screens can actually be viewed in graphical format for multiple traffic portions of the overall script. This enables an analyst to quickly view the output from a visual standpoint.
Note also that these are excellent attachments for a network baseline study. By reviewing response time and throughput alone, an analyst can cross-map these output metrics to the procedures discussed in Chapter 4 under workload characterization measurements (see Figure 3.22).
Note that Ganymede Software also offers a remote monitoring tool that works with the Chariot Console and End Point software, called Pegasus. Pegasus is more of a remote monitoring network analysis center monitoring tool, which would be used by a remote control center monitoring multiple Chariot operations being tested throughout several enterprise sites.
For more information on the Chariot product line, refer to Appendix B, "Reference Material."
The Antara company recently introduced a product line that offers the capability for testing Fast and high-speed Ethernet products and associated traffic links in both the manufacturing and corporate environment. The Antara product line was originally designed for the network testing process and large networking product manufacturer environments. The product suite was developed by the original founder of Kalpana, which was acquired by Cisco Systems in 1994.
The Antara product line is a strong testing tool for today's high-speed medium topologies and includes a major platform called the Port Authority GT. This tool is a device and simulation test tool used quite frequently in the manufacturing test environment. The tool can also be used in the corporate enterprise environment. The tool is an enhanced product line switching matrix tool that allows for automatic traffic generation and data capture from high-speed Fast Ethernet channel and Gigabit Ethernet channel links. The tool can be used for burn-in and traffic generation of switches, and hubs with internal capabilities that operate via its automated monitoring software to burn in network product platforms prior to release to the network industry. This would include network Ethernet switches and other key Ethernet high-speed interconnection channel hub devices. The product can also be used in the corporate environment by network implementation teams to test switches prior to rollout.
The Port Authority GT utilizes a five-slot chassis with an integrated Pentium server. Users can plug in a keyboard, mouse, and monitor to directly control the GT. The GT supports a port capacity of up to 32 10/100 Ethernet ports that can be either UTP or fiber. User security is optional. The GT provides many internal test features to enable an analyst to configure traffic patterns. The engineering engines that engage the traffic generation mode are based on powerful ASIC technologies. Each port can capture and generate traffic at wire-speed. By engaging custom onboard processors, the Antara products enable an analyst to create, generate, and capture results based on policies for specific traffic types.
Although the Antara Port Authority GT product line is designed specifically for product manufacturing environments, it also allows for quality assurance in the corporate enterprise environment (see Figure 3.23).
Antara also offers a Port Authority IT product line, which is more of a growth-geared testing solution that can be used for online response-time analysis and traffic analysis straight from the Ethernet link. It is now quite common to see the Port Authority IT product and the GT product used in the corporate enterprise environment as staged within an Ethernet uplink. In this particular case, the tool can be used to test Ethernet uplink network channel links from a traffic monitoring and traffic generation standpoint using gigabyte Ethernet tools (see Figures 3.24 through 3.26).
The tool can be used to test Ethernet uplinks between IDF and MDF areas, along with testing the products that provide the uplinks, such as the main Ethernet switches within the platform. Overall, the product line offers a way to rapidly and accurately test Ethernet switches on end-to-end channel operations, along with Ethernet uplinks for true integrity within the data transmission capability mode.
The Antara tools also offer a passive monitoring capability via the passive-fiber monitoring points that enables an analyst to quickly insert a protocol analyzer such as a NAI Sniffer or other key tools such as Compuware's EcoSCOPE monitoring tool. This allows for passive monitoring in the case of an Ethernet uplink within a corporate environment. The GT and IT Tap Module minimizes a loss of signal by regenerating the signal into mirrored operations. Even if the Port Authority product were to lose power, the passive board could continue monitoring, enabling an analyst to continue completing a baseline mode.
The Antara product line is an excellent platform to assist in staging an actual network baseline study. Its accuracy and technical test features provide a nonintrusive way to sample high-speed networking channels and also concurrently test main site networking product platforms such as Fast and Gigabit Ethernet switches that interconnect main network areas.
This network monitoring tool product line is considered a partial protocol analyzer and a TDR. Fluke Corporation offers a handheld meter that can function as a Layer-1 physical testing tool and a Layer-2 and -3 analysis tool. The instrument is based on a platform that enables an analyst to gather and view network statistics for a LAN, including such things as errors, network utilization, broadcast levels, node-by-node utilization factors, and protocol percentages. Naming features are supported for address-to-name mapping. This feature is useful when troubleshooting is required when analyzing multiple network segments.
The Fluke meters are full-blown TDRs that also enable an analyst to gain a comprehensive view of the cabling infrastructure while still monitoring certain valuable statistics from Layers 2 and 3 of the protocol model. This portable tool is helpful for network implementation projects and rapid reactive network baselining, and is also excellent for field troubleshooting of network issues.
The two previous chapters defined network baselining and the required goals to engage a proper study. This chapter has presented how a network protocol analyzer is composed, along with descriptions of some of the key platforms used for analysis when performing a network baseline study.
Remember that many of the tools can be used individually or together, depending on the required output of the baseline study. The next chapter presents the methodology and steps required for an analyst to understand how to effectively use the tools presented to perform a network baseline study.

