
Chapter 19
Five Things You Need to Know about Neuromarketing Studies and Measures
In This Chapter
![]() Seeing how good experiments work
Seeing how good experiments work
![]() Understanding validity and reliability of neuromarketing metrics
Understanding validity and reliability of neuromarketing metrics
![]() Looking at what reverse inference is and why it matters
Looking at what reverse inference is and why it matters
![]() Knowing what statistics to expect in neuromarketing studies, now and in the future
Knowing what statistics to expect in neuromarketing studies, now and in the future
![]() Appreciating how normative data connects neuromarketing to real-world business decisions
Appreciating how normative data connects neuromarketing to real-world business decisions
Whether you’re planning a neuromarketing study of your own, interviewing a neuromarketing vendor, or just discussing neuromarketing around the water cooler, this chapter covers five things you need to know to be a smarter consumer of neuromarketing and, if necessary, a smarter critic:
![]() You need to be able to judge the quality of experimental designs.
You need to be able to judge the quality of experimental designs.
![]() You need to be clear about what the metrics are actually measuring.
You need to be clear about what the metrics are actually measuring.
![]() You need to understand the problem of reverse inference, and how it is being addressed.
You need to understand the problem of reverse inference, and how it is being addressed.
![]() You need to know how much to trust the findings, which means you need to understand how statistics are being used.
You need to know how much to trust the findings, which means you need to understand how statistics are being used.
![]() You need to know if and how normative data is being used.
You need to know if and how normative data is being used.
These are all big topics, and our goal in this chapter is not to make you an expert in any of them. Instead, we focus on a few key tips for each topic, and provide just enough detail so you can understand why the topic is important, how it impacts the quality of neuromarketing studies, and what best practices you should be aware of — for a single study, for a neuromarketing vendor, or for the field of neuromarketing as a whole.
Experimental Design: Identifying How Good Experiments Work
Experimental design is not a familiar topic for many first-time neuromarketing research buyers, because most market researchers have a background in survey research rather than experimental research. To assess the quality of a survey, most market researchers know exactly where to look: at the representativeness of the sample, at the question wording, at the order of the questions, and so on. What are the equivalent key points for assessing the quality of an experimental design? Here are some guidelines.
Three questions every good experiment must answer
In any neuromarketing experiment, you should be able to quickly and easily answer three questions about the design:
![]() What is the response being measured? Also called the dependent variable, the response is the outcome being measured by the experiment. In a neuromarketing experiment, you want a response that has clear business implications: What do consumers choose? How do consumers’ behaviors change? How do consumers’ preferences change?
What is the response being measured? Also called the dependent variable, the response is the outcome being measured by the experiment. In a neuromarketing experiment, you want a response that has clear business implications: What do consumers choose? How do consumers’ behaviors change? How do consumers’ preferences change?
 Be cautious about neuromarketing studies that have a response variable that occurs only in people’s minds. For example, suppose a study measures “attention to advertising” as its response variable. What are the business implications of high versus low attention for a particular ad? As we show in Chapter 11, attention may be more or less desirable depending on the style of the ad. In contrast to this pure state-of-mind response, a behavioral response such as “likelihood to buy the advertised product after watching the ad” has stronger business implications.
![]() Who are the subjects being studied? The subjects of the study are the sources of the response. In neuromarketing, the subjects are usually consumers with some kind of relationship to a brand or product. What’s most important in neuromarketing studies is how the population is defined and whether the subjects are effectively drawn randomly from that population. Often, the study is about how responses vary by subgroups within a population, such as men versus women, loyal product users versus switchers, or older consumers versus younger consumers. These groups must be defined before subjects are selected, so the right number of subjects is recruited and assigned to each subgroup to be compared in the experiment.
Who are the subjects being studied? The subjects of the study are the sources of the response. In neuromarketing, the subjects are usually consumers with some kind of relationship to a brand or product. What’s most important in neuromarketing studies is how the population is defined and whether the subjects are effectively drawn randomly from that population. Often, the study is about how responses vary by subgroups within a population, such as men versus women, loyal product users versus switchers, or older consumers versus younger consumers. These groups must be defined before subjects are selected, so the right number of subjects is recruited and assigned to each subgroup to be compared in the experiment.
In a neuromarketing experiment, it should be clear how subjects are recruited and why they represent a good random sample of the population of interest. If the sampling is biased, results from the experiment can produce faulty generalizations when applied back to the target population.
 A common problem with neuromarketing studies is self-selection bias. Because people who are willing to climb into a functional magnetic resonance imaging (fMRI) machine or have an electroencephalography (EEG) cap put on their heads tend to be more adventurous than average folks, this can bias the results for a study in which people who are more or less adventurous may respond differently. Be sure to discuss sample selection criteria with your neuromarketing partner.
![]() What are the treatments being applied? Also called the independent variables, treatments are the different interventions applied to subjects that do or don’t generate different responses. In neuromarketing studies, the treatments are usually exposures to different marketing stimuli, like different versions of ads, packaging designs, or in-store displays.
What are the treatments being applied? Also called the independent variables, treatments are the different interventions applied to subjects that do or don’t generate different responses. In neuromarketing studies, the treatments are usually exposures to different marketing stimuli, like different versions of ads, packaging designs, or in-store displays.
In a neuromarketing experiment, the treatments need to be designed in a way that maintains equivalency on aspects of the treatments that are not being studied. If one ad is played at a high volume and another is played at a low volume, for example, that’s a violation of equivalency that can bias the results. We cover a number of potential issues of this kind in Chapter 20.
In a well-designed experiment, identifying these three elements and how they interact should be easy. In particular, look for anything that can introduce bias into the results. An experiment with a fuzzy or weak response, a biased sampling procedure, or treatments that don’t properly hold constant other influences that can impact the subjects’ responses will yield misleading results no matter how skillfully conducted.
Knowing what to let change and what to hold constant
The logic of an experiment revolves around the idea of variability (how the responses differ for different combinations of treatments and subjects). Experiments are designed to partition (divide up) that variability into three separate sources: One is the source of variability you want to measure; the other two are sources of error (that is, variability you want to control or minimize). Asking questions about how variability is handled in an experiment is another good way to assess the quality of an experimental design. Here are the three sources of variability:
![]() Variability in the response due to different treatments: This is the variability you want to see. If you’re testing whether memory is activated differently by two ads, for example, you want to see if one ad clearly activated more memory than the other.
Variability in the response due to different treatments: This is the variability you want to see. If you’re testing whether memory is activated differently by two ads, for example, you want to see if one ad clearly activated more memory than the other.
![]() Variability due to how the response is measured: This is called measurement error, and it’s a source of variability you want to minimize. If your memory measure is not very accurate, for example, you’ll pick up differences in responses that are due not to the treatments, but to measurement error.
Variability due to how the response is measured: This is called measurement error, and it’s a source of variability you want to minimize. If your memory measure is not very accurate, for example, you’ll pick up differences in responses that are due not to the treatments, but to measurement error.
![]() Variability due to the experimental process: This is another source of variability you want to minimize. It comes from how the experiment is conducted. For example, suppose you do testing in two rooms, one of which is very cold and the other of which is very hot. You may get different results due to which room was used. That is variability due to experimental process.
Variability due to the experimental process: This is another source of variability you want to minimize. It comes from how the experiment is conducted. For example, suppose you do testing in two rooms, one of which is very cold and the other of which is very hot. You may get different results due to which room was used. That is variability due to experimental process.
Neuromarketers’ skill at controlling variability due to experimental process can be a major point of differentiation. Especially for sensitive measures like EEG, fMRI, or biometrics, it isn’t easy to get comparable results across tests performed in different locations, by different technicians, using different equipment. Vendors able to minimize variability across these conditions do so by rigorously standardizing procedures, facilities, and training. If you want to do cross-cultural or global testing, this can be an important consideration when comparing neuromarketing partners.
Although you always want to minimize variability due to measurement and experimental process, you can never eliminate it. Whether this is a serious or manageable problem depends on the kind of variability you’re dealing with. Figure 19-1 illustrates two types of error that have very different implications for the outcome of an experiment.
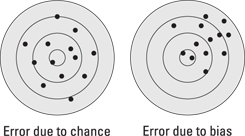
Illustration by Wiley, Composition Services Graphics
Figure 19-1: Error due to chance versus error due to bias.
Error due to chance is manageable because it’s equally likely to go one way or another. In the long run, if you take enough measures, the errors will cancel each other out and, on average, you’ll get a good estimate of the true underlying value (the bull’s-eye, in the target on the left). Error due to chance can’t be eliminated, but it can be controlled by random assignment of subjects to treatments and having a large enough sample size.
Error due to bias is much more troublesome. In fact, it can be disastrous because it can move the whole experiment off center, as illustrated by the target on the right. Bias is systematic (not random) error that is uncontrolled because, most of the time, you don’t know it’s there. It’s stealth error that fools you into thinking you have an accurate answer, even though you don’t.
Good experimental designs have explicit safeguards against error due to bias. Beyond any individual experiment, metrics and measurements need to be tested to assess their level of measurement error, and experimental procedures and practices need to be standardized for consistency to minimize experimental process error.
These are not the kinds of efforts that appear in research reports, but they’re fundamental to ensuring that neuromarketing results (or any research results, for that matter) can be trusted as a basis for decision making.
Three rules of thumb for designing good experiments
Good experimental design comes down to three rules of thumb:
![]() Isolate the effects of interest. Define as precisely as possible the responses, treatments, and subjects you want to measure. If the experiment involves multiple treatments, be sure you measure them both separately and together so you can disentangle their effects later on.
Isolate the effects of interest. Define as precisely as possible the responses, treatments, and subjects you want to measure. If the experiment involves multiple treatments, be sure you measure them both separately and together so you can disentangle their effects later on.
![]() Control what you can. Hold extraneous variables constant whenever possible. Make treatments as similar as possible except for the elements you want to compare. Minimize unwanted sources of variation, whether in measures or experimental process.
Control what you can. Hold extraneous variables constant whenever possible. Make treatments as similar as possible except for the elements you want to compare. Minimize unwanted sources of variation, whether in measures or experimental process.
![]() Randomize the rest. For potential sources of error you can’t control, use random assignment and selection to even out the unwanted effects. Randomly assign treatments to subjects, randomly select the order of treatment exposures, randomly assign subjects to testing rooms and equipment, and so on. This will allow any random errors you’re unable to control to cancel each other out as the data is collected.
Randomize the rest. For potential sources of error you can’t control, use random assignment and selection to even out the unwanted effects. Randomly assign treatments to subjects, randomly select the order of treatment exposures, randomly assign subjects to testing rooms and equipment, and so on. This will allow any random errors you’re unable to control to cancel each other out as the data is collected.
Measurement Theory: Understanding Validity and Reliability
In neuromarketing, an inescapable fact is that the metrics are a lot more mysterious than the metrics marketers are used to in traditional research. Everybody has a pretty good idea what the metric called day-after recall means — it means, “This is what people remember the day after they see an ad.” But what does memory activation mean? A neuromarketing vendor might say it means “increased activation of theta band activity in the medial frontal cortex while watching an ad,” but what exactly does that mean?
Luckily, there is a branch of research methodology that deals with questions like this, called measurement theory. Although this can be a deep topic for researchers, the basic principles are very accessible and can help you think about, and ask intelligent questions about, the metrics and measures you encounter in neuromarketing.
Measuring the right thing and measuring it right
Measurement theory looks at the quality of metrics along two dimensions:
![]() Validity: The extent to which a metric measures what it says it measures. It answers the question, “Are you measuring the right thing?”
Validity: The extent to which a metric measures what it says it measures. It answers the question, “Are you measuring the right thing?”
![]() Reliability: The extent to which a metric performs similarly in similar circumstances. It answers the question, “Are you measuring it right?”
Reliability: The extent to which a metric performs similarly in similar circumstances. It answers the question, “Are you measuring it right?”
To understand validity, you need to understand the idea of a theoretical construct. A theoretical construct is an idea about something that exists in the world. For example, in this book, we talk about attention, emotion, processing fluency, and many other ideas. These are all theoretical constructs. They can’t be measured directly. So, we measure things we can measure, and hope they actually measure the construct we’re interested in. If they do, we say they’re valid measures (or if we want to sound very scientific, we say they have good construct validity).
This may sound hopelessly abstract, but it’s not that difficult to assess the validity of a neuromarketing metric. Consider a metric called “attention.” If it’s a valid measure, it should produce a higher score when someone is doing something that we believe ought to draw more attention (based on our understanding of the theoretical construct), such as watching a car chase in a movie, and produce a lower score when someone is doing something that ought to draw less attention, such as watching cows grazing in a meadow. This ability to discriminate between different levels of the theoretical construct is called discriminant validity.
A valid measure of attention should also produce the same or similar results as other measures of attention, such as an eye-tracking measure, a heart-rate measure, or a self-report of attention (because attention is a conscious response). To the extent it does so, we say the metric has convergent validity.
Because neuromarketing metrics are somewhat obscure by nature, reputable vendors should have available lots of examples of both the discriminant validity and convergent validity of their metrics. We recommend going over these examples in detail with your neuromarketing vendor so you’re sure that its metrics are measuring what you want to measure in your experiment.
Reliability can best be understood in terms of repeatability. If you’re “measuring it right,” then you should get the same answer every time you measure the same thing. For example, if two samples are drawn from the same population and exposed to the same stimulus in the same experimental conditions, the results should be very similar (with differences due only to random error). Repeatability is the key characteristic of a reliable metric.
As with examples of validity, reputable neuromarketing firms should be able to show you examples of the reliability of their metrics. We recommend reviewing these examples in detail before establishing a relationship with a neuromarketing vendor, because they provide an excellent indication of the overall quality of the vendor’s practices and capabilities.
The Holy Grail of measurement theory, in neuromarketing as in any other field, is generalizability. A metric can be considered generalizable only if you have good reasons to believe it will produce both the same answer and the right answer in a comparable future circumstance. As shown in Figure 19-2, generalizability requires both validity and reliability.
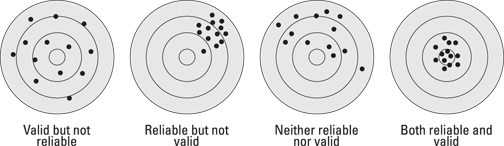
Illustration by Wiley, Composition Services Graphics
Figure 19-2: Validity, reliability, and generalizability.
The four targets in Figure 19-2 illustrate the four possible combinations of validity and reliability. Imagine that the dispersion of holes is subjects’ measured responses in an experiment in which the “true” response is the bull’s-eye. Here is how the four patterns relate to generalizability:
![]() Valid but not reliable: This combination is not generalizable because it contains too much random error. It’s likely to miss the right answer the next time because of noise in the metric. Because the error is random, an invalid-reliable metric is relatively easy to fix with larger sample sizes (large enough to allow the random errors to cancel each other out).
Valid but not reliable: This combination is not generalizable because it contains too much random error. It’s likely to miss the right answer the next time because of noise in the metric. Because the error is random, an invalid-reliable metric is relatively easy to fix with larger sample sizes (large enough to allow the random errors to cancel each other out).
![]() Reliable but not valid: This combination is not generalizable because it’s not aimed at the right answer. It hits the target reliably, but it’s reliably wrong. This metric may appear to be a good measure if validation testing hasn’t been done, which makes it particularly dangerous. It’s not possible to fix a reliable-invalid metric unless the source of the systematic bias is identified and corrected.
Reliable but not valid: This combination is not generalizable because it’s not aimed at the right answer. It hits the target reliably, but it’s reliably wrong. This metric may appear to be a good measure if validation testing hasn’t been done, which makes it particularly dangerous. It’s not possible to fix a reliable-invalid metric unless the source of the systematic bias is identified and corrected.
![]() Neither reliable nor valid: This combination is not generalizable because it’s aimed at the wrong answer, which it usually misses. With so much going wrong, this combination is very hard to diagnose and fix.
Neither reliable nor valid: This combination is not generalizable because it’s aimed at the wrong answer, which it usually misses. With so much going wrong, this combination is very hard to diagnose and fix.
![]() Both reliable and valid: This combination is the only one that hits the right answer and does so reliably, which means it’s most likely to hit the right answer the next time as well. A metric that has passed both reliability and validity tests is most generalizable — from sample to population, and from present to future.
Both reliable and valid: This combination is the only one that hits the right answer and does so reliably, which means it’s most likely to hit the right answer the next time as well. A metric that has passed both reliability and validity tests is most generalizable — from sample to population, and from present to future.
Improving the validity and reliability of neuromarketing metrics
Failures of validity and reliability can be traced to one or both of the “unwanted” sources of variability in an experiment: measurement error or experimental process error. Each of these sources, in turn, can be of two types: error due to chance (random noise) or error due to bias (systematic error). So, we have four leading causes of poor validity and reliability: measurement noise, experimental process noise, measurement bias, and experimental process bias.
A basically valid metric that is unreliable due to random noise can be improved relatively easily by increasing sample size. Because the errors are randomly distributed around a valid center, they’ll cancel each other out in a large enough sample, revealing the true value of the underlying theoretical construct. If the source of the noise is the experimental process, reliability can also be improved by tightening up experimental procedures to produce less noise in results.
A metric suffering from error due to bias will definitely be invalid and may be unreliable as well. Because bias produces systematic error rather than random “noise,” it can’t be managed by increasing sample size.
If the underlying problem is measurement bias, there is probably a mismatch between the metric and the theoretical construct it’s meant to measure: The metric is indicating that the construct is either present when it’s not or not present when it is. The solution is usually to refine the metric with additional measures that can better identify the construct in those conditions where the original metric fails.
If the underlying problem is experimental process bias, then the only solution is to identify and fix the source (or sources) of bias in the experimental process. If the biased process is basically reliable, then the metric is going to be reliably invalid. As noted above, this is a dangerous combination.
For example, suppose an experimental process is found to be systematically, but very reliably, overestimating the amount of attention devoted to TV ads. An examination of the experimental procedure reveals that every ad is always preceded by an instruction “Please pay close attention to the following video.” This instruction may well be biasing people’s responses, causing them to pay more attention to ads in the experiment than they would when viewing ads at home (where no such instruction appears). The solution is to remove the instruction and see if the attention metric becomes more valid.
If the experimental bias produces metrics that are neither valid nor reliable, there isn’t really much to be done. Such a situation is largely hypothetical, because it’s hard to imagine a neuromarketing company staying in business with metrics that were both invalid and unreliable.
Reverse Inference: Connecting Brain Measures to States of Mind
The challenge of reverse inference has been discussed among academics mostly in the context of fMRI, but it applies equally to any methodology that attempts to connect measures of physical body and brain states (like facial expressions or electrical activity in the brain) to states of mind (like attention, emotion, or a decision to buy a product).
The point critics make about reverse inference is that it isn’t a valid logical inference, which is to say, it isn’t logically true by definition. For example, here is a true-by-definition forward inference:
All men are mortal.
Joe is a man.
Therefore, Joe is mortal.
A reverse inference might be:
Jane is mortal.
Therefore, Jane is a man.
This is not logically valid because it assumes, incorrectly, that
All men are mortal.
Therefore, all mortals are men.
All men may be mortal, but it does not follow logically that only men are mortal. In fact, Jane represents the error in this inference. Some mortals are women.
What does this have to do with neuromarketing? Academic brain science (the kind that gets published in academic journals) progresses largely on the basis of forward inference — that is, scientists create an experiment that induces a particular state of mind as a treatment, and then measure a particular brain or body state as a response.
For example, in an fMRI study, scientists might randomly assign people to a sad-movie treatment or a funny-movie treatment to induce emotional states of sadness or happiness. Then they compare activations of regions in the brain for subjects in the two treatments, and infer whether activation in a certain brain region (a brain state) is associated with sadness or happiness (a mental state). That is forward inference.
But an applied science, like neuromarketing, operates in the opposite direction. The researchers don’t know beforehand what mental state a particular treatment is going to induce, because that’s the question they want to answer. So, they look for brain or body states that have been found previously, in academic studies or in their own research, to be associated with a particular mental state. If those brain or body states are present, they infer that the mental state is probably present as well. That is reverse inference. In our fMRI example, researchers would be using reverse inference if they concluded that, based on activation of a region of the brain associated with happiness, the movie was probably inducing happiness.
We want to be very clear that reverse inference can go horribly wrong. The degree to which it can go wrong is directly proportional to the number of other brain states that a given brain or body state can be associated with. If this key piece of information is not somehow built into the reverse inference, you can end up with ridiculous conclusions like the iPhone example discussed in Chapter 16: Just because the insular cortex activates when you think about romantic love, and it also activates when you think about your iPhone, does not mean you are in love with your iPhone. In fact, it’s very unlikely to mean that, because the insular cortex has been found to activate in almost one-third of all mental states induced in fMRI tests.
But there are also circumstances when reverse inference is less likely to go horribly wrong, and these are important to the logic of neuromarketing. Suppose (hypothetically) that the following results had been observed in academic neuroscience:
In 300 experiments, when people were paying attention to something, they had less alpha wave power in their frontal lobes than when they were not paying attention. In only ten experiments studying attention and alpha wave power was this relationship not found.
Now consider the following result and use of reverse inference in a hypothetical neuromarketing study:
In our experiment, we found that people had less alpha wave power in their frontal lobes when they watched ad A than when they watched ad B.
Therefore, we conclude that they paid more attention to ad A than to ad B.
This is not necessarily true, because it could be the case that the observed alpha wave power was caused by something other than attention to the ad. For example, maybe the people watching ad A were paying attention to an ugly poster on the wall, or maybe they were distracted by a poorly fitting EEG sensor cap. In both these cases, the mistaken inference would be a function of experimental process error: That poster shouldn’t have been in the room, and the cap should’ve been fitted correctly.
Or maybe the lower alpha wave power while watching ad A was caused by a mental state other than attention. In this case, the mistaken inference would be a function of measurement error: The attention metric being used was actually measuring something else, a different mental state than attention.
For people who like logical purity, the fact that reverse inference can go wrong is enough to dismiss it as “nonscientific.” But for researchers who live in the world of applied science, logical purity is a luxury they can seldom afford. They’re more interested in probabilities and likelihoods, not certainty. So, the kind of inference a neuromarketer would make might go something like this:
If the forward inference relationship between alpha wave power and attention is well established (and in this case it is, 97 percent of the time), and
If we believe the neuromarketing experiment was well designed and executed so that the likelihood of experimental process error is low, and
If we believe our metric of attention is valid and reliable, so that the likelihood of measurement error is low, and
If the result found is a statistically significant decrease in alpha wave power in the frontal lobes while watching ad A compared to watching ad B,
Then our confidence will be high that ad A did, in fact, attract more attention than ad B.
 Here are the important points you should remember about reverse inference:
![]() Neuromarketing studies use reverse inference all the time. Indeed, any applied science would be impossible without using reverse inference.
Neuromarketing studies use reverse inference all the time. Indeed, any applied science would be impossible without using reverse inference.
![]() Reverse inference is not logically true, so additional information needs to be taken into account to determine how much confidence you should have in it.
Reverse inference is not logically true, so additional information needs to be taken into account to determine how much confidence you should have in it.
![]() Specifically, you need to be confident that the variability you’re observing is coming from the treatments in your experiment, and not measurement error or experimental process error.
Specifically, you need to be confident that the variability you’re observing is coming from the treatments in your experiment, and not measurement error or experimental process error.
![]() If you’re satisfied that the experiment and metric are sound, you can be confident that the reverse inference is true. But you can never be 100 percent certain that it’s true, only more certain than you were before the experiment was performed.
If you’re satisfied that the experiment and metric are sound, you can be confident that the reverse inference is true. But you can never be 100 percent certain that it’s true, only more certain than you were before the experiment was performed.
Using a type of statistics called Bayesian analysis, it is possible to quantify the increase in confidence provided by an experimental result. We discuss this topic in the next section.
Statistical Significance: Knowing When to Believe the Results
The use of statistics in neuromarketing studies is another huge topic, and we’re not going to provide a course in statistical methods here. That’s a topic for a different For Dummies book. Instead, this section is devoted to presenting a few best practices for using statistics in neuromarketing studies — from the bare minimum of statistical testing you should expect, to an introduction to some advanced methods that you may begin to see soon.
Statistical tests commonly used in neuromarketing studies
The first point to make about statistical testing is that any neuromarketing finding that is not qualified by an appropriate statistical test is a qualitative finding only and should be treated as such. It’s a finding whose validity, reliability, and generalizability are unknown. We believe it’s a bad idea to use any research finding that isn’t qualified by statistical testing as a guide to business decision making.
The humble t-test
The workhorse of statistical testing is the t-test, which is used in experiments to test whether you should believe it when two treatments produce different results with regard to a response measure.
To use a t-test, the response needs to be measured as a continuous or interval-level variable, so you can calculate its mean (or average) across all subjects in each treatment. The t-test also takes into account the variability of the responses — that is, how widely they’re spread out across the subjects in each treatment. Determining whether a difference in means is statistically significant depends on both the means themselves and the variability in the underlying individual responses.
The t-test is the simplest and most direct statistical test you should expect to see in a neuromarketing study. It’s limited to comparing two treatments only, so if the study has three or more treatments, or any other complications, the t-test won’t be appropriate.
More complex analysis of variance tests
Most experimental designs are too complex for a t-test. For those designs, the appropriate tests will come from the family of statistical techniques called analysis of variance (ANOVA). These techniques are a generalization of the principles underlying the t-test. They’re all about assigning the variability in a response measure to various sources, including the treatments, interaction between the treatments, and leftover variability due to error.
ANOVA results are presented in ANOVA tables that should appear in a study report. If you aren’t familiar with how to read an ANOVA table, your neuromarketing partner should be able to walk you through it so you can see exactly which comparisons in your study are statistically significant and which are not. Understanding the statistics is vitally important to your overall understanding of the business significance of the study.
Beware of vendors who simply list significance levels but don’t show how the statistics were calculated. Statistical significance is very closely related to validity, reliability, and generalizability, and is fundamental to deciding how much confidence to put in a finding. Making any business decision based on a study that is not completely transparent in its statistical testing is essentially flying your business blind. We don’t recommend it.
Getting more mileage out of statistical testing
Statistical significance is the most common kind of test you’re likely to see on a neuromarketing study, but it’s actually a relatively weak statistical basis for business decision making.
A statistic that is “significant at p = 0.05” (where p is probability) tells you only that the difference you observed in your experiment would occur only 5 percent of the time if, in fact, there was no real difference in the population you were sampling from (this is called the null hypothesis in statistics texts). But few if any studies are ever done because someone believes the null hypothesis is true. What you really want to know when you do a neuromarketing study is whether your results represent a strong or weak relationship between treatment and response and, ultimately, whether you should let this result impact your business decision making.
Comparing effects sizes
In contrast to statistical significance tests, measures of effect size give you an objective and comparable way to classify the magnitude of an observed effect as small, medium, or large. For a difference between two averages, the most commonly used effect size statistic is Cohen’s d. Cohen’s d is a very intuitive statistic. It’s simply the difference between the average scores for the two treatments, divided by a measure of the variability or spread of the individual scores that make up the averages.
Reporting a statistic like Cohen’s d alongside statistical significance allows you not only to gauge the size of any effects you have found, but also to compare effect sizes across treatments and even across studies that use difference measures. This provides much more decision-relevant information than can be derived from a significance score alone.
Encourage your neuromarketing partners to report effect size statistics in all their reporting. You’ll be helping establish a reporting standard for the neuromarketing field that has been adopted by most of the top psychology and neuroscience journals. (For more on neuromarketing standards, see Chapter 22).
Calculating probabilities with Bayesian inference
In this section, we take a very brief look at a very advanced topic. Bayesian analysis is an approach to statistics based on the work of 18th-century mathematician Thomas Bayes. It’s relevant to neuromarketing because it provides a way to quantify the idea of confidence in a finding. That is, instead of just saying informally that you should have more or less confidence in a finding, Bayesian inference provides a mathematical framework for specifying precisely how much confidence you should have.
We believe Bayesian inference will continue to grow in popularity as a statistical methodology because it’s very compatible with the language and logic of real business decision making. We also believe it will become more applicable to neuromarketing because of the growth of normative data (discussed in the next section) in neuromarketing research.
The basic idea behind Bayesian inference is that you can update the expected probability (the likelihood, also called the posterior probability) that an outcome will occur by taking into account two pieces of information:
![]() A new observation, which in this case would be the result of an experiment
A new observation, which in this case would be the result of an experiment
![]() The outcome’s prior probability, which is based on everything you knew before you conducted the experiment
The outcome’s prior probability, which is based on everything you knew before you conducted the experiment
In other words, Bayesian inference is a technique for quantifying how much a new piece of information is worth, given everything you knew before.
The applicability of Bayesian inference to neuromarketing, normative data, and business decision making is straightforward as an idea, if challenging in practice. Neuromarketers are surrounded by prior knowledge. Some of it is locked away in academic studies, which may or may not be directly useful. But neuromarketers can build their own normative databases, using their own metrics and their own results, to create a foundation of prior knowledge against which new findings can be compared and assessed for business impact. Combining normative data from past findings (prior probabilities) with new data from new findings (new observations), neuromarketers can give marketers much more precise research results (expected probabilities) that can directly impact real business decision making.
Normative Data: Linking Findings to the Real World
A neuromarketing firm’s investment in normative data is a good indicator of its overall maturity as a business and the degree to which it is committed to investing in the long-term quality of its research offerings. Normative data is data that compares a neuromarketing firm’s internal metrics to external measures of performance, like sales or revenues. It can be highly precise or very general. Normative data is important for a number of reasons:
![]() It provides a wider context of real-world performance within which results from individual studies can be compared and interpreted.
It provides a wider context of real-world performance within which results from individual studies can be compared and interpreted.
![]() It provides a basis for data exploration to identify new insights and associations that only become visible across multiple studies.
It provides a basis for data exploration to identify new insights and associations that only become visible across multiple studies.
![]() It’s the only sure way to link a firm’s results to real-world behavioral outcomes, at both the individual consumer and overall market levels.
It’s the only sure way to link a firm’s results to real-world behavioral outcomes, at both the individual consumer and overall market levels.
![]() It’s the chief mechanism by which metrics are refined and calibrated over time to improve their validity, reliability, and predictability.
It’s the chief mechanism by which metrics are refined and calibrated over time to improve their validity, reliability, and predictability.
Friends don’t let friends make marketing decisions without normative data
There are two levels of normative data that are very distinct from each other. Sometimes neuromarketing vendors blur this distinction, so it’s important to have a clear understanding of which level is being described:
![]() Normalized (or standardized) data: Scores are normalized against existing data so they’re comparable. For example, an ad might be said to score in the “75th percentile” compared to 200 other ads. This is a kind of normative statement, but a weak one, because it doesn’t link the score to any associated behaviors or market performance outcomes.
Normalized (or standardized) data: Scores are normalized against existing data so they’re comparable. For example, an ad might be said to score in the “75th percentile” compared to 200 other ads. This is a kind of normative statement, but a weak one, because it doesn’t link the score to any associated behaviors or market performance outcomes.
![]() Normative data: Scores are linked to behaviors or levels of performance. For example, a “four-star” ad might be said to produce 20 percent greater sales, on average, than a “three-star” ad. This is a much stronger normative statement because it links the metric to a real-world outcome.
Normative data: Scores are linked to behaviors or levels of performance. For example, a “four-star” ad might be said to produce 20 percent greater sales, on average, than a “three-star” ad. This is a much stronger normative statement because it links the metric to a real-world outcome.
True normative data provides a performance benchmark for estimating the business relevance of a finding or study. In the absence of normative data, results can appear detached and illusive. Decision makers can easily lose patience with metrics (and vendors) that don’t relate to real-world outcomes.
Understanding how normative data puts study results in context
Any neuromarketing firm that’s serious about normative data has a dedicated program, with dedicated staff, maintaining its cross-study data and working on internal studies to improve and expand its normative data assets. Most important, it will have a program in place to calibrate and improve its metrics based on its normative data. Management of normative data is a full-time job, and any company that’s doing it well will, in all likelihood, be more than happy to talk about it in excruciating detail.
Know what level of normative data your neuromarketing vendor offers. Find out how much time and effort it devotes to maintaining its normative database, how many cases its database contains, how often external performance data is refreshed, and how often it updates its metrics based on changes to the normative database. Be cautious about working with a partner that doesn’t have a serious normative data program.