Chapter 2
Editing is primarily about telling a story, using pictures and sound to entertain, inform or educate. But if the quality, that is technical quality, is sub-standard the story may never get told. It could be that a broadcaster will not transmit a programme due to illegal colours being produced, or a client might object to distortion on audio. Whatever the reason, video editors need to have an understanding of the television system and the engineering criteria that apply to video and audio.
The interlaced scanning system
Video images are generated using an interlaced scanning system. An image is scanned from left to right and from top to bottom. Each complete scan from top to bottom is known as a field, which is designated as field 1 or field 2. The combining or interlace of two fields creates a frame. For the UK and most of Europe, the PAL system (Phase Alternating Line) has 312½ lines in each field and as a frame consists of two fields it is therefore made up of 625 scanning lines. The American NTSC system (National Television Standards Committee) uses 262½ lines per field and two fields per frame giving a total of 525 lines per frame. For the PAL system there are 25 frames per second and for NTSC there are 30 frames per second. In fact the NTSC system has a defined frame rate of 29.97 frames per second (see the discussion on timecode in Chapter 5 for more details). There is also the French system called SECAM (Sequential Couleur a Memoire), which uses 625 scanning Sines with a repetition rate of 25 frames per second.
The television scanning
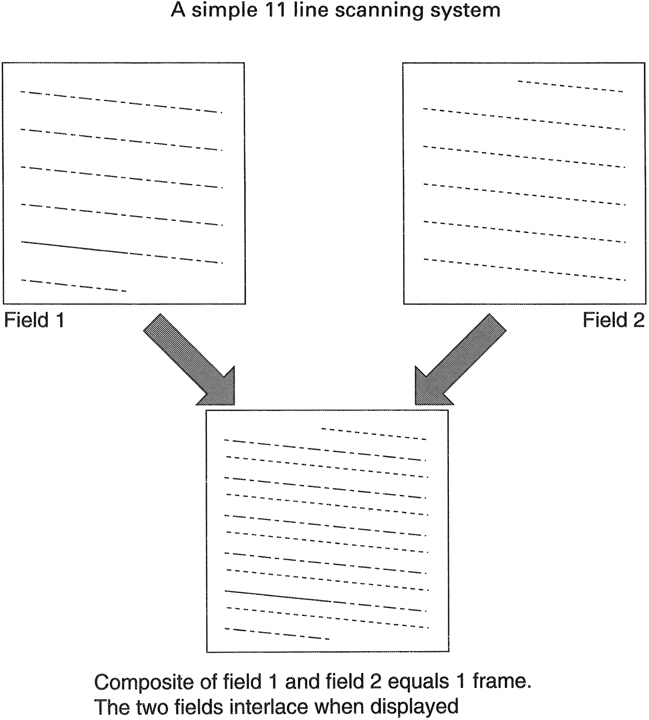
Two-fie!d interlaced scanning. For PAL there are 312% lines per field, 625 line per frame. The field repetition rate is 50 fields per second, and the frame rate is therefore 25 per second. For NTSC there are 262J4 lines per field, 525 lines per frame. The field repetition rate is 60 fields per second and the frame rate is therefore 30 frames per second.
In the analogue world the signals generated are further defined to exist within certain parameters. Ignoring these parameters can lead to a loss of picture quality, which cannot be recovered.
The waveform monitor
A waveform monitor measures the brightness, or luminance, of the video signal. This device is used to confirm that illegal levels of luminance are not being generated, which is an important issue whether recording to tape or hard disks. The parameters of the PAL system define a 1 V signal with peak white at a maximum level of 0.7 V, colour black at 0 V and sync bottom at -0.3 V. While the scales and graticules vary from manufacturer to manufacturer, the essential criterion is that the maximum excursion of peak white should be no greater than 0.7 V from black level.
The vectorscope
The vectorscope is another electronic window into what is happening with the video signal. Its primary function is to measure levels of the colour, or chrominance, part of the signal. The most common signal to use as a reference is colour bars and there are a number of internationally agreed standards for a range of colour bar test signals. For PAL there are three: 100% bars, 95% bars and 75% bars. There should be one set of colour bars at the beginning of each tape, usually 75% or 100% bars. When viewed with a vectorscope the colour bars should conform to defined levels for hue and saturation, where hue is the colour and saturation is the depth of colour. For both PAL and NTSC there are prescribed safe colours and defined maxima for the saturation. A vectorscope is very important to check that the above parameters are not exceeded otherwise the reproduced colour in a domestic TV will not match that at the point of origination.
Colour bar waveforms
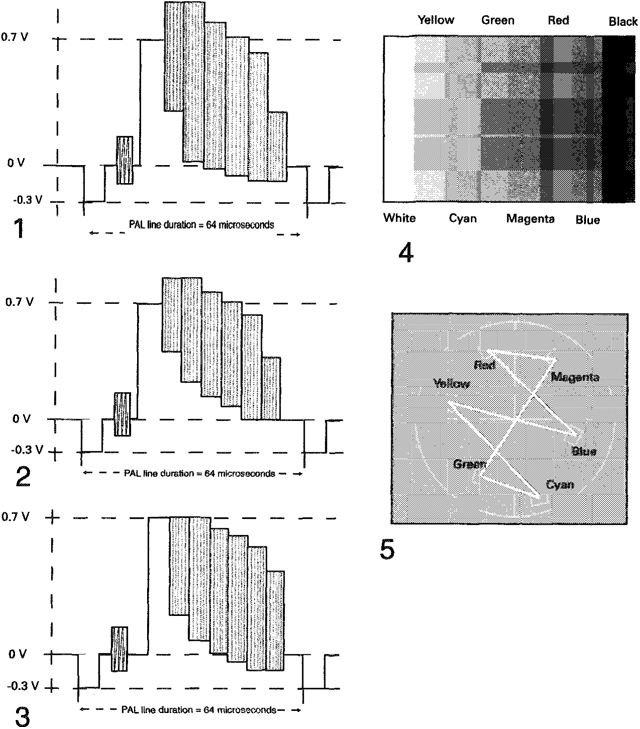
(1) 100.0.100.0 colour bars more commonly known as 100% bars.
(2) 100.0.100.25 colour bars more commonly known as 95% bars. (3) 100.0.75.0 colour bars more commonly known as 75% bars.
(4) Colour order as seen onscreen. Note: 100% and 75% bars are the two most common line-up signals found in post-production. Many colour bar types exist but they will normally offer a similar set of line-up reference points. (5) Colour bars as viewed on a vectorscope.
The video monitor
The TV monitor provides a representation of what the viewer will actually see. It is a quality indicator of both source material and completed programmes. The video monitors in any edit suite should be the best that can be afforded as, if the monitor is old or poorly lined up, it can give a misleading and inaccurate reproduction of the image. Some editors have been known to apply colour correction to overcome perceived problems on their monitors, and subsequently that programme has been aired with a colour fault!
The computer monitor
Computer monitors use a progressive scanning system with many more scanning lines than either PAL or NTSC. Computer monitors can have more than a thousand scanning lines with a repetition rate of up to 80 full scans from top to bottom per second, with no interlace used. Because of this, computer monitors have a much higher resolution than even an expensive high quality video monitor. The computer monitor, when used with graphics programmes, can also reproduce a different range of colours than allowed for in the TV system. As a consequence you cannot reliably quality monitor your video image on a computer monitor.
Audio
Just as with video, care must be taken when capturing audio to the hard disk drives. Most nonlinear installations use an audio mixing desk to assist with the setting of levels and for the easy selection of sound sources. While video will invariably be sourced from one replay deck, audio may come from M inch tape, audiocassette, audio CD or even a microphone. Manually patching all these, as required, into the back of a computer audio card is not recommended. Even those systems that provide a breakout box can give problems after only a short period of plugging in and removing cables.
To assist with the control and monitoring of levels most systems provide some means of audio metering. Broadly there are two types of meter in terms of their visual characteristics. These are the VU or Volume Unit meter and the PPM or Peak Programme Meter.
Monitor scanning systems
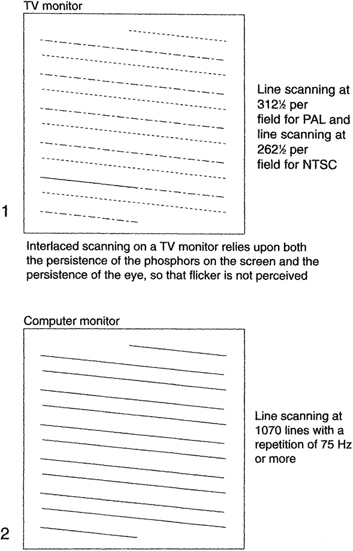
(1)The interlaced scanning of a TV monitor.
(2) The progressive scan of a computer monitor builds the image with consecutive lines. The line rate and repetition rate are usually higher than for a TV monitor.
VU meters provide a visual reading of the average levels and do not show peaks. Due to the slow rise time of the pointer, high level transients of short duration will be missed. To avoid distortion a VU meter should not be allowed to go above 100% or 0 dB. The PPM in contrast has a fast rise time and a slow decay, which allows for transients to be monitored. The PPM is often considered as offering a more accurate visual representation of what audio levels are actually doing. As such they are much loved when understood, though many audio recording engineers are equally passionate about the VU meter. While many mechanical versions of both VU meters and PPMs exist it is probably most likely that an electronic version in the form of a bargraph meter is what will be used within the nonlinear system. This is a software emulation of the plasma or cheaper LED (light emitting diode) bargraph meter. It should also be noted that with digital systems the scales of the metering will be considerably different from that found on analogue systems. What is important is that audio needs to be checked on a regular basis and if necessary adjusted during the capturing process. If an audio mixer is in use then this level adjustment is much easier than using the tools provided within most digital nonlinear systems.
With many productions not enjoying the advantage of a sound recordist on location (the OMO or one-man operation) many videotapes arrive in the edit suite with no line-up tone whatsoever. This is due to the fact that, while broadcast cameras will offer video line-up in the form of colour bars, no audio line-up is available. The cameraman without an audio mixer will not provide the line-up tone. For the editor there is no alternative but to check and adjust levels on a continuous basis.
Summary
The basic principle for both audio and video is one of unity gain, so what goes in, comes out. Otherwise, it’s ‘garbage in, garbage out’:
• Check all levels – both video and audio.
• Adjust if necessary on input to the system.
• Use the best quality measuring equipment.
Comparison of meter types
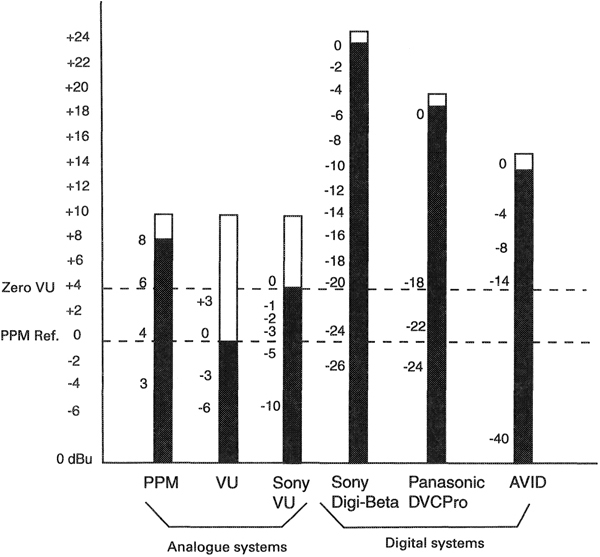
Guide for using VUs (avoiding distortion): The absolute maximum is 0 dB or 100% (remember short sounds may not be shown). Pure speech may have to be held back to -6 dB or lower (50% mod.). Some transient musical instruments hold to between -6 dB and -10 dB. Loud crowds or compressed material can reach 0 dB.
Guide for using PPMs (to help match the loudness): When using PPMs the audio levels may occasionally peak up to 6. Pure speech shouid be normally peaking 5 to 5/2. Some acoustic instruments might be allowed to peak 5 – more complex music lower. Compressed music (rock bands, for example) need to be at a maximum of 4 and TV commercials may also need to be held at this level. Small crowds may peak 5, but very energetic ones only 4 or they will seem too loud. Background effects behind a voice should be held at approx, PPM 2 (or 3 at max.).
Audio metering has become very diverse. Check the manuals for the system in use and establish a common practice.