
| CHAPTER 6 |
Volatility
1. If t is a time period expressed in years, σ is the annual volatility, and F is the forward or futures price, then for simple volatility calculations (rather than exponential calculations) a price change of n standard deviations over the time period t can be approximated as:
![]()
For a daily standard deviation, traders customarily assume 256 trading days in a year.
![]()
For a weekly standard deviation, assuming 52 trading weeks in a year, t is 1/52, and ![]() ≈ 1/7.2.
≈ 1/7.2.
Using simple volatility calculations, and assuming that the forward price is equal to the current price, what is an approximate daily and weekly one standard deviation price change for each of the contracts below?
a. contract price = 78.00

b. contract price = 1,325.00
c. contract price = 1.6270
d. contract price = 669.00
e. contract price = 3,187.00
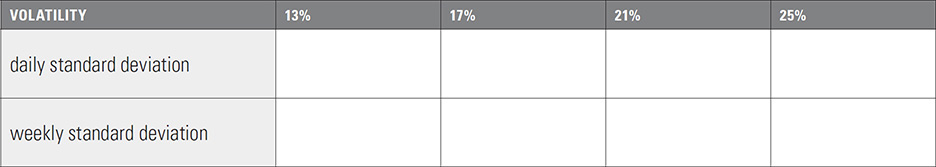
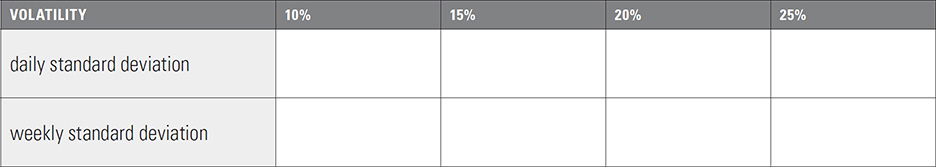
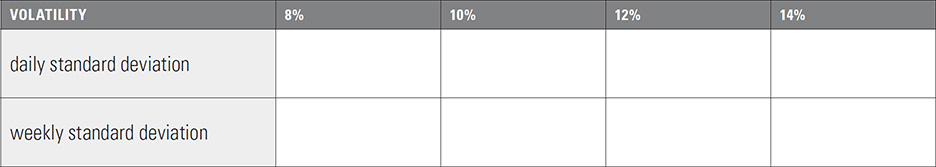
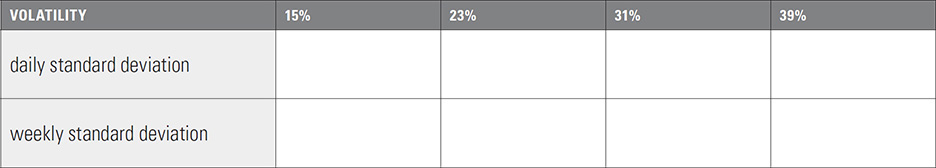
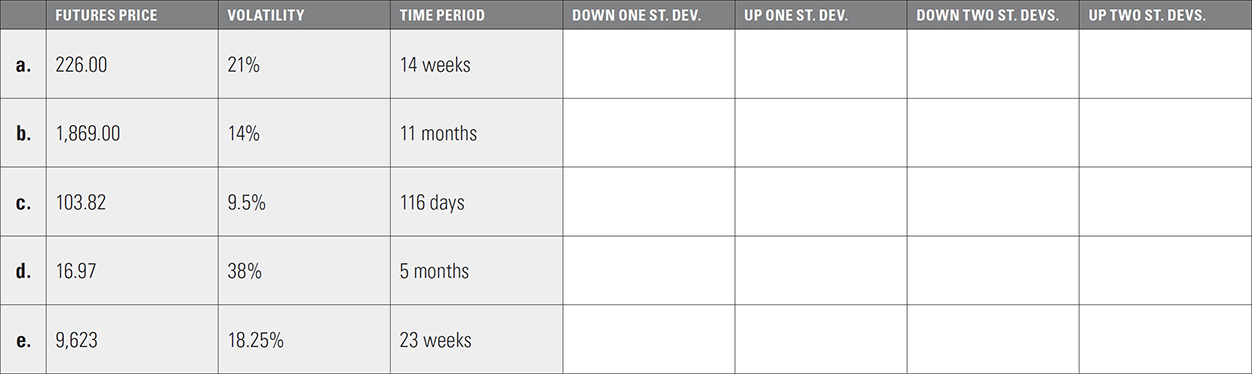
2. Using simple volatility calculations, for each futures contract and volatility below, what is an approximate one and two standard deviation price range over the given time period? Assume that a year is made up of 12 months, 52 weeks, or 365 days.
3. To calculate a more exact price change, we can use the exponential function ex or exp(x). If F is the forward or futures price, t is a time period expressed in years, and σ is the annual volatility:
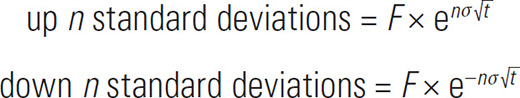
Using the same prices, volatilities, and time periods in question 2, recalculate the one and two standard deviation price ranges using the exponential function. How do these values differ from the simple values above?

4. A stock that is currently trading at a price of 104.75 has a volatility of 27.42%.
a. What is a one and two standard deviation price range 192 days from now if interest rates are 6.19% and the stock is expected to pay total dividends of 2.28 over this period? For this question use simple interest and volatility calculations and ignore any interest on dividends.
b. Suppose the dividend of 2.28 will be paid all at once in 43 days. Now go back and do the same one and two standard deviation calculation using continuous interest and volatility (the exponential function), and include any interest that can be earned on the dividend. Assume that the same interest rate of 6.19% applies to all interest calculations.
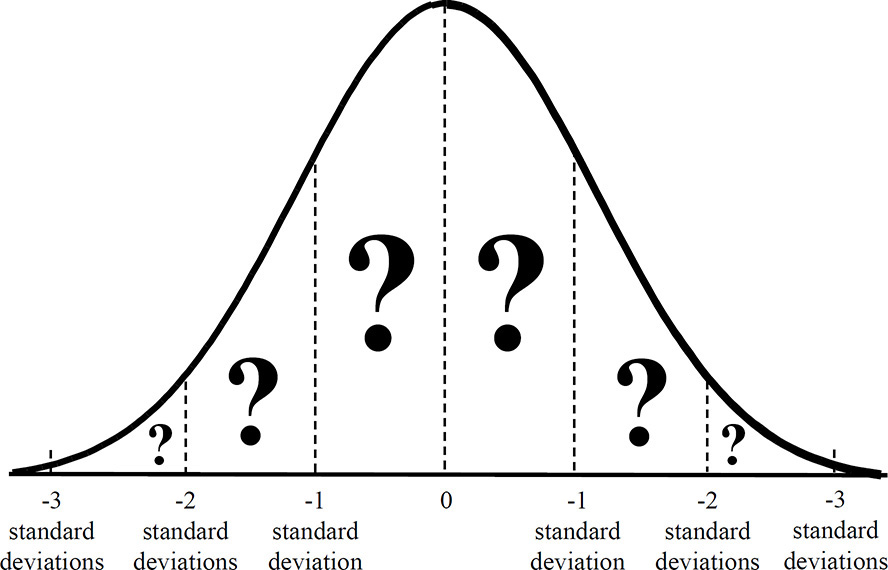
5. For a normal distribution, the following are the approximate probabilities associated with one, two, and three standard deviations:
![]() a move greater than one standard deviation, in either direction: 31¾%
a move greater than one standard deviation, in either direction: 31¾%
![]() a move greater than two standard deviations, in either direction: 4½%
a move greater than two standard deviations, in either direction: 4½%
![]() a move greater than three standard deviations, in either direction: ¼%
a move greater than three standard deviations, in either direction: ¼%
a. Using the above values, fill in the probabilities indicated by the question marks in the following drawing (the percentage of the area under the normal distribution curve between each set of dotted lines).
b. From your answers above, what is the approximate probability of getting an occurrence over the following ranges?
i. An up move less than two standard deviations
ii. An up or down move between one and two standard deviations
iii. A down move between two and three standard deviations
iv. An up move of less than one standard deviation or a down move of less than two standard deviations.
v. A down move between one and two standard deviations and an up move between two and three standard deviations
vi. A down move greater than two standard deviations and an up move greater than one standard deviation
vii. An up move greater than three standard deviations
6. An underlying contract is trading at a price close to 100. The implied volatility of options in this market is approximately 20%. Over a 10-day period you observe the following 10 close-to-close price changes for the underlying contract:
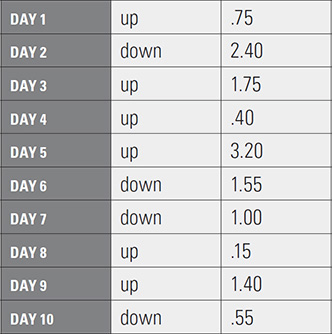
a. Do you think these price changes are consistent with a volatility of 20%? If not, why?
b. If 20% seems wrong, using only a simple calculator, what might be your volatility estimate for the 10-day period?