
| CHAPTER 20 |
Risk Analysis
1. Before the age of computer technology and the widespread use of theoretical pricing models, traders were sometimes able to analyze the risk of a position by rewriting a position in a more easily identifiable form using synthetic equivalents.
You have the following position:
+12 October 45 calls
–87 October 45 puts
–46 October 50 calls
+46 October 50 puts
+59 October 55 calls
+16 October 55 puts
–25 underlying contracts
a. Using synthetic equivalents, what is your delta, gamma, theta, and vega position (positive, negative, or neutral) if the underlying contract is trading at a price close to 45?
b. What is your delta, gamma, theta, and vega position (positive, negative, or neutral) if the underlying contract is trading at a price close to 55?
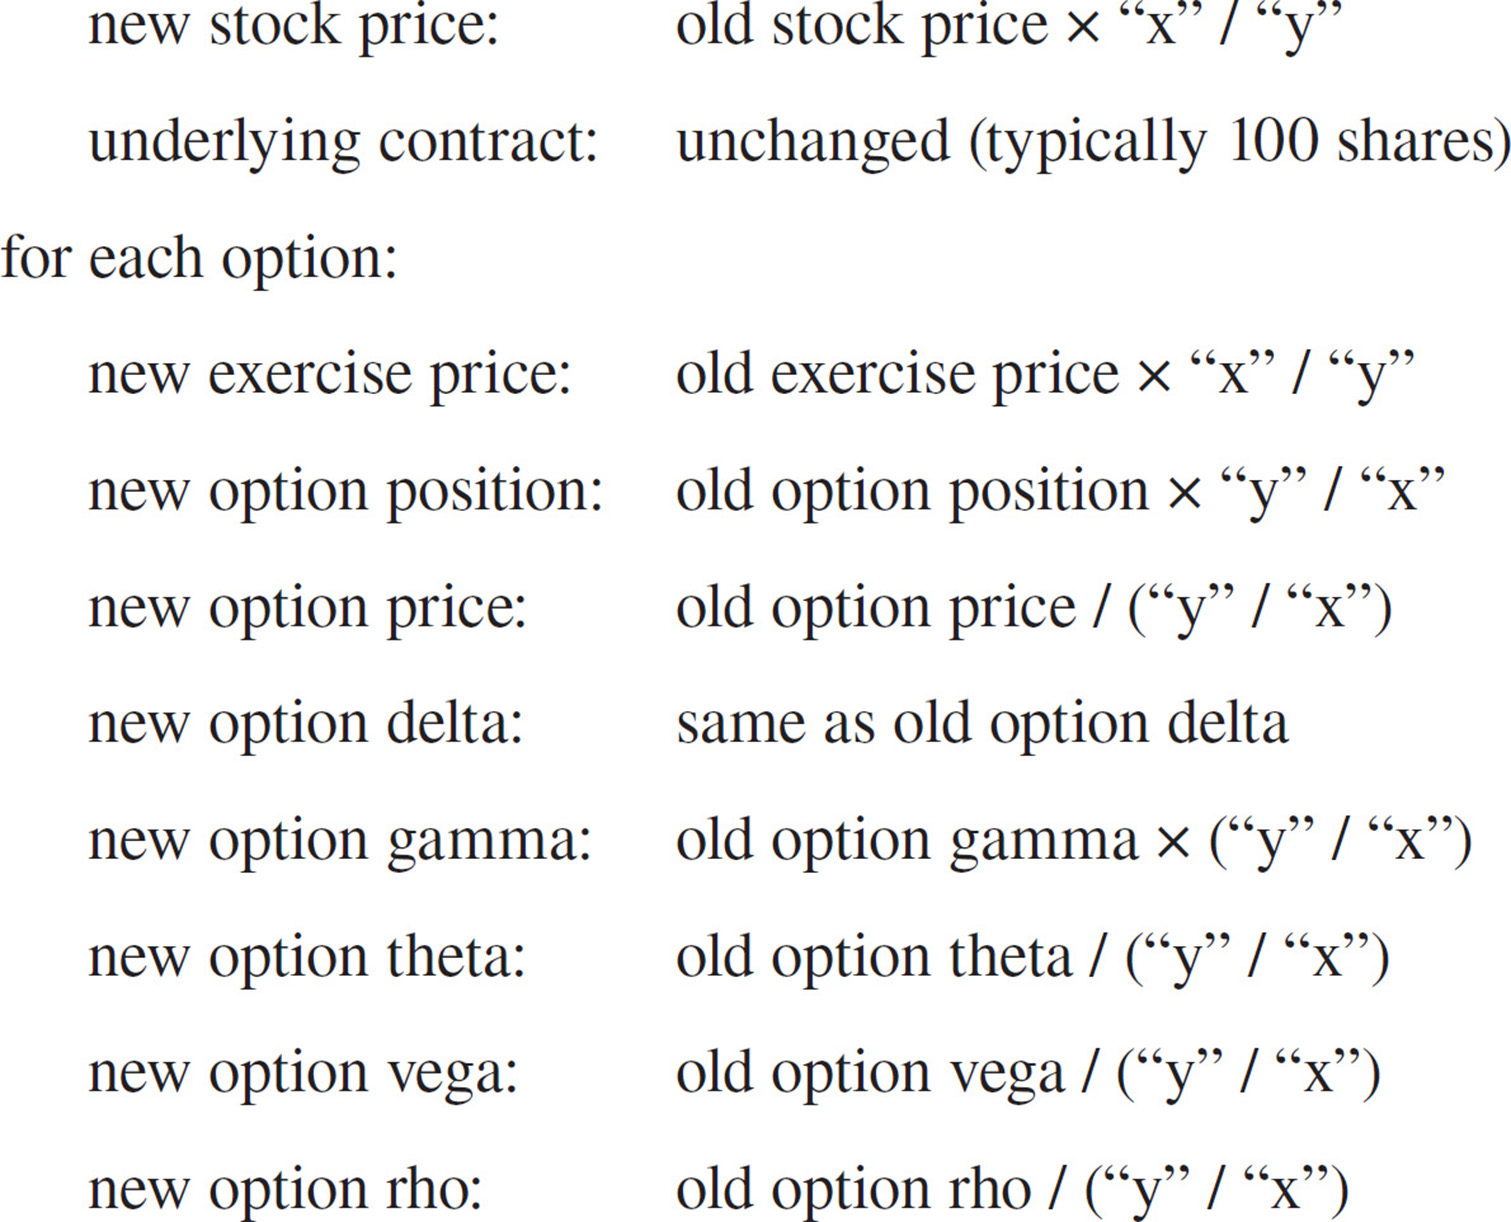
2. In the stock option market, when a stock splits “y” shares for “x” shares (e.g., in a 2 for 1 stock split, the holder of each old share receives 2 of the new shares), the following adjustments apply:
You have the following option position on a stock that is currently trading at a price of 122.82, where the underlying contract consists of 100 shares of stock:
+68 November 120 puts
+37 November 135 calls
+1200 shares of stock
The sensitivities of the options are:

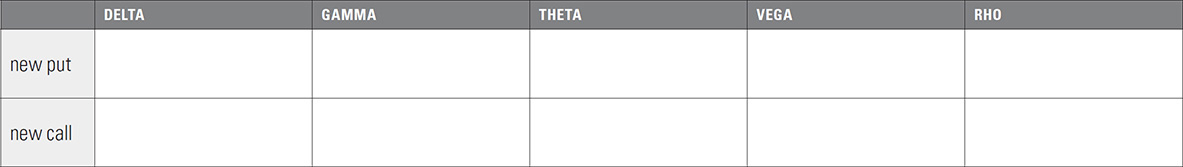
a. What is your total delta, gamma, theta, vega, and rho position?
i. delta:
ii. gamma:
iii. theta:
iv. vega:
v. rho:
b. The company announces a 3 for 1 stock split: every old share of stock will be replaced with three new shares. After the stock split takes effect, what is the new stock price?
c. After the stock split, what will be your new option and stock position?
d. After the stock split, approximately, what are the new delta, gamma, theta, vega, and rho values for the new options?
e. After the stock split, what is your total delta, gamma, theta, vega, and rho position?
i. total delta:
ii. total gamma:
iii. total theta:
iv. total vega:
v. total rho:
f. Can you identify the relationships between the total delta, gamma, theta, vega, and rho position before and after the stock split?
i. new delta position:
ii. new gamma position:
iii. new theta position:
iv. new vega position:
v. new rho position:
g. Suppose that prior to the stock split the prices of the November 120 put and the November 135 call were 4.14 and 2.55, respectively. At their new exercise prices, what will be their approximate prices after the split?
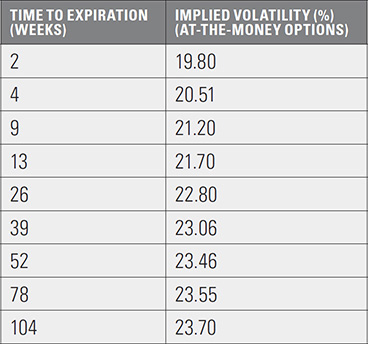
3. In an option market with multiple expirations, when implied volatility changes it rarely changes by an equal amount across all expirations. More often, the implied volatility of short-term expirations will change more quickly than the implied volatility of long-term expirations. This is a characteristic of the term structure of volatility, where the implied volatility of long-term expirations tends to remain close to the mean, or average, volatility of that particular market.
Suppose there are four expiration months trading at the following implied volatilities:

a. Which of the following is the best estimate of the mean volatility in this market?
26% 29% 33% 37%
b. If 1-month implied volatility falls to 30%, which of the following is a logical implied volatility scenario? (Choose one of i–iv.)
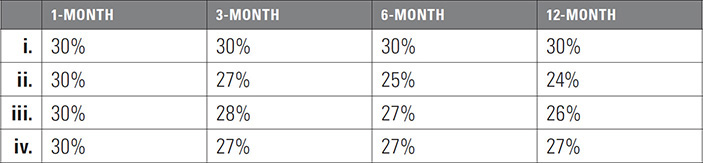
c. If 1-month implied volatility rises to 37%, which of the following is a logical implied volatility scenario? (Choose one of i–v.)

3. Because implied volatilities do not change at the same rate across all expirations, if we want an accurate picture of the vega risk for a portfolio consisting of multiple expirations it will be necessary to adjust the vega values to reflect the different rates at which implied volatility changes. This is often done by making no adjustment to the front month vega, but by multiplying the vega of each subsequent expiration by an adjustment factor based on how fast the implied volatility changes compared to the front month.
a. Consider a position consisting of four expiration months with each month’s total vega values.

i. If we make no adjustments, what is the total vega position?
ii. Would this position prefer implied volatility to rise or fall?
b. Suppose we have determined that implied volatility for April tends to change at 80% of the rate of change in March implied volatility, implied volatility for June tends to change at 70% of the rate of change in March, and implied volatility for September tends to change at 65% of the rate of change in March.
i. In terms of changes in March implied volatility, what is the total adjusted vega for the position?
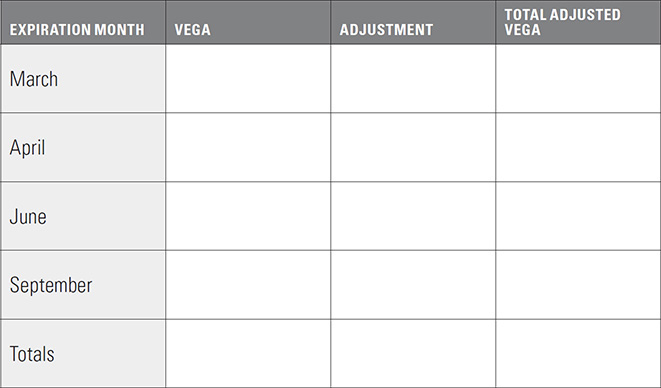
ii. Based on your total adjusted vega, would the position prefer implied volatility to rise or fall?
iii. If implied volatility in March rises three percentage points, how will the position P&L be affected?
4. The term structure of volatility in an option market can be an important consideration, not only in evaluating risk, but also in trying to identify potential trading strategies.
Consider these implied volatilities across expirations in an option market:
a. On the grid below, as best you can, plot the implied volatilities for the various expirations.
Can you identify any expirations where the implied volatilities seem to be mispriced, at least in relation to other expirations? To help you identify any mispricings, you may want to draw a curve that seems to best fit the implied volatility points.
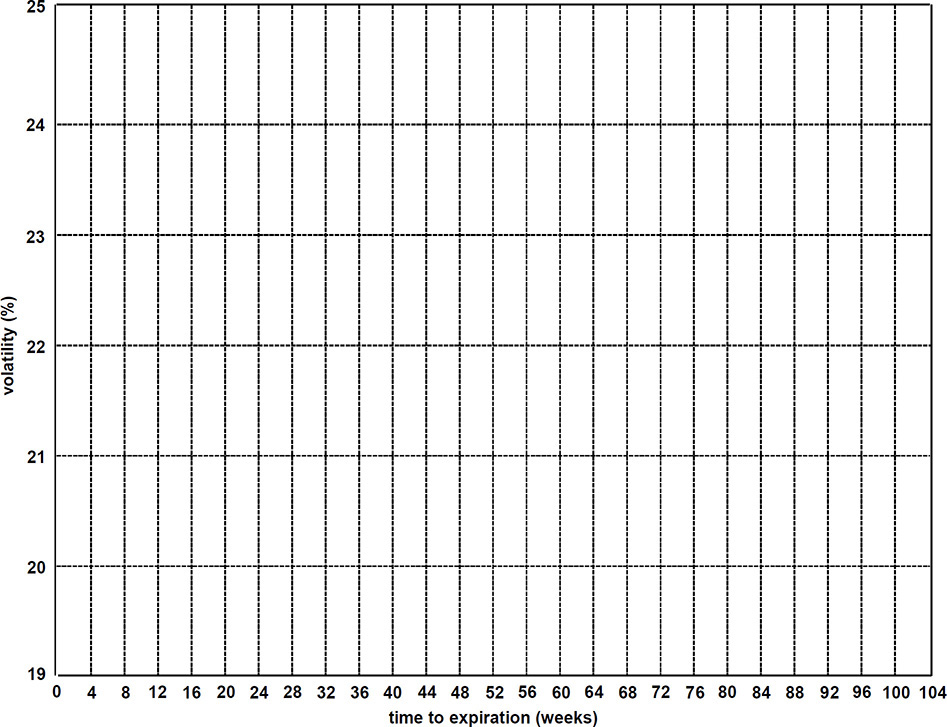
b. If we know a short-term implied volatility (σ1) and a long-term implied volatility (σ2), we can calculate the forward volatility (σf), the volatility that is expected to occur between the short-term and long-term expirations:

where t1 is the time to the short-term expiration and t2 is the time to the long-term expiration.
From the implied volatilities and time to expiration in part a, calculate the forward volatilities between expirations.

Now go back and overlay the forward volatilities on your plot of the implied volatilities. Is it easier to see which expirations are mispriced? You can also connect the forward volatility plot points to form a forward volatility curve.
5. A detailed risk analysis of any complex option position will almost certainly require a reliable theoretical pricing model, as well as software that can analyze the position under a wide variety of market conditions, including changes in underlying price, volatility, and time to expiration. However, if we know the sensitivities of a position (delta, gamma, etc.), as well as the number of contracts that make up the position, it is often possible to do a preliminary risk analysis by asking several basic questions about the position.
Consider the following stock and stock option position consisting of two expiration months:

where the delta and gamma are given in the whole number format, the theta is the decay per one day’s passage of time, the vega is the sensitivity to a one percentage point change in volatility, and the rho is the sensitivity to a one percentage point change in interest rates.
Note that no prices or theoretical values are given for any of the contracts that make up the position. A position can be initiated at favorable or unfavorable prices (usually compared to model generated values). But once a trader has taken on a position the risk characteristics of the position are independent of the prices.
From the above values, try to answer the following questions:
a. Looking at the delta, gamma, vega, and rho, what is the best and worst scenario for the position?
i. Best scenario:
ii. Worst scenario:
b. Considering the delta and gamma, estimate the stock price (compared to the current stock price) at which the position will show its maximum theoretical profit. (Hint: a negative gamma position will show its maximum value when it is delta neutral.)
c. Suppose that the entire position was evaluated using a volatility of 22%, and at this volatility the position has a positive theoretical edge (compared to the current market prices) of 78 points. From the vega, what is the implied volatility of the entire position? In other words, at what volatility will the position have a theoretical edge of zero?
d. Using the current theoretical edge of 78 points, if the stock moves up or down 10 points, what will be the new theoretical edge for the position?
e. Suppose that the market makes such a large move that all options are either very deeply in-the-money or very far out-of-the money. In terms of underlying contracts, what will be the characteristics of the position if the move is ...
i. downward?
ii. upward?
f. How does your answer to question 5e.i above compare to your answer to question 5a?
g. The total delta position is currently +326. Suppose there is a dramatic increase in implied volatility. How will this affect the total delta position?
h. In question 5c we made the assumption that the entire position was evaluated using a single volatility of 22%. But we know that this is not always true. Due to the term structure of volatility different months are often evaluated using different volatilities, and these volatilities will often change at different rates.
Suppose that volatility in Month 2 tends to change at 75% of the rate of change in Month 1 volatility. That is, if volatility changes by one percentage point in Month 1, it will change by .75 percentage point in Month 2.
i. In terms of Month 1 volatility, what is the total adjusted vega for the position?
ii. Using the adjusted vega, if, as in question c, the Month 1 implied volatility is 22%, what is the implied volatility of the entire position in terms of the Month 1 volatility?
i. Suppose a dividend of 3.00 is expected to be paid after Month 1 expiration but prior to Month 2 expiration. If the dividend is unexpectedly increased to 5.00, how will this affect the potential profit or loss from the entire position?