| CHAPTER 9 |
The Dynamics of Risk
Nothing in option markets remains constant. Not only are theoretical values constantly changing as market conditions change, but the risk sensitivities are also changing. Understanding how the sensitivities change as market conditions change is an important part of an active option trader’s education.
Following are some important principles of risk dynamics:
![]() An at-the-money option (or, more correctly, an at-the-forward option) has a greater gamma, theta, and vega than a similar in- or out-of-the-money option.
An at-the-money option (or, more correctly, an at-the-forward option) has a greater gamma, theta, and vega than a similar in- or out-of-the-money option.
![]() As volatility increases, call deltas move toward 50, and put deltas move toward –50.
As volatility increases, call deltas move toward 50, and put deltas move toward –50.
![]() As volatility declines or time passes, call deltas move away from 50, and put deltas move away from –50.
As volatility declines or time passes, call deltas move away from 50, and put deltas move away from –50.
![]() As volatility increases, the gamma of at-the-money options decline, while the gamma of in-the-money and out-of-the money options increase.
As volatility increases, the gamma of at-the-money options decline, while the gamma of in-the-money and out-of-the money options increase.
![]() As volatility declines or time passes, the gamma of at-the-money options increase, while gamma of in-the-money and out-of-the money options decline.
As volatility declines or time passes, the gamma of at-the-money options increase, while gamma of in-the-money and out-of-the money options decline.
![]() As volatility rises, the theta of all options will increase. (The option has more value to lose over an equal amount of time.)
As volatility rises, the theta of all options will increase. (The option has more value to lose over an equal amount of time.)
![]() As volatility falls, the theta of all options will decline. (The option has less value to lose over an equal amount of time.)
As volatility falls, the theta of all options will decline. (The option has less value to lose over an equal amount of time.)
![]() As volatility changes, the vega of an at-the-money option will remain essentially unchanged.
As volatility changes, the vega of an at-the-money option will remain essentially unchanged.
![]() As time passes, the theta of an at-the-money option increases.
As time passes, the theta of an at-the-money option increases.
![]() As time passes, the vega of all options declines.
As time passes, the vega of all options declines.
![]() If an option has a nonzero rho value, as time passes the rho will decline.
If an option has a nonzero rho value, as time passes the rho will decline.
![]() If an option has a nonzero rho value, the greater the value of the option, the greater the rho.
If an option has a nonzero rho value, the greater the value of the option, the greater the rho.
1. An underlying contract is currently trading at a price of 75. If there are no interest considerations (interest rates are zero), for each pair of options choose the correct answer.
a. If the underlying price changes, but all other market conditions remain unchanged, which option’s price will change the most?
i. a 1-month 75 call
a 1-month 80 call
ii. a 1-month 75 put
a 1-month 80 put
iii. a 1-month 80 put
a 3-month 80 put
b. If the underlying price changes, but all other market conditions remain unchanged, which option’s delta will change the most?
i. a 1-month 75 call
a 1-month 80 call
ii. a 1-month 75 call
a 3-month 75 call
iii. a 1-month 65 put
a 3-month 65 put
c. If the implied volatility changes by the same amount for all options, but all other market conditions remain unchanged, which option’s price will change the most?
i. a 3-month 70 put
a 3-month 75 put
ii. a 1-month 75 put
a 3-month 75 put
iii. a 1-month 85 call
a 3-month 85 call
d. If two weeks pass with no change in the price of the underlying contract, but all other market conditions remain unchanged, which option’s price will change the most?
i. a 1-month 70 call
a 1-month 75 call
ii. a 1-month 75 call
a 3-month 75 call
iii. a 3-month 75 call
a 3-month 65 put
e. If the underlying contract is stock, and interest rates change by the same amount for all expiration months, but all other market conditions remain unchanged, which option’s price will change the most?
i. a 3-month 70 call
a 3-month 75 call
ii. a 1-month 80 call
a 3-month 80 call
iii. a 1-month 70 put
a 1-month 75 put
f. If the underlying contract is a stock that is expected to pay a dividend in two months, if the dividend is changed but all other market conditions remain unchanged, which option’s price will change the most?
i. a 3-month 70 call
a 3-month 75 call
ii. a 1-month 80 call
a 3-month 80 call
iii. a 3-month 75 put
a 3-month 80 put
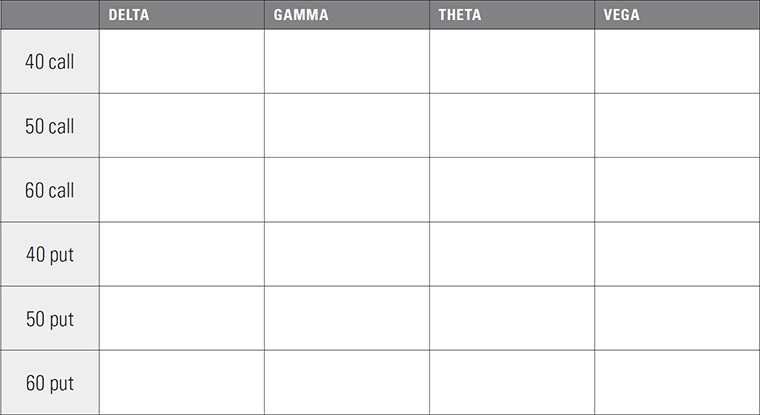
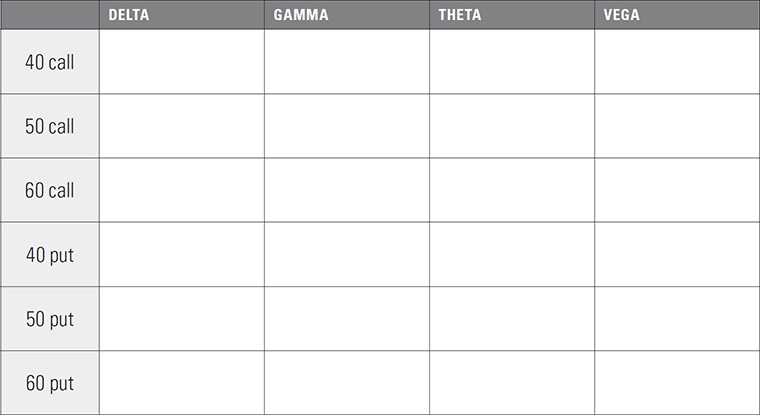
2. For each option below, with the given change in market conditions is each risk measure (delta, gamma, theta, vega), in absolute value, getting bigger (+), smaller (–), or staying about the same (0)?
underlying price = 50
time to expiration = 3 months
interest rate = 0
a. The underlying price falls to 45
b. The underlying price rises to 55
c. Two weeks pass
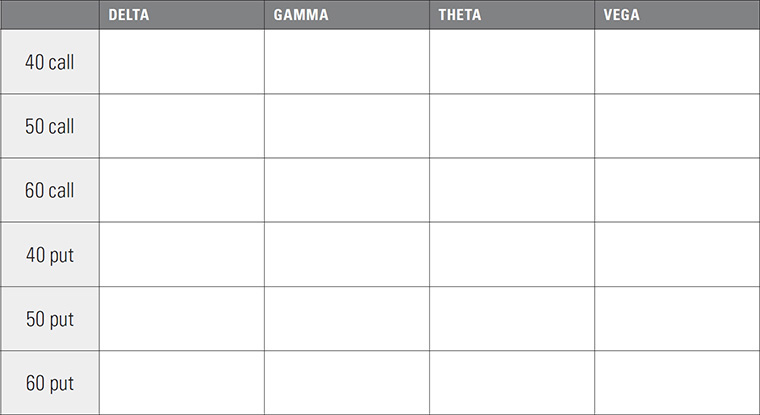
d. Volatility falls
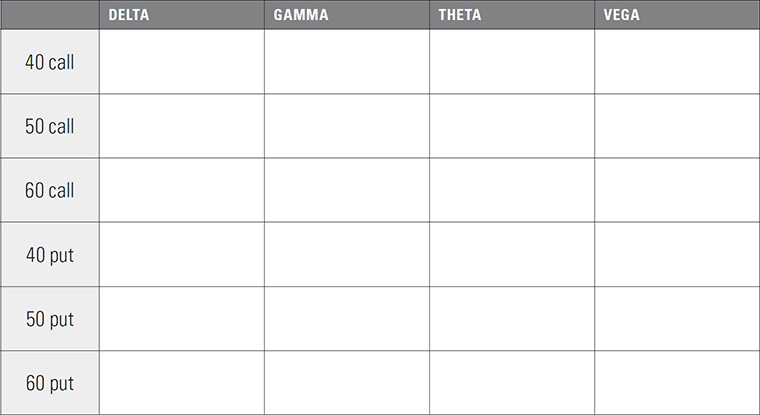
e. Volatility rises

Higher order risk measures (the sensitivity of a sensitivity) are sometimes used to approximate how basic risk measures (delta, gamma, theta, vega) will change as market conditions change. Some higher order risk measures:
Vanna—the sensitivity of the delta to a change in volatility (delta change per one percentage point change in volatility), or, the sensitivity of the vega to a change in underlying price (vega change per 1.00 change in the underlying price)
Charm—the sensitivity of the delta to the passage of time (delta change per one day passage of time), or the sensitivity of the theta to a change in underlying price (theta change per 1.00 change in the underlying price)
Volga—the sensitivity of the vega to a change in volatility (vega change per 1% change in volatility)
Vega decay—the sensitivity of the vega to the passage of time (vega change per one day passage of time)
Speed—the sensitivity of the gamma to a change in underlying price (gamma change per 1.00 change).
Color—the sensitivity of the gamma to the passage of time (gamma change per one day passage of time)
underlying stock price = 100
time to expiration = 3 months
Interest rate = 6.00%
volatility = 20%

In the above table, and for purposes of this exercise, the delta and gamma values are expressed in the decimal format. Delta values for calls range from 0 to 1.00, and for puts from 0 to –1.00.
3. Using the table of values above, try to answer the following questions:

4. When a sensitivity changes for a given change in market conditions, we can approximate the impact of that sensitivity by taking the average value of the sensitivity over the given change. (Recall that this was the method used in question 4 of the Risk Measurement section when estimating the effect of the delta and gamma together.)

5. An option’s elasticity is defined as the percent change in the option’s value for a one percent change in the price of the underlying contract.

a. If the price of the underlying contract rises from 54.80 to 56.34, what will be the new call and put values?
b. What are the delta values of the call and put?
c. How does an option’s elasticity relate to its delta?
6. Option trades are sometimes “tied to” a specific underlying price. That is, a customer may want to trade an option and hedge it at an underlying price different than the current underlying price. Consider this situation:
stock price = 73.50
time to expiration = 2 months
interest rate = 6.00%
dividend = 0
volatility = 25%
theoretical value of the 75 call = 2.64
delta of the 75 call = 48.0
gamma of the 75 call = 5.3
a. What will be the option’s approximate delta and theoretical value if the underlying stock price rises to 75.00?
b. Using the delta and gamma, in general what should be the new value of an option if the price of the underlying contract changes?
c. Suppose a customer wants to buy a 75 call tied to an underlying price of 75.00. (Perhaps the customer wants the option to be at-the-money.) If a market-maker takes the other side of this trade, what should be a fair price for the 75 call?
d. Using the theoretical value, delta, and gamma, what should be the “tied to” value of an option?
7. A—the price of the underlying stock rises
B—volatility rises
C—time passes
D—interest rates rise
E—the dividend is increased
If the underlying contract is stock, for the questions below fill in all appropriate choices from the above list:
a. Which of the above changes in market conditions will cause the delta of an at-the-money call to increase?
b. Which of the above changes in market conditions will cause the delta of an out-of-the-money put to increase (become more negative)?
c. Which of the above changes in market conditions will cause the gamma of an at-the-money call to increase?
d. Which of the above changes in market conditions will cause the gamma of a deeply in-the-money put to increase?
e. Which of the above changes in market conditions will cause the theta of an at-the-money put to increase?
f. Which of the above changes in market conditions will cause the vega of an out-of-the-money call to increase?
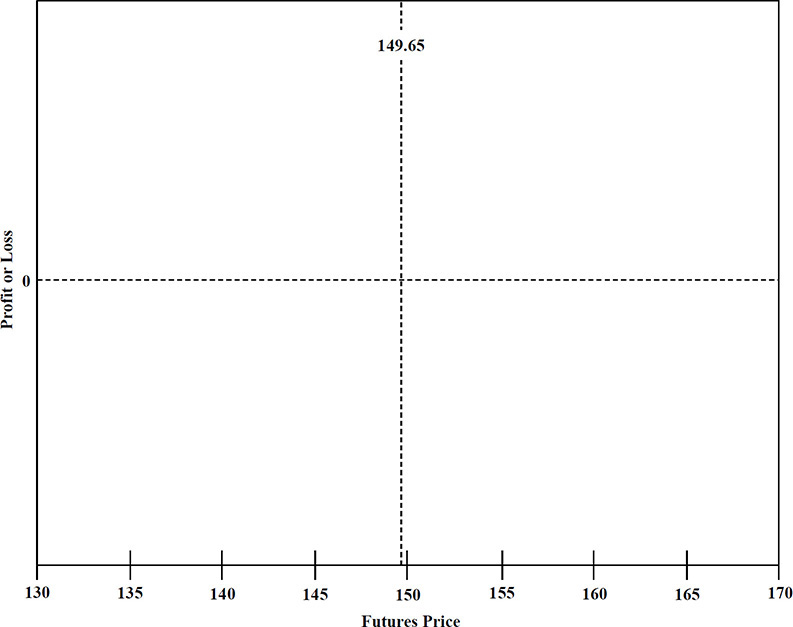
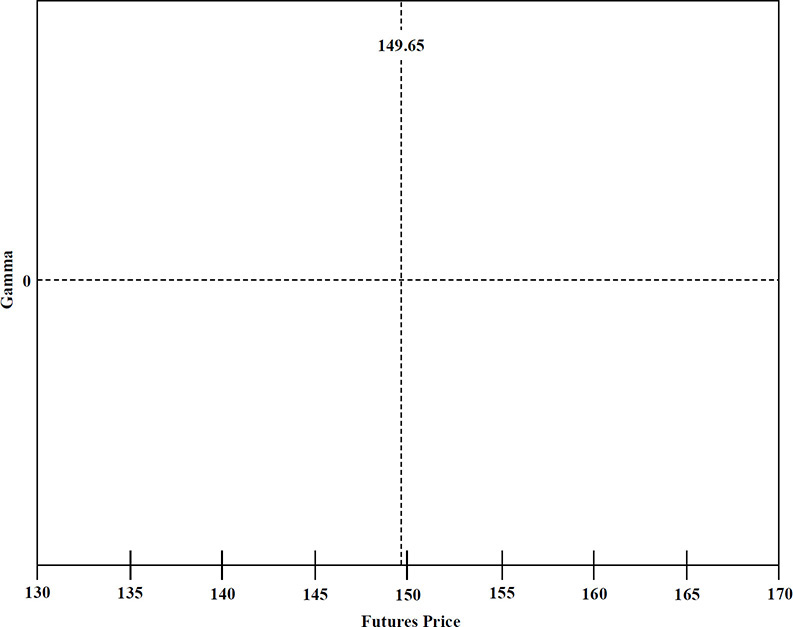
8. Futures price = 149.65
time to August expiration = 8 weeks
annual volatility = 24.20%
You have the following position:
–32 August 140 puts
+30 August 160 calls
–15 August futures contracts
with the options having these risk sensitivities:

a. What is your total delta, gamma, theta, and vega position?

b. Considering only the delta, gamma, theta, and vega, how risky do you think this position is?
c. Is your conclusion in question b reasonable?
d. What will happen to your delta, gamma, and vega position (become positive or less negative, become negative or less positive, stay about the same) if the futures price rises while all other market conditions remain unchanged?
e. What will happen to your delta, gamma, and vega position (become positive or less negative, become negative or less positive, stay about the same) if the futures price falls while all other market conditions remain unchanged?
f. What will happen to your delta position (become positive or less negative, become negative or less positive, stay about the same) if volatility increases to 28% while all other market conditions remain unchanged?
g. What will happen to your delta position (become positive or less negative, become negative or less positive, stay about the same) if three weeks pass while all other market conditions remain unchanged?
h. Suppose the futures contract makes a very large downward move. What is your maximum downside delta?
i. Suppose the futures contract makes a very large upward move. What is your maximum upside delta?
j. Rank the order in which the following combination of market conditions will most help or hurt your position (1 = helps the most; 4 = hurts the most).
_______ the futures price falls slowly to 140 and implied volatility falls to 22.20%
_______ the futures price falls quickly to 140 and implied volatility rises to 26.20%
_______ the futures price rises slowly to 160 and implied volatility falls to 22.20%
_______ the futures price rises quickly to 160 and implied volatility rises to 26.20%
k. Suppose that under current market conditions the entire position has a theoretical P&L of zero. Using the grids below, and keeping in mind the current futures price (149.65) as well as the put and call exercise prices (140 and 160), try to draw an approximate graph of the position P&L (one graph), the position delta (a second graph), and position gamma (the third graph) with respect to the underlying futures price (futures prices on the x-axis; P&L, delta, or gamma on the y-axis). Then using the same grids (the x-axis is still the futures price), draw graphs of the P&L, delta, and gamma as implied volatility rises or falls. You don’t need to be exact—the general shape of the graph and whether the values are positive or negative is sufficient.
