
In the last chapter, we spent some time developing our example application. Now it is time to start with more advanced topics. In this chapter, we will show you how to monitor your microservices application. Keeping a track of everything that is happening in your application will help you know the overall performance at any time, and you can even find issues and bottlenecks.
Debugging and profiling is very necessary in the development of a complex and large application, so let’s explain what they are and how we can take advantage of these kinds of tools.
Debugging is the process of identifying and fixing errors in programming. It is mainly a manual task in which developers need to use their imagination, intuition, and have a lot of patience.
Most of the time, it is necessary to include new instructions in the code to read the value of variables at a concrete point of execution or code to stop the execution in order to know whether it is passing through a function.
However, this process can be managed by the debugger. This is a tool or application that allows us to control the execution of our application in order to follow each executed instruction and find the bugs or errors, avoiding having to add code instructions in our code.
The debugger uses an instruction called breakpoint. A breakpoint is, as its name suggests, a point at which the application stops in order to be driven by the developer to decide what to do. At that point, the debugger gives different information about the current status of the application.
We will see more about the debugger and breakpoint later on.
Like debugging, profiling is a process to identify if our application is working properly in terms of performance. Profiling investigates the application’s behavior in order to know the dedicated time to execute different parts of code to find bottlenecks or optimize them in terms of speed or consumed resources.
Profiling is usually used during the development process as part of debugging, and it is necessary to measure it in proper environments by specialists to get real data from it.
There are four different kinds of profilers: based on events, statistics, tools to support code, and simulation.
Now we will install and set up Xdebug in our project. This must be installed on our IDE, so depending on which one you use, this process will be different, but the steps to follow are quite similar. In our case, we will install it on PHPStorm. Even if you use a different IDE, after installing Xdebug, the workflow for debugging your code in any IDE will largely be the same.
To install Xdebug on our Docker, we should modify the proper Dockerfile file. We will install it on the user microservices, so open the docker/microservices/user/php-fpm/Dockerfile file and add the following highlighted lines:
FROM php:7-fpm
RUN apt-get update && apt-get -y install
git g++ libcurl4-gnutls-dev libicu-dev libmcrypt-dev libpq-dev libxml2-dev unzip zlib1g-dev
&& git clone -b php7 https://github.com/phpredis/phpredis.git /usr/src/php/ext/redis
&& docker-php-ext-install curl intl json mbstring mcrypt pdo pdo_mysql redis xml
&& apt-get autoremove && apt-get autoclean
&& rm -rf /var/lib/apt/lists/*
RUN apt-get update && apt-get upgrade -y && apt-get autoremove -y
&& apt-get install -y git libmcrypt-dev libpng12-dev libjpeg-dev libpq-dev mysql-client curl
&& rm -rf /var/lib/apt/lists/*
&& docker-php-ext-configure gd --with-png-dir=/usr --with-jpeg-dir=/usr
&& docker-php-ext-install mcrypt gd mbstring pdo pdo_mysql zip
&& pecl install xdebug
&& rm -rf /tmp/pear
&& echo "zend_extension=$(find /usr/local/lib/php/extensions/ -name xdebug.so)n" >> /usr/local/etc/php/conf.d/xdebug.ini
&& echo "xdebug.remote_enable=on" >> /usr/local/etc/php/conf.d/xdebug.ini
&& echo "xdebug.remote_autostart=off" >> /usr/local/etc/php/conf.d/xdebug.ini
&& echo "xdebug.remote_port=9000" >> /usr/local/etc/php/conf.d/xdebug.ini
&& curl -sS https://getcomposer.org/installer | php -- --install-dir=/usr/local/bin --filename=composer
RUN echo 'date.timezone="Europe/Madrid"' >> /usr/local/etc/php/conf.d/date.ini
RUN echo 'session.save_path = "/tmp"' >> /usr/local/etc/php/conf.d/session.ini

{{ Omited code }}

RUN curl -sSL https://phar.phpunit.de/phpunit.phar -o /usr/bin/phpunit && chmod +x /usr/bin/phpunit

ADD ./config/php.ini /usr/local/etc/php/
CMD [ "/usr/local/bin/containerpilot",
"php-fpm",
"--nodaemonize"]
The first highlighted block is necessary to install xdebug. The && pecl install xdebug line is used to install Xdebug using PECL, and the rest of the lines set the parameters on the xdebug.ini file. The second one is to copy the php.ini file from our local machine to Docker.
It is also necessary to set some values on the php.ini file, so open it, it is located on docker/microservices/user/php-fpm/config/php.ini, and add the following lines:
    memory_limit = 128M
    post_max_size = 100M
    upload_max_filesize = 200M

    [Xdebug]
    xdebug.remote_host=YOUR_LOCAL_IP_ADDRESS
You should enter your local IP address instead of YOUR_LOCAL_IP_ADDRESS in order to be visible in Docker, so Xdebug will be able to read our code.
Now, you can make the build in order to install everything necessary to debug by executing the following command:
docker-compose build microservice_user_fpm
This can take a few minutes. Xdebug will be installed once this is finished.
Now it is time to set up Xdebug on our favorite IDE. As we said before, we will use PHPStorm, but feel free to use any other IDE.
We have to create a server on the IDE, in PHPStorm this is done by navigating to Preferences | Languages & Frameworks | PHP. So, add a new one and set the name to users, for example, host to localhost, port to 8084, and debugger to xdebug. It is also necessary to enable Use path mappings in order to map our routes.
Now, we need to navigate to Tools | DBGp proxy- configuration and ensure that the IDE key field is set to PHPSTORM, Host to users (this name must be the same one you entered on the servers section), and Port to 9000.
Stop and start Docker by executing the following commands:
docker-compose stop
docker-compose up -d
Set PHPStorm to be able to listen to the debugger:
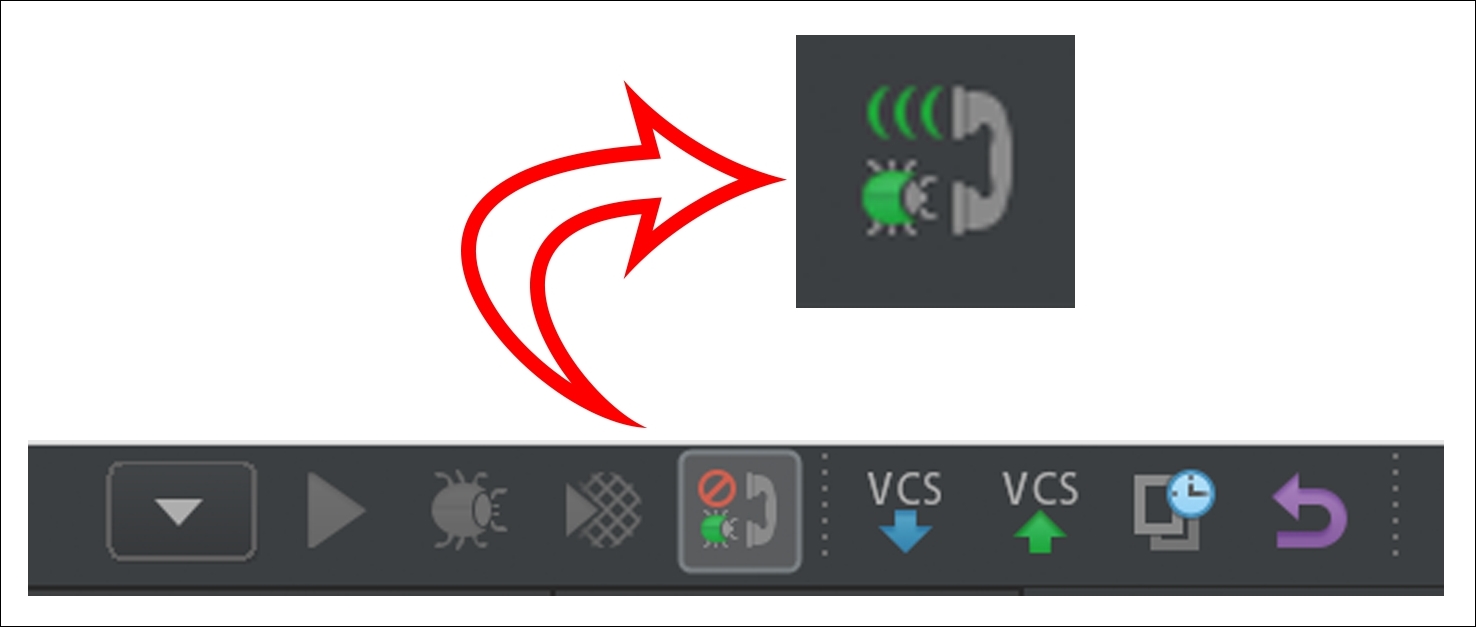
Xdebug button to listen to connections in PHPStorm
Now you are ready to view the debugger results. You just have to set the breakpoints in your code and the execution will stop at that point, giving you all the data values. To do this, go to your code, for example, on the UserController.php file, and click on the left side of a line. It will create a red point; this is a breakpoint:
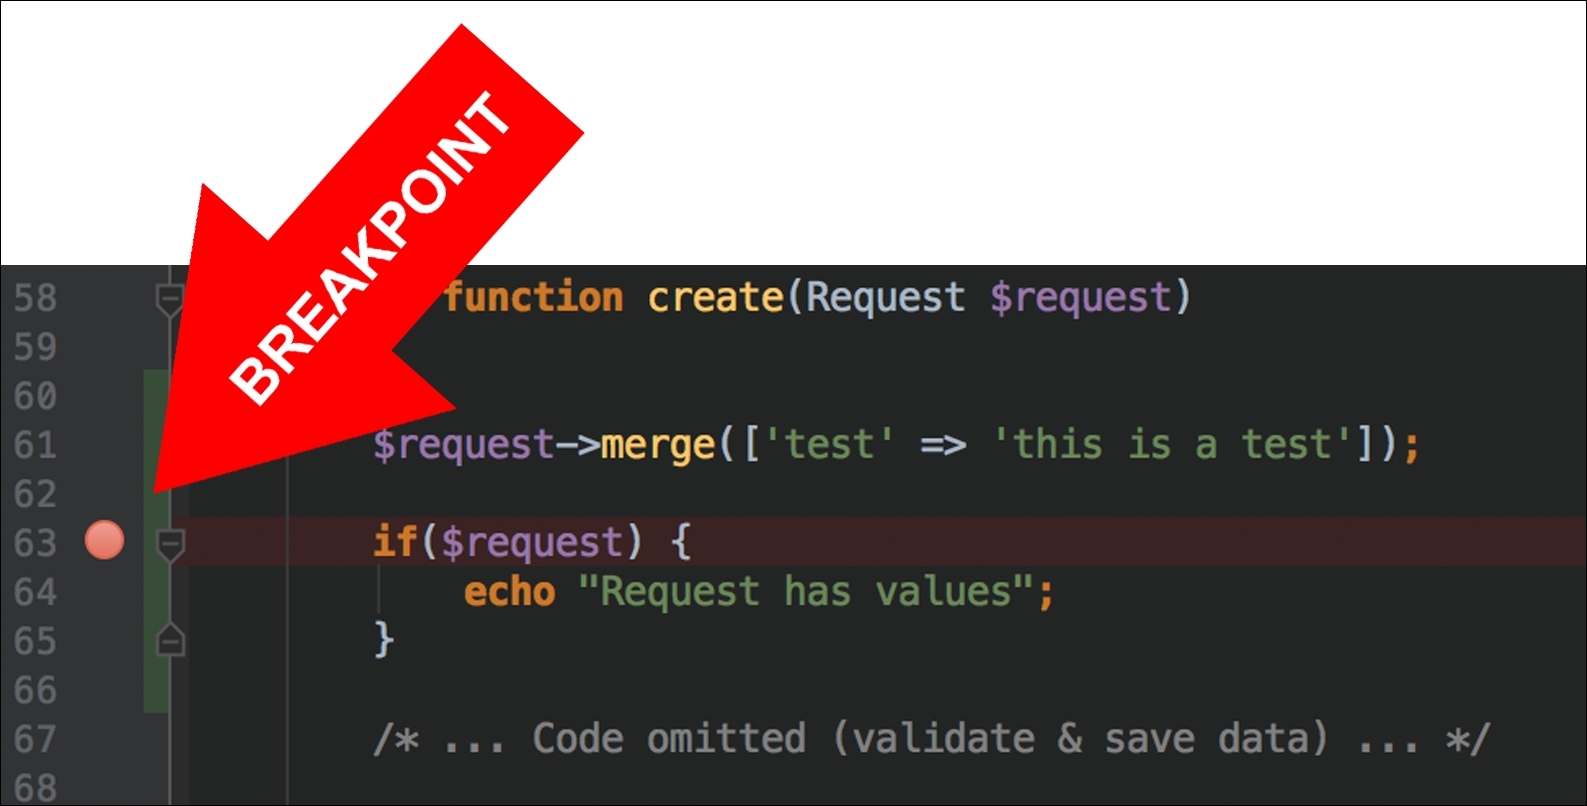
Breakpoint in PHPStorm
Now, you have the breakpoint set and the debugger running, so it is time to make a call with Postman to try the debugger. Give the breakpoint a try by executing a POST call to http://localhost:8084/api/v1/user with the api_key = RSAy430_a3eGR and XDEBUG_SESSION_START = PHPSTORM parameters. The execution will stop at the breakpoint and, from there, you have the execution control:

Debugger console in PHPStorm
Note that you have all the current values for the parameters on the variables side. In this case, you can see the test parameter set to "this is a test"; we assigned this value two lines before the breakpoint.
As we said, now we have control of the execution; the three basic functions are as follows:
- Step over: This continues the execution with the following line.
- Step into: This continues the execution inside a function.
- Step out: This continues the execution outside a function.
All these basic functions are executed step by step, so it will stop in the next line, it does not need any other breakpoints.
As you can see, this is very useful to find errors in your code.
Once we have Xdebug installed, we just need to add the following lines on the docker/microservices/user/php-fpm/Dockerfile file to enable the profiling:
RUN apt-get update && apt-get upgrade -y && apt-get autoremove -y
&& apt-get install -y git libmcrypt-dev libpng12-dev libjpeg-dev libpq-dev mysql-client curl
&& rm -rf /var/lib/apt/lists/*
&& docker-php-ext-configure gd --with-png-dir=/usr --with-jpeg-dir=/usr
&& docker-php-ext-install mcrypt gd mbstring pdo pdo_mysql zip
&& pecl install xdebug
&& rm -rf /tmp/pear
&& echo "zend_extension=$(find /usr/local/lib/php/extensions/ -name xdebug.so)n" >> /usr/local/etc/php/conf.d/xdebug.ini
&& echo "xdebug.remote_enable=onn" >> /usr/local/etc/php/conf.d/xdebug.ini
&& echo "xdebug.remote_autostart=offn" >> /usr/local/etc/php/conf.d/xdebug.ini
&& echo "xdebug.remote_port=9000n" >> /usr/local/etc/php/conf.d/xdebug.ini
&& echo "xdebug.profiler_enable=onn" >> /usr/local/etc/php/conf.d/xdebug.ini
&& echo "xdebug.profiler_output_dir=/var/www/html/tmpn" >> /usr/local/etc/php/conf.d/xdebug.ini
&& echo "xdebug.profiler_enable_trigger=onn" >> /usr/local/etc/php/conf.d/xdebug.ini
&& curl -sS https://getcomposer.org/installer | php -- --install-dir=/usr/local/bin --filename=composer
With profiler_enable, we enable the profiler and the output directory is set by profiler_output_dir. This directory should exist on our user microservice in order to get the profiler output files. So, if it is not yet created, do it now on /source/user/tmp.
Now, you can make the build in order to install everything necessary to debug by executing the following command:
docker-compose build microservice_user_fpm
This can take a few minutes. Xdebug will be installed once this is finished.
It does not need to be set up, so just stop and start Docker by executing the following commands:
docker-compose stop
docker-compose up -d
Set PHPStorm to be able to listen to the debugger as we did with the debugger.
To generate the profiling file, we need to execute a call as we did before with Postman, so feel free to execute the method you want. It will generate a file located on the folder we made before with name cachegrind.out.XX.
If you open this file, you will note that it is difficult to understand, but there are some tools to read this type of content. PHPStorm has a tool located on Tools | Analyze Xdebug Profiler Snapshot. Once you open it, you can select the file to analyze and then the tool will show you a detailed analysis of all the files and functions executed in the call. Displaying the time spent, times called, and other interesting things are very useful to optimize your code and find bottlenecks.