
In software development, application monitoring can be defined as the process which ensures that our application performs in an expected manner. This process allows us to measure and evaluate the performance of our application and can be helpful to find bottlenecks or hidden issues.
Application monitoring is usually made through a specialized software that gathers metrics from the application or the infrastructure that runs your software. These metrics can include CPU load, transaction times, or average response times among others. Anything you can measure can be stored in your telemetry system so you can analyze it later.
Monitoring a monolithic application is easy; you have everything in one place, all logs are stored in the same place, all metrics can be gathered from the same host, you can know if your PHP thread is killing your server. The main difficulty you may find is finding the part of your application that is underperforming, for example, which part of your PHP code is wasting your resources.
When you work with microservices, you have your code split into logical parts, allowing you to know which part of the application is underperforming, but at a big cost. You have all your metrics segregated between different containers or servers, making it difficult to have a big picture of the overall performance. By having a telemetry system in place, you can send all your metrics to the same location, making it easier to check and debug your application.
As a developer, you need to know how your application is performing at all the levels, from the top level that is your application to the bottom that is the hardware or hypervisor level. In an ideal world, we will have control over all the levels, but the most probable scenario is that you will only be able to monitor up to the infrastructure level.
The following image shows you the different layers and the relation with the server stack:
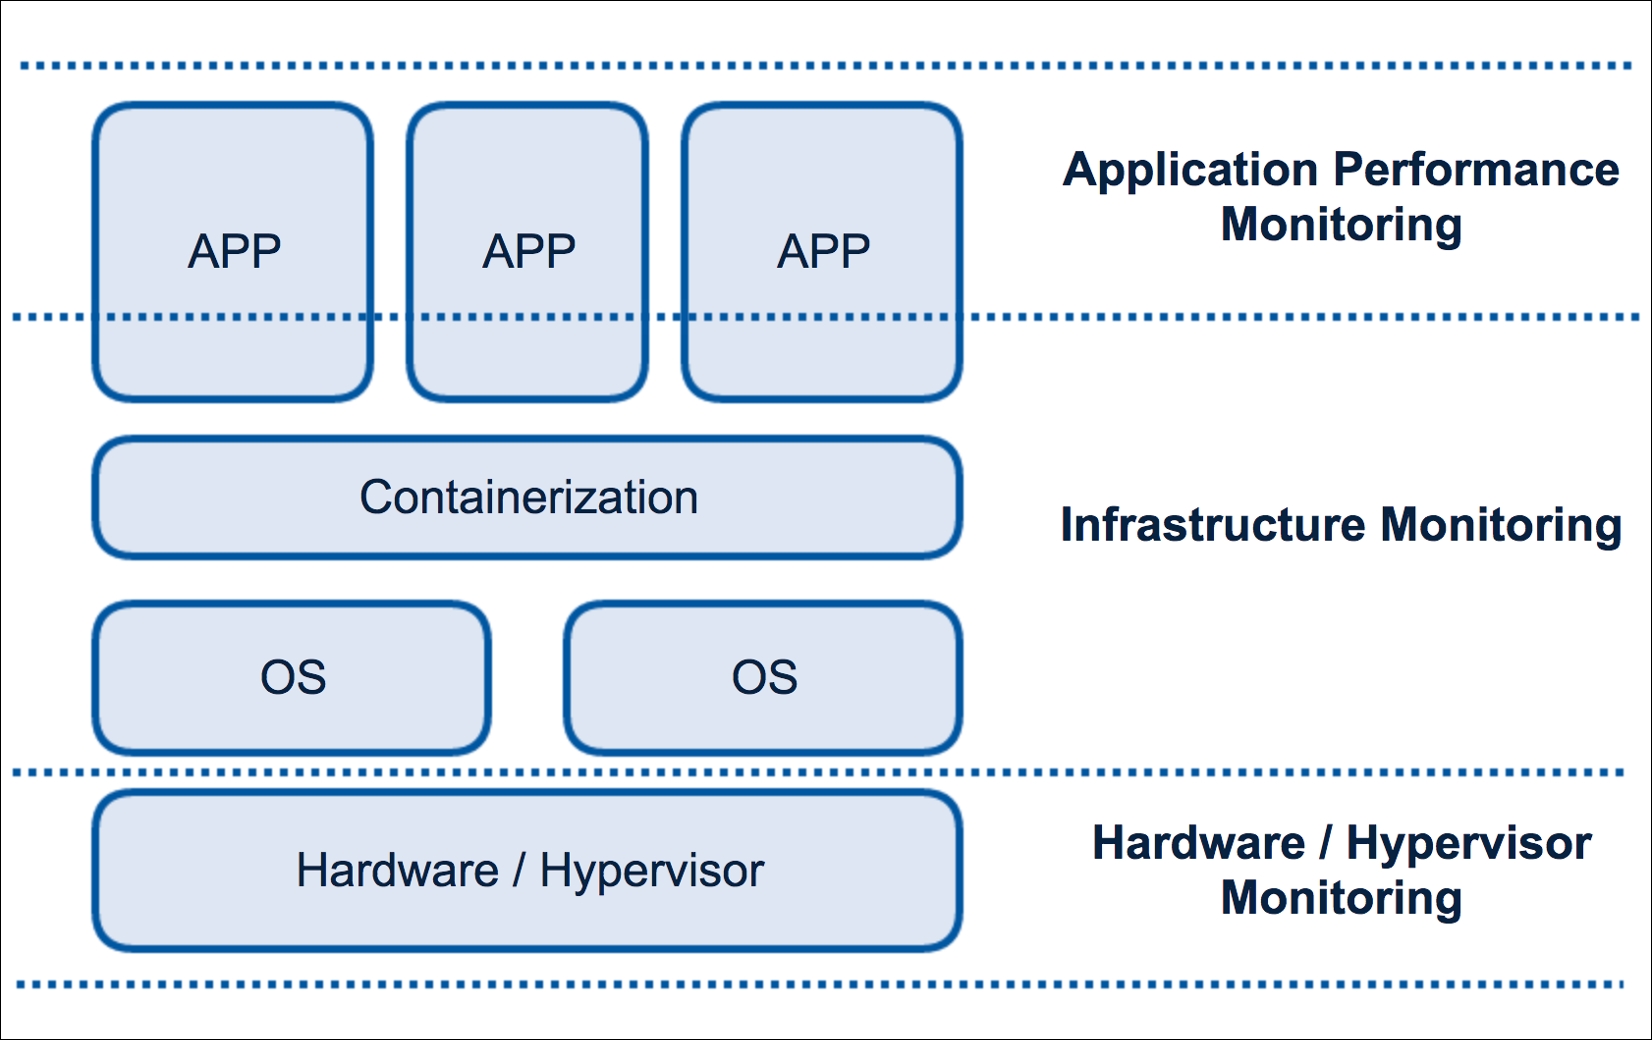
Monitoring layers
Application level lives inside your application; all the metrics are generated by your code, in our case by PHP. Unfortunately, you can’t find free or open source tools for Application Performance Monitoring (APM) exclusively for PHP. In any case, you can find interesting third-party services with free plans to give it a try.
Two of the most well-known APM services for PHP are New Relic and Datadog. In both the cases, the installation follows the same path--you install an agent (or library) on your container/host and this small piece of software will start sending the metrics to its service, giving you a dashboard where you can manipulate your data. The main disadvantage of using third-party services is that you don’t have any control over this agent or metric system, but this disadvantage can be transformed into a plus point--you will have a reliable system that you don’t need to manage, you only need to worry about your application.
The installation of the Datadog client could not be easier. Open the composer.json of one of your microservices and drop the following line inside the required definitions:
"datadog/php-datadogstatsd": "0.3.*"
As soon as you save your changes and make a composer update, you will be able to use the Datadogstatsd class in your code and start sending metrics.
Imagine that you want to monitor the time your secret microservice spends getting all the servers you have in your database. Open the app/Http/Controllers/SecretController.php file of your secret microservice and modify your class, as follows:
    use Datadogstatsd;

    /** … Code omitted ... **/
    const APM_API_KEY = 'api-key-from-your-account';
    const APM_APP_KEY = 'app-key-from-your-account';

    public function index(Manager $fractal, SecretTransformer
    $secretTransformer, Request $request)
    {
      Datadogstatsd::configure(self::APM_API_KEY, self::APM_APP_KEY);
      $startTime = microtime(true);
      $records = Secret::all();

      $collection = new Collection($records, $secretTransformer);
      $data = $fractal->createData($collection)->toArray();
      Datadogstatsd::timing('secrets.loading.time', microtime(true) -
      $startTime, [‘service’ => ‘secret’]);

      return response()->json($data);
    }
The preceding piece of code defines your app and API keys of your Datadog account and we used them to set up our Datadogstatsd interface. The example logs the time spent retrieving all our secret records. The Datadogstatsd::timing() method will send the metric to our external telemetry service. Doing the monitoring inside your application allows you to decide the places of your code you want to generate metrics in. There is no rule of thumb when you are monitoring this level, but you need to remember that it is important to know where your application spends most of its time, so add metrics in each place of your code that you think could be a bottleneck (like getting data from another service or from a database).
With this library, you can even increment and decrement custom metric points with the following method:
    Datadogstatsd::increment('another.data.point');
    Datadogstatsd::increment('my.data.point.with.custom.increment', .5);
    Datadogstatsd::increment('your.data.point', 1, ['mytag’' => 'value']);
The three of them increase a point: the first increments another.data.point in one unit, the second one increments our point by 0.5, and the third one increments the point and also adds a custom tag to the metric record.
You can also decrement points with Datadogstatsd::decrement(), which has the same syntax as ::increment().
This level controls everything between the OS and your application. Adding a monitoring system to this layer allows you to know if your container is using too much memory, or if the load of a specific container is too high. You can even track some basic metrics of your application.
There are multiple options to monitor this layer in the high street, but we will give you a sneak peek at two interesting projects. Both of them are open source and even though they use different approaches, you can combine them.
Prometheus is an open source monitoring and alerting toolkit that was created at SoundCloud and is under the umbrella of the Cloud Native Computing Foundation. Being the new kid on the block doesn't mean that it doesn't have powerful features. Among others, we can highlight the following main features:
- Time series collection through pull over HTTP
- Target discovery via service discovery (kubernetes, consul, and so on) or static config
- Web UI with simple graphing support
- Powerful query language that allows you to extract all the information you need from your data
Installing Prometheus is very easy with Docker, we only need to add a new container for our telemetry system and link it with our autodiscovery service (Consul). Add the following lines to the docker-compose.yml file:
    telemetry:
      build: ./telemetry/
      links:
        - autodiscovery
      expose:
        - 9090
      ports:
        - 9090:9090
In the preceding code, we only tell Docker where the Dockerfile is located, link the container without autodiscovery container, and expose and map some ports. Now, it's time to create the telemetry/Dockerfile file with the following content:
FROM prom/prometheus:latest
ADD ./etc/prometheus.yml /etc/prometheus/
As you can see, it does not take a lot to create our telemetry container; we are using the official image and adding our Prometheus configuration. Create the etc/prometheus.yml configuration with the following content:
    global:
      scrape_interval: 15s
      evaluation_interval: 15s
      external_labels:
      monitor: 'codelab-monitor'

    scrape_configs:
      - job_name: 'containerpilot-telemetry'

    consul_sd_configs:
      - server: 'autodiscovery:8500'
      services: ['containerpilot']
Again, the setup is very easy as we are defining some global scrapping intervals and one job called containerpilot-telemetry that will use our autodiscovery container and monitor all the services stored in consul announced under the containerpilot name.
Prometheus has a simple and powerful web UI. Open your localhost:9090 and you have access to all the metrics gathered by this tool. Creating a graph is very easy, choose a metric and Prometheus will do all the work for you:
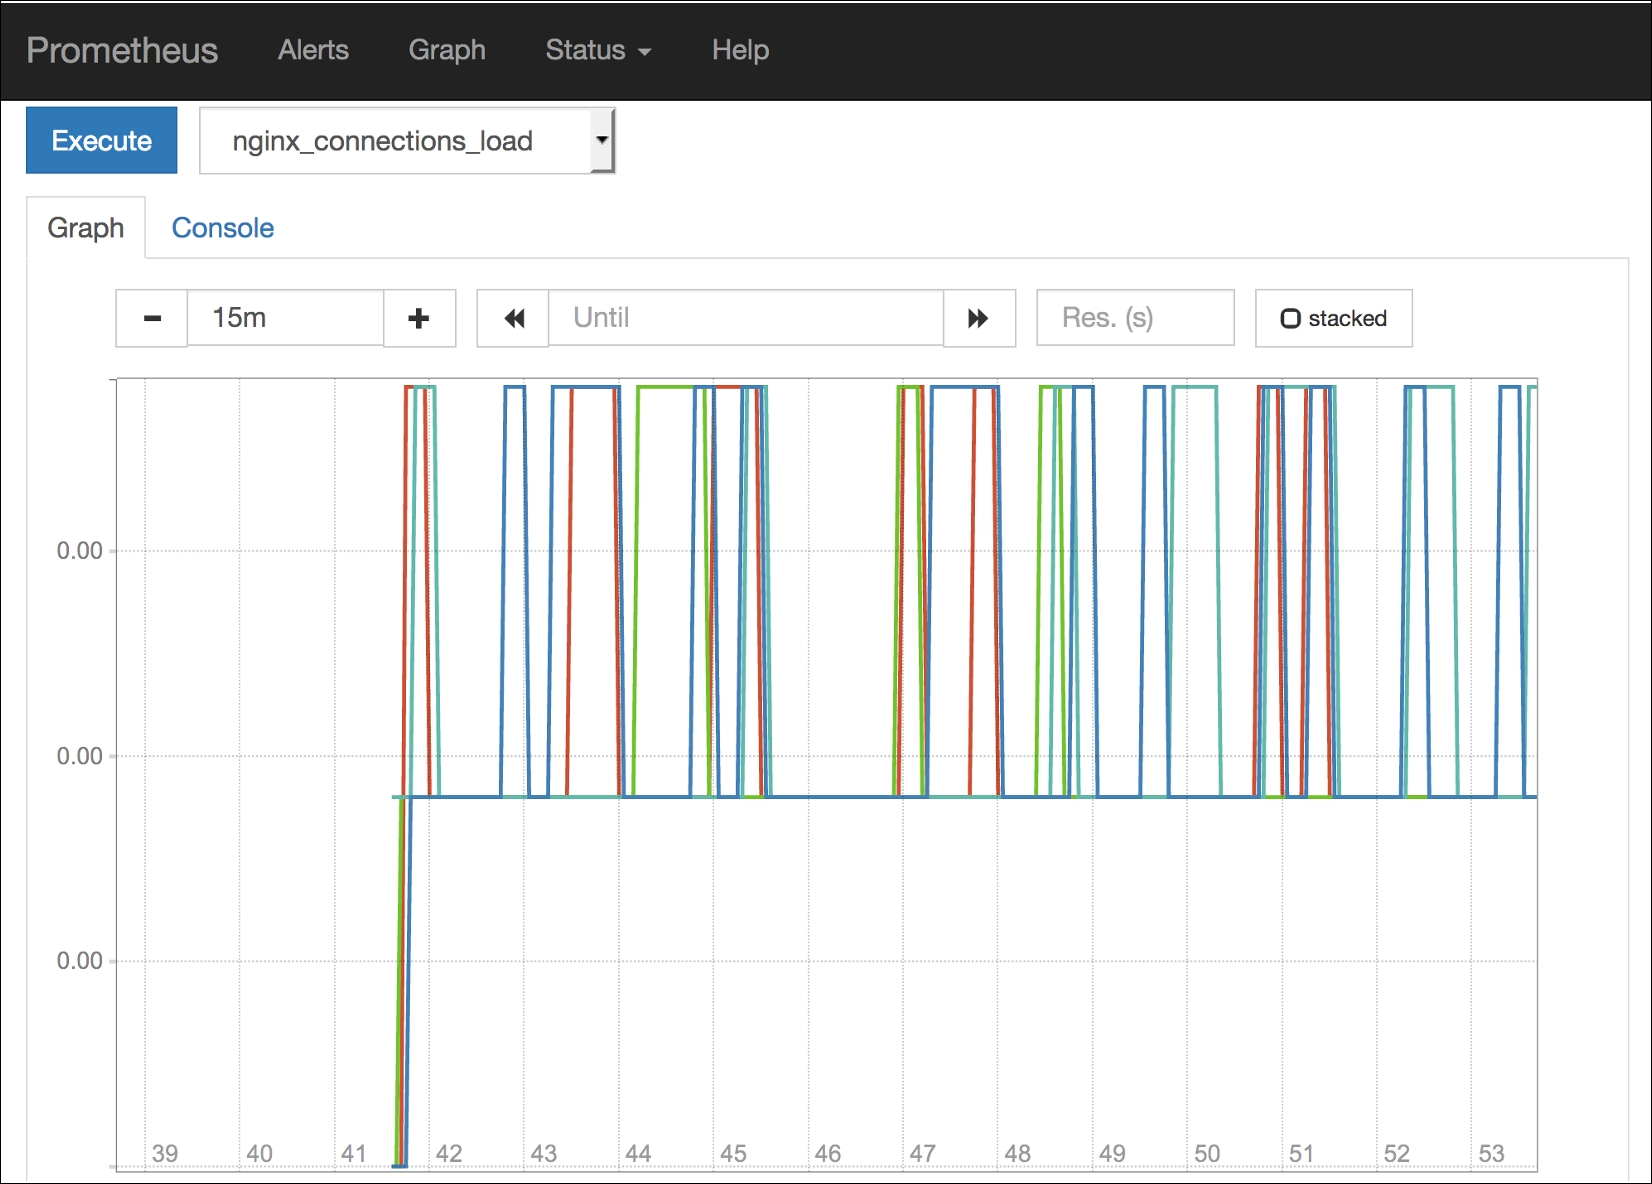
Prometheus graph UI
At this point, you will probably be wondering how you can declare metrics. In the earlier chapters, we introduced containerpilot, a tool we will use as a PID in our containers to manage our autodiscovery. The containerpilot has the ability to declare metrics to be available for the supported telemetry systems, in our case Prometheus. If you open, for example, the docker/microservices/battle/nginx/config/containerpilot.json file, you can find something similar to the following code:
    "telemetry": {
      "port": 9090,
      "sensors": [
        {
          "name": "nginx_connections_unhandled_total",
          "help": "Number of accepted connnections that were not
                   handled",
          "type": "gauge",
          "poll": 5,
          "check": ["/usr/local/bin/sensor.sh", "unhandled"]
        },
        {
          "name": "nginx_connections_load",
          "help": "Ratio of active connections (less waiting) to the
                   maximum worker connections",
          "type": "gauge",
          "poll": 5,
          "check": ["/usr/local/bin/sensor.sh", "connections_load"]
        }
      ]
    }
In the preceding piece of code, we are declaring two metrics: "nginx_connections_unhandled_total" and "nginx_connections_load". ContainerPilot will run the command defined in the "check" parameter inside the container and the result will be scrapped by Prometheus.
You can monitor anything in your infrastructure with Prometheus, even Prometheus itself. Feel free to change our basic installation and setup and adapt it to use the autopilot pattern. If the Prometheus’ web UI is not enough for your graphics and you need more power and control, you can easily link our telemetry system with Grafana, one of the most powerful tools out there to create dashboards with all kinds of metrics.
Weave Scope is a tool used for monitoring your containers, it works well with Docker and Kubernetes and has some interesting features that will make your life easier. Scope gives you a deep top-down view of your app and your entire infrastructure. With this tool, you can diagnose any problems in your distributed containerized application, and everything in real time.
Forget about complex configurations, Scope automatically detects and starts monitoring every host, Docker container, and any process running in your infrastructure. As soon as it gets all this information, it creates a nice map showing the inter-communications between all your containers in real time. You can use this tool to find memory issues, bottlenecks, or any other problems. You can even check different metrics of a process, container, service, or host. A hidden feature you can find in Scope is the ability to manage containers, view logs, or attach a terminal, all from the browser UI.
There are two options to deploy Weave Scope: in a standalone mode where all the components run locally or as a paid cloud service where you don't need to worry about anything. The standalone mode runs as a privileged container inside each one of your infrastructure servers and has the ability to correlate all the information from your cluster or servers and display it in the UI.
The installation is very easy--you only need to run the following commands on each one of your infrastructure servers:
sudo curl -L git.io/scope -o /usr/local/bin/scope
sudo chmod a+x /usr/local/bin/scope
scope launch
As soon as you have Scope launched, open the IP address of your server (localhost if you are working locally like us) http://localhost:4040, and you will see something similar to the following screenshot:
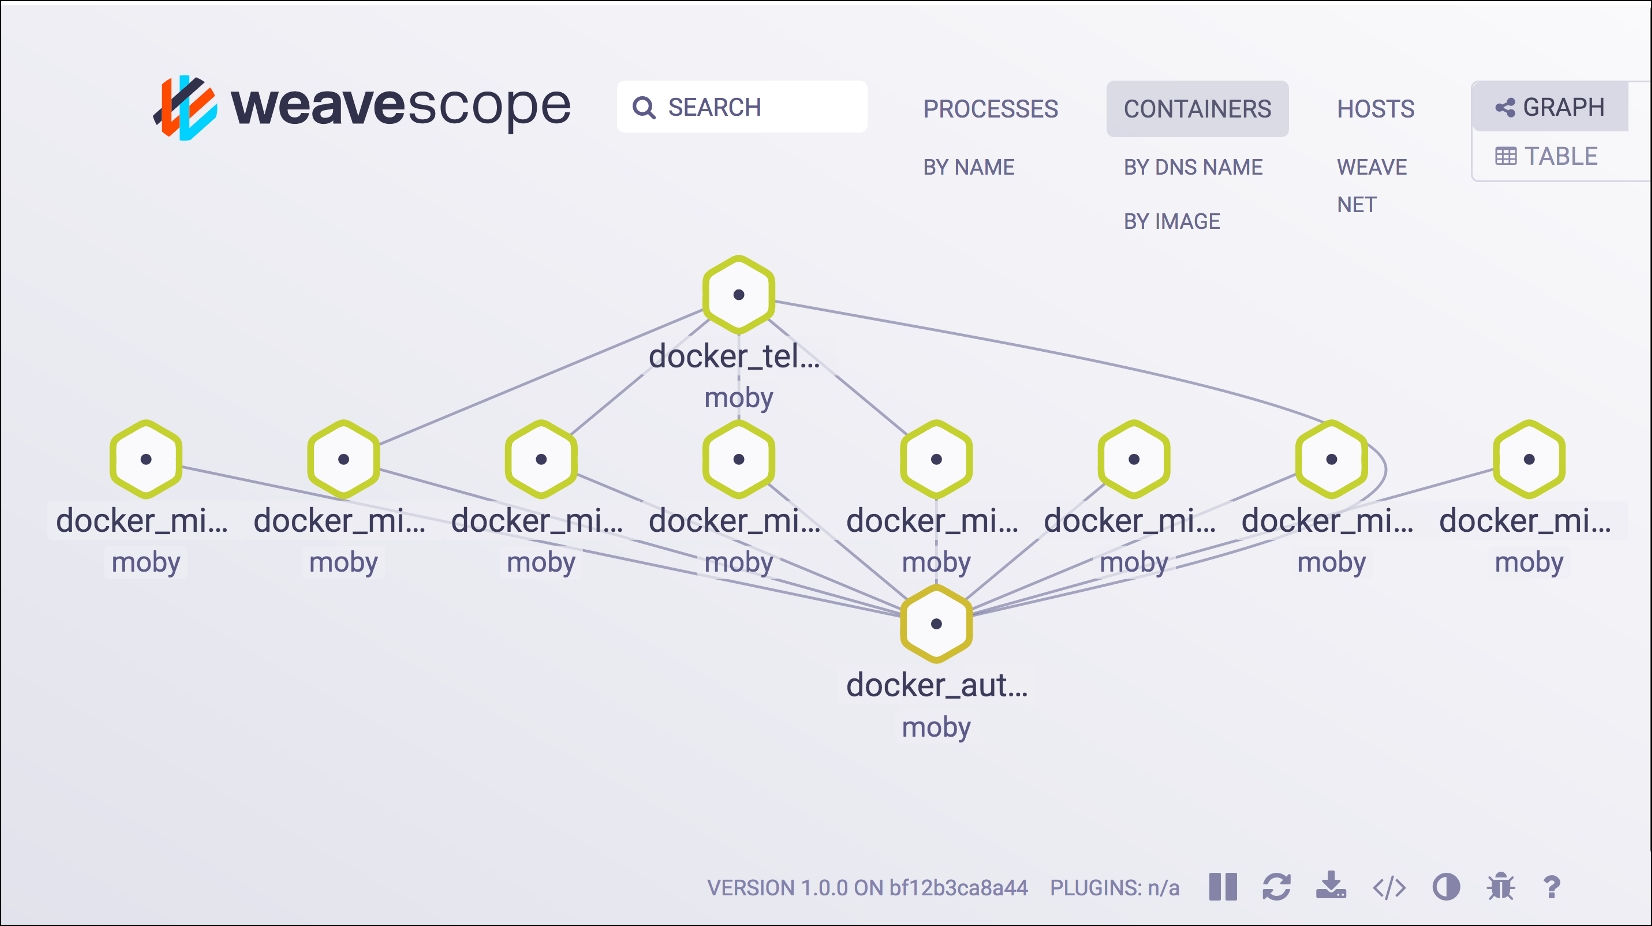
Weave Scope containers graph visualization
The preceding image is a snapshot of the application we are building; here, you can see all our containers and the connections between them in a specific moment in time. Give it a try and while you make some calls to our different API endpoints, you will be able to see the connections between containers changing.
Can you find any problems in our microservices infrastructure? If so, you are correct. As you can see, we didn't connect some of our containers to the autodiscovery service. Scope helped us find a possible future problem, now feel free to fix it.
As you can see, you can use Scope to monitor your app from a browser. You only need to be careful with who has access to the privileged Scope container; if you have plans to use Scope in production, ensure that you limit the access to this tool.
This layer matches our hardware or hypervisor level and is the lowest place where you can place your metrics. The maintenance and monitoring of this layer is usually done by sysadmins and they can use very well-known tools, such as Zabbix or Nagios. As a developer, you will probably not be worried about this layer. If you deploy the application in a cloud environment, you will not have any kind of access to the metrics generated by this layer.