
Chapter 4 Creating the Project Schedule
THE PMP® EXAM CONTENT FROM THE PLANNING PERFORMANCE DOMAIN COVERED IN THIS CHAPTER INCLUDES THE FOLLOWING:
✓ Task 4: Develop the project schedule based on the approved project deliverables and milestones, scope, and resource management plans in order to manage timely completion of the project.
✓ Knowledge and Skills:
Time management planning, including scheduling tools and techniques
Workflow diagramming techniques
The Planning process group has more processes than any other process group. As a result, a lot of time and effort goes into the Planning processes of any project. On some projects, you might spend almost as much time planning the project as you do executing and controlling it. This isn’t a bad thing. The better planning you do up front, the more likely you’ll have a successful project. Speaking of planning, together the Planning, Executing, and Monitoring and Controlling process groups account for almost 70 percent of the PMP® exam questions, so plan on spending about the same percentage of your study time on these areas.
This is another fun-filled, action-packed chapter. We’ll start off by defining the schedule management plan and then move on to the activities that become the work of the project. The WBS will come in handy here, so keep it close. Then we’ll sequence the activities in their proper order, estimate the resources we’ll need to complete the work, and estimate how long each activity will take. Last but not least, we’ll develop the project schedule.
Everything you’ve done up to this point and the processes we’ll discuss in this chapter will help you create an accurate project schedule. You’ll use these documents (along with several other documents you’ve created along the way) throughout the Executing and Monitoring and Controlling processes to help measure the progress of the project. Let’s get going.
NOTE
The process names, inputs, tools and techniques, outputs, and descriptions of the project management process groups and related materials and figures in this chapter are based on content from A Guide to the Project Management Body of Knowledge (PMBOK® Guide), Fifth Edition (PMI, 2013).
Creating the Schedule Management Plan
The Plan Schedule Management process describes how the project schedule will be developed, executed, and controlled as well as how changes will be incorporated into the project schedule. According to A Guide to the Project Management Body of Knowledge (PMBOK® Guide), Fifth Edition, the primary benefit of this process is that it helps guide and direct how the project schedule will be managed. The only output of this process is the schedule management plan. Let’s first look at the inputs and the tools and techniques of this process and spend most of our time examining the schedule management plan itself.
The inputs of this process include the project management plan, project charter, enterprise environmental factors, and organizational process assets. The project management plan includes the scope baseline, which in turn is made up of the project scope statement, WBS, and WBS dictionary. The project schedule will be derived from the WBS (which includes deliverables and work package levels), so the scope baseline is key to defining the processes you’ll use to develop the schedule management plan.
Enterprise environmental factors include the culture of the organization and availability of resources as well as the project management software and work authorization system the organization uses to assign and track work components. The organizational process assets that are important to this process are templates, change control processes, historical information, policies and guidelines for schedule control, control tools for managing schedules, and risk control processes and procedures.
We have seen all of the tools and techniques before. They are expert judgment, analytical techniques, and meetings.
The key to this process, as I stated earlier, is the schedule management plan, which is an element of the project management plan. It is the only output of this process, and it serves to describe how the project schedule will be developed, monitored, controlled, and changed. According to the PMBOK® Guide, several elements make up the schedule management plan. Be certain to review all of them. I have highlighted the most important elements here:
Schedule Model Development This refers to the methodologies and tools you’ll use to develop the schedule (for example, Oracle Primavera or Microsoft Project), along with the data they contain.
Accuracy Levels This element describes the rounding you’ll use when deriving activity duration estimates. For example, you might round to the nearest week, day, or hour depending on the complexity of the project.
Units of Measure This element also concerns activity duration estimates as well as schedule activities. This describes what measure you’ll use when developing the schedule, such as hours, days, weeks, or some other measure.
Control Thresholds Control thresholds refer to the level of variance the schedule can experience before you take action. Again, depending on the complexity of the project, this might be a generous amount of time or a very limited amount of time. You can express thresholds in terms of hours or days (as an example, a slippage of greater than three days requires action) or, most typically, as a percentage of time.
Performance Measurement Rules This refers to where and what types of measures you’ll use to verify schedule performance. This could include designating levels on the WBS and/ or determining what type of earned value measurement technique you’ll use.
Defining Activities
Now you’re off and running toward the development of your project schedule. To develop the schedule, you first need to define the activities, sequence them in the right order, estimate resources, and estimate the time it will take to complete the tasks. I’ll cover the Define Activities process here and the Sequence Activities process next, and I’ll pick up with the estimating processes in the next chapter.
NOTE
Define Activities and Sequence Activities are separate processes, each with its own inputs, tools and techniques, and outputs. In practice, especially for small to medium-sized projects, you can combine the Create WBS process we talked about in Chapter 3, “Developing the Project Scope Statement,” with these processes and complete them all at once.
The Define Activities process is a further breakdown of the work package elements of the WBS. It documents the specific activities needed to fulfill the deliverables detailed on the WBS and the project scope statement. Much as with the work package level of the WBS, activities can be easily assigned, estimated, scheduled, and controlled. The Define Activities process might be performed by the project manager, or when the WBS is broken down to the subproject level, this process (and all the activity-related processes that follow) might be assigned to a subproject manager.
Define Activities Process Inputs
The following are inputs (including the key elements of each input) to the Define Activities process:
Schedule management plan
Scope baseline (including deliverables, constraints, and assumptions)
Enterprise environmental factors (project management information systems, organizational culture, published commercial databases)
Organizational process assets (existing guidelines and policies, templates, lessons learned knowledge base, and historical information)
Tools and Techniques for Defining Activities
The tools and techniques of the Define Activities process are as follows:
Decomposition
Rolling wave planning
Expert judgment
We covered most of these topics in the previous chapter. Decomposition in this process involves breaking the work packages into smaller, more manageable units of work called activities. These are not deliverables but the individual units of work that must be completed to fulfill the work packages and the deliverables listed in the WBS. Activities will help in later Planning processes to define estimates and create the project schedule. Activity lists (which are one of the outputs of this process) from prior projects can be used as templates in this process. Rolling wave planning involves planning near-term work in more detail than future-term work. As we discussed in Chapter 3, this is a form of progressive elaboration. Expert judgment, in the form of project team members with prior experience developing project scope statements and WBSs, can help you define activities.
Define Activities Outputs
Define Activities has three outputs:
Activity list
Activity attributes
Milestone list
We’ll look at each of these outputs next.
Activity List
One primary output of the Define Activities process is an activity list. The activity list should contain all the schedule activities that will be performed for the project, with a scope of work description of each activity and an identifier (such as a code or number) so that team members understand what the work is and how it is to be completed. The schedule activities are individual elements of the project schedule, and the activity list document is part of the project documents. To keep your sanity, and that of your team members, make certain to enter the activity names onto the schedule the same way they appear on the activity list.
Activity Attributes
Activity attributes describe the characteristics of the activities and are an extension of the activity list. Activity attributes will change over the life of the project as more information is known. In the early stages of the project, activity attributes might include the activity ID, the WBS identification code it’s associated with, and the activity name. As you progress through the project and complete other Planning processes, you might add predecessor and successor activities, logical relationships, leads and lags, resource requirements, and constraints and assumptions associated with the activity. We’ll cover these topics throughout the remainder of this chapter.
The activity attributes are used as input to several processes, including the Develop Schedule process that we’ll talk about in the section “Developing the Project Schedule” later in this chapter.
NOTE
In practice, I like to tie the activity list to the WBS. Remember from Chapter 3 that each WBS element has a unique identifier, just like the activities in the activity list. When recording the identifier code for the activity list, I’ll use a system whereby the first three or four digits represent the WBS element the activity is tied to and the remaining digits refer to the activity itself.
Milestone Lists
Milestones are typically major accomplishments of the project and mark the completion of major deliverables or some other key event in the project. For example, approval and sign-off on project deliverables might be considered milestones. Other examples might be the completion of a prototype, system testing, contract approval, and so on. The milestone list records these accomplishments and documents whether the milestone is mandatory or optional. The milestone list is part of the project documentation and is also used to help develop the project schedule.
Understanding the Sequence Activities Process
Now that you’ve identified the schedule activities, you need to sequence them in a logical order and find out whether dependencies exist among the activities. The interactivity of logical relationships must be sequenced correctly in order to facilitate the development of a realistic, achievable project schedule.
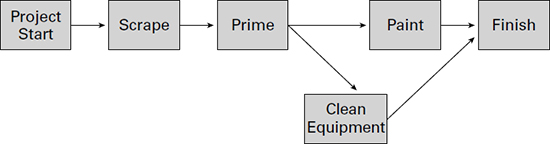
Consider a classic example. Let’s say you’re going to paint your house, but unfortunately, it’s fallen into a little disrepair. The old paint is peeling and chipping and will need to be scraped before a coat of primer can be sprayed on the house. After the primer dries, the painting can commence. In this example, the primer activity depends on the scraping. You can’t—okay, you shouldn’t—prime the house before scraping off the peeling paint. The painting activity depends on the primer activity in the same way. You really shouldn’t start painting until the primer has dried.
During Sequence Activities, you will use a host of inputs and tools and techniques to produce the primary output and project schedule network diagrams. You’ve already seen all the inputs to this process. They are the schedule management plan, activity list, activity attributes, milestone list, project scope statement, enterprise environmental factors, and organizational process assets. We’ll look at several new tools and techniques next.
Sequence Activities Tools and Techniques
Sequence Activities has three tools and techniques, all of which are new to you:
Precedence diagramming method (PDM)
Dependency determination
Leads and lags
I’ll switch the order of these and cover dependency determination first. In practice, you’ll define dependencies either before or while you’re using the PDM to draw your schedule network. To make sure you’re on the same page with the PMBOK® Guide terminology regarding dependencies, I’ll cover them first and then move on to the other tools and techniques.
Dependency Determination
Dependencies are relationships between the activities in which one activity is dependent on another to complete an action, or perhaps an activity is dependent on another to start an action before it can proceed. Dependency determination is a matter of determining where those dependencies exist. Thinking back to the house-painting example, you couldn’t paint until the scraping and priming activities were completed. You’ll want to know about four types of dependencies for the exam:
Mandatory dependencies
Discretionary dependencies
External dependencies
Internal dependencies
As you’ve probably guessed, the PMBOK® Guide defines dependencies differently depending on their characteristics:
Mandatory Dependencies Mandatory dependencies, also known as hard logic or hard dependencies, are defined by the type of work being performed. The scraping, primer, and painting sequence is an example of mandatory dependencies. The nature of the work itself dictates the order in which the activities should be performed. An activity with physical limitations is a telltale sign that you have a mandatory dependency on your hands.
Discretionary Dependencies Discretionary dependencies are defined by the project team. Discretionary dependencies are also known as preferred logic, soft logic, or preferential logic. These are usually process- or procedure-driven or “best-practice” techniques based on past experience. For example, both past experience and best practices on house-painting projects have shown that all trim work should be hand-painted whereas the bulk of the main painting work should be done with a sprayer.
External Dependencies External dependencies are, well, external to the project. This might seem obvious, but the PMBOK® Guide points out that even though the dependency is external to the project (and, therefore, a nonproject activity), it impacts project activities. For example, perhaps your project is researching and marketing a new drug. The FDA must approve the drug before your company can market it. This is not a project activity, but the project cannot move forward until approval occurs. That means FDA approval is an external dependency.
Internal Dependencies Internal dependencies, another somewhat obvious dependency, are internal to the project or the organization. They may, however, still be outside of your control. For example, perhaps before implementing a new time tracking system in your maintenance shop, the operations department has decided to study the business rules regarding time tracking. Examining and updating the business rules and processes needs to be completed before the time tracking system can be installed and your project can proceed.
Once you’ve identified the dependencies and assembled all the other inputs for the Sequence Activities process, you’ll take this information and produce a diagram—or schematic display—of the project activities. The project schedule network diagram shows the dependencies—or logical relationships—that exist among the activities. You can use one of the other tools and techniques of this process to produce this output. You’ll now examine each in detail.
Precedence Diagramming Method (PDM)
The precedence diagramming method (PDM) is what most project management software programs use to sequence activities. Precedence diagrams use boxes or rectangles (called nodes) to represent the activities. The nodes are connected with arrows showing the dependencies between the activities. This method is also called activity on node (AON).
The minimum information that should be displayed on the node is the activity name, but you might put as much information about the activity on the node as you’d like. Sometimes the nodes are displayed with activity name, activity number, start and stop dates, due dates, slack time, and so on. (I’ll cover slack time in the section “Develop Schedule Tools and Techniques” later in this chapter.)
Figure 4.1 shows a PDM—or AON—of the house-painting example.
FIGURE 4.1 Example of a PDM or AON
The PDM is further defined by four types of logical relationships. The terms dependencies and precedence relationships also are used to describe these relationships. You might already be familiar with these if you’ve used Microsoft Project or similar project management software. The four dependencies, or logical relationships, are as follows:
Finish-to-Start (FS) The finish-to-start relationship is the most frequently used relationship. This relationship says that the predecessor—or from activity—must finish before the successor—or to activity—can start. In PDM diagrams, this is the most often used logical relationship.
Start-to-Finish (SF) The start-to-finish relationship says that the predecessor activity must start before the successor activity can finish. This logical relationship is seldom used.
Finish-to-Finish (FF) The finish-to-finish relationship says that the predecessor activity must finish before the successor activity finishes.
Start-to-Start (SS) I think you’re getting the hang of this. The start-to-start relationship says that the predecessor activity must start before the successive activity can start.
Keep these logical relationships (or dependencies) in mind when constructing your project schedule network diagram.
Other Diagramming Methods
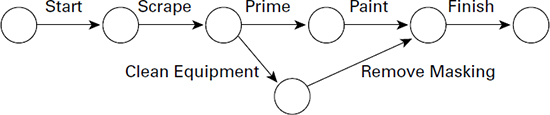
The arrow diagramming method (ADM) is not a listed tool and technique of the Sequence Activities process, but there is a possibility you could see a question on the exam regarding it. It’s an old technique that’s rarely used anymore, but nonetheless you should have some familiarity with it.
The ADM is visually the opposite of the PDM. The arrow diagramming method places activities on the arrows, which are connected to dependent activities with nodes. This method is also called activity on arrow (AOA) and activity on line (AOL). This technique isn’t used nearly as often as the PDM, but some industries prefer the ADM to the PDM. For the record, note that the ADM allows for more than one time estimate to determine duration and uses only the finish-to-start dependency. There’s one more unique note about the ADM to tuck away: Sometimes dummy activities must be plugged into the diagram to accurately display the dependencies. Dummy activities are commonly depicted using a dotted arrow.
Figure 4.2 shows the ADM method applied to the house-painting example.
FIGURE 4.2 Example of an ADM method
I recommend that you memorize the following graphic to help you remember the tools and techniques of the Sequence Activities process and their characteristics for the exam.
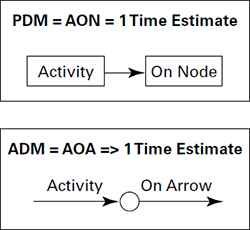
This might look a little strange, but I think it will work for you now that you understand what each of these diagramming methods is. This is information you need to know for the exam. If this graphic isn’t useful for you, come up with your own mnemonic or sample that will help you remember which of these is which. Don’t say I didn’t warn you.
There is one other diagramming method you could potentially see a question about on the exam. It’s called GERT, which stands for Graphical Evaluation and Review Technique. What you should know for the exam is that this diagramming method allows for conditions, branches, and loops.
Applying Leads and Lags
Leads and lags should be considered when determining dependencies. Lags occur when time elapses between two activities, which delays successor activities (those that follow a predecessor activity) from starting, and as a result, time is added either to the start date or to the finish date of the activity you’re scheduling. Leads, conversely, speed up the successor activities, and as a result, time needs to be subtracted from the start date or the finish date of the activity you’re scheduling.
Let’s revisit the house-painting example to put all this in perspective. In order to paint, you first need to scrape the peeling paint and then prime. However, you can’t begin painting until the primer has dried, so you shouldn’t schedule priming for Monday and painting for Tuesday if you need the primer to dry on Tuesday. Therefore, the priming activity generates the need for lag time at the end of the activity to account for the drying time needed before you can start painting.
Lead time works just the opposite. Suppose, for this example, you could start priming before the scraping is finished. Maybe certain areas on the house don’t require scraping, so you don’t need to wait until the scraping activity finishes to begin the priming activity. In this example, lead time is subtracted from the beginning of the priming activity so that this activity begins prior to the previous activity finishing.
NOTE
You might also use schedule network templates in this process. These are not a named tool and technique of this process but may come in handy on your next project. Schedule network templates are like the templates I’ve talked about in previous processes. Perhaps the project you’re working on is similar to a project that has been completed in the past. You can use a previous project schedule network diagram as a template for the current project. Or you might be working on a project with several deliverables that are fairly identical to projects you’ve performed in the past or the deliverables on the existing project are fairly similar; in that case, you can use the old schedule network diagrams, or even the same schedule network diagrams, as templates for the project. Templates can be used for certain portions of the project schedule or for the entire project. If you are using templates for portions of the project schedule, they are known as subnetwork templates or fragment network templates.
Sequence Activities Outputs
There are only two outputs of the Sequence Activities process: project schedule network diagrams and project documents updates. I’ve just spent a good deal of time describing the different types of project schedule network diagrams you can construct using the PDM or ADM techniques. You can generate project schedule network diagrams on a computer, or you can draw them by hand. Like the WBS, these diagrams are visual representations of the work of the project and might contain all the project details or they might contain only summary-level details, depending on the complexity of the project. Summary-level activities are a collection of related activities, also known as hammocks. Think of hammocks as a group of related activities rolled up into a summary heading that describes the activities likely to be contained in that grouping.
Keep in mind that the construction of these project schedule network diagrams might bring activities to light that you missed when defining your activity list, or it might make you break an activity down into two activities in places where you thought one activity might work. If this is the case, you will need to update the activity list and the activity attributes. The other project document update that may be required as a result of this process is an update to the risk register. (We’ll talk about the risk register in Chapter 6, “Risk Planning.”)
After the activities are sequenced, the next steps involve estimating the resources and estimating the durations of the activities so that they can be plugged into the project schedule. We’ll look at these topics in the next sections of this chapter.
Estimating Activity Resources
All projects, from the smallest to the largest, require resources. The term resources, in this case, does not mean just people; it means all the physical resources required to complete the project. The PMBOK® Guide defines resources as people, equipment, materials, and supplies. In reality, this includes people, equipment, supplies, materials, software, hardware—the list goes on depending on the project on which you’re working. The Estimate Activity Resources process is concerned with determining the types of resources needed (both human and materials) and in what quantities for each schedule activity within a work package.
NOTE
Remember, the activity resource requirements output from the Estimate Activity Resources process is an input to the Plan Human Resource Management process.
The PMBOK® Guide notes that Estimate Activity Resources should be closely coordinated with the Estimate Costs process (I’ll talk about Estimate Costs in Chapter 5, “Developing the Project Budget and Communicating the Plan”). That’s because resources—whether people or material or both—are typically the largest expense you’ll have on any project. Identifying the resources becomes a critical component of the project planning process so estimates—and ultimately the project budget—can be accurately derived. You’ll look at the inputs and tools and techniques that will help you document these requirements next.
Estimate Activity Resources Inputs
The Estimate Activity Resources process has several inputs, most of which you already know:
Schedule management plan
Activity list
Activity attributes
Resource calendars
Risk register
Activity cost estimates
Enterprise environmental factors
Organizational process assets
The only inputs you haven’t seen before are resource calendars, risk register, and activity cost estimates.
NOTE
Resource calendars are an output of the Acquire Project Team and Conduct Procurements processes. Both of these processes are performed during the Executing process group, so you may find this input perplexing here. However, you may have some resource availability information (resource calendars) on a preliminary basis during the Estimate Activity Resources process, and you’ll further define it when resources are assigned to the project later in the Executing processes. In practice, you may find that you perform the Acquire Project Team process during the later stages of the Planning portion of the project rather than in the Executing process.
The resource calendars input describes the time frames in which resources (both human and material) are available. They look at a particular resource or groups of resources and their skills, abilities, quantity, and availability. Perhaps your project calls for a marketing resource and the person assigned to the marketing activities is on an extended vacation in October. The resource calendar would show this person’s vacation schedule. (The overall project calendar shows the holidays the company recognizes.)
Resource calendars also examine the quantity, capability, and availability of equipment and material resources that have a potential to impact the project schedule. For example, suppose your project calls for a hydraulic drill and your organization owns only one. The resource calendar will tell you whether it’s scheduled for another job at the same time it’s needed for your project.
The risk register is an output of the Identify Risks process. It is a list of identified risks and their potential responses. We will discuss the risk register in more depth in Chapter 6, “Risk Planning.”
Activity cost estimates are an output of the Estimate Costs process. These are the costs that are determined for each activity. We will look at activity cost estimates in more depth in Chapter 5.
Estimate Activity Resources Tools and Techniques
Your goal with the Estimate Activity Resources process is to determine the activity resource requirements, including quantity and availability. This process has five tools and techniques to help accomplish this output: expert judgment, alternative analysis, published estimating data, bottom-up estimating, and project management software. You already know what expert judgment entails, so take a look at the remaining tools:
Alternative Analysis Alternative analysis is used when thinking about the methods you might use to accomplish the activities your resources have been assigned. Many times, you can accomplish an activity in more than one way, and alternative analysis helps decide among the possibilities. For example, a subcompact car drives on the same roads a six-figure sports car travels. The sports car has a lot more features than the subcompact, it’s faster, it’s probably more comfortable, and it has a visual appeal that the subcompact doesn’t. The sports car might be the valid resource choice for the project, but you should consider all the alternatives. The same idea applies to human resources in that you might apply senior-level resources versus junior-level resources, or you could add resources to speed up the schedule. You may also use make-rent-or-buy analysis when determining alternative resources.
Published Estimating Data Estimating data might include organizational guidelines, industry rates or estimates, production rates, resource rates, and so on. For example, your organization might have established price agreements with vendors that outline rates by resource types, or there might be industry estimates for production rates for your particular activity or your particular geographical region.
Bottom-Up Estimating Bottom-up estimating is a process of estimating individual schedule activity costs and then adding them together to come up with a total estimate for the work package. Here you estimate every schedule activity individually and then roll up those estimates, or add them all together, to come up with a total. This is an accurate means of estimating, provided the estimates at the schedule activity level are accurate. However, it takes a considerable amount of time to perform bottom-up estimating because every activity must be assessed and estimated accurately to be included in the bottom-up calculation. The smaller and more detailed the activity, the greater the accuracy and cost of this technique. If it isn’t possible to estimate the activity cost, you’ll need to decompose the activity to a lower level of detail so that an estimate can be performed. Bottom-up estimating may also be used to determine activity durations and is a good technique to use when you aren’t confident about the type or quantity of resources you’ll need for the project.
Project Management Software Project management software can help plan, organize, and estimate resource needs and document their availability. It might also help you to produce resource breakdown structures, resource rates, resource calendars, and availability.
Estimate Activity Resources Outputs
The purpose of the Estimate Activity Resources process is to develop the activity resource requirements output. This output describes the types of resources and the quantity needed for each activity associated with a work package. You should prepare a narrative description for this output that describes how you determined the estimate, including the information you used to form your estimate and the assumptions you made about the resources and their availability.
NOTE
Work package estimates are derived by taking a cumulative total of all the schedule activities within the work package.
You’ll use the activity resource requirements in the next process (Estimate Activity Durations) to determine the length of time each activity will take to complete. That, of course, depends on the quantity and skill level of the resources assigned, which is the reason you estimate resources before you try to determine duration.
The two other outputs of this process are resource breakdown structure and project documents updates.
The resource breakdown structure (RBS) is much like an organizational breakdown structure, but the RBS lists the resources by category and type. You may have several categories of resources, including labor, hardware, equipment, supplies, and so on. Type describes the types of resources needed, such as skill levels or quality grades of the material and so on.
The project documents updates portion of this output refers to updating the activity list, activity attributes, and the resource calendars with changes to any of the elements you’ve recorded here.
You can see how these “Activity” processes have built on each other. First you defined the activities, then you determined dependencies and sequenced them in the correct order, and next you determined what types and quantities of resources are required to complete the activities. Now you’re ready to begin estimating the duration of these activities so you can plug them into the project schedule.
Estimating Activity Durations
The Estimate Activity Durations process attempts to estimate the work effort, resources, and number of work periods needed to complete each activity. The activity duration estimates are the primary output of this process. These are quantifiable estimates expressed as the number of work periods needed to complete a schedule activity. Work periods are usually expressed in hours or days. However, larger projects might express duration in weeks or months. Work periods are the activity duration estimates, and they become inputs to the Develop Schedule process.
When estimating activity duration, be certain to include all the time that will elapse from the beginning of the activity until the work is completed. For example, consider the earlier example of the house-painting project. You estimate that it will take three days, including drying time, to prime the house. Now, let’s say priming is scheduled to begin on Saturday, but your crew doesn’t work on Sunday. The activity duration in this case is four days, which includes the three days to prime and dry plus the Sunday the crew doesn’t work. Most project management software programs will handle this kind of situation automatically once you’ve keyed in the project calendar and work periods.
Progressive elaboration comes into play during this process also. Estimates typically start at a fairly high level, and as more details are known about the deliverables and their associated activities, the estimates become more accurate. You should rely on those folks who have the most knowledge of the activities you’re trying to estimate to help you with this process.
Estimate Activity Durations Inputs
The inputs to this process include the schedule management plan, activity list, activity attributes, activity resource requirements, resource calendars, project scope statement, risk register, resource breakdown structure, enterprise environmental factors, and organizational process assets.
A few of the important elements regarding these inputs apply here as you’ve seen in past processes: databases, productivity metrics, historical information regarding durations on similar projects, project calendars, scheduling methodology, and lessons learned. The project calendars (which list company holidays, shift schedules, and so on) are considered a part of the organizational process assets, and activity resource requirements are especially useful during this process.
Estimate Activity Durations Tools and Techniques
The Estimate Activity Durations process has several new tools and techniques:
Expert judgment
Analogous estimating
Parametric estimating
Three-point estimating
Group decision-making techniques
Reserve analysis
You’ll take a look at each of these tools and techniques next.
Expert Judgment
The staff members who will perform activities will most accurately estimate them. In this case, team members use expert judgment because of their experience with similar activities in the past. You should be careful with these estimates, though, because they are subject to bias and aren’t based on any scientific means. Your experts should consider that resource levels, resource productivity, resource capability, risks, and other factors can impact estimates. It’s good practice to combine expert judgment with historical information and use as many experts as you can.
Analogous Estimating
Analogous estimating, also called top-down estimating, is a form of expert judgment. With this technique, you will use the actual duration of a similar activity completed on a previous project to determine the duration of the current activity—provided the information was documented and stored with the project information on the previous project. This technique is most useful when the previous activities you’re comparing are similar to the activity you’re estimating and don’t just appear to be similar. You want the folks who are working on the estimate to have experience with these activities so they can provide reasonable estimates. This technique is especially helpful when detailed information about the project is not available, such as in the early phases of the project.
Top-down estimating techniques are also used to estimate total project duration, particularly when you have a limited amount of information about the project. The best way to think about top-down techniques is to look at the estimate as a whole. Think about being on a mountaintop where you can see the whole picture as one rather than all the individual items that make up the picture.
For instance, let’s return to the house-painting example. You would compare a previous house-painting project to the current house-painting project if the houses are of similar size and the paint you’re using is the same quality. You can use the first house-painting project to estimate the project duration for the second house-painting project because of the similarities in the project.
Top-down techniques are useful when you’re early in the project Planning processes and are just beginning to flesh out all the details of the project. Sometimes during the project selection process, the selection committee might want an idea of the project’s duration. You can derive a project estimate at this stage by using top-down techniques.
Parametric Estimating
Parametric estimating is a quantitatively based estimating method that multiplies the quantity of work by the rate or uses an algorithm in conjunction with historical data to determine cost, budget, or duration estimates. The best way to describe it is with an example. Suppose you are working on a companywide network upgrade project. This requires you to run new cable to the switches on every floor in the building. To come up with an estimate, you can use parametric estimates to determine activity duration estimates by taking a known element—in this case, the amount of cable needed—and multiplying it by the amount of time it takes to install a unit of cable. In other words, suppose you have 10,000 meters of new cable to run. You know from past experience it takes 1 hour to install 100 meters. Using this measurement, you can determine an estimate for this activity of 100 hours to run the new cable. Therefore, the cable activity duration estimate is 100 hours.
Three-Point Estimating
Three-point estimating, as you can probably guess, uses three estimates that, when averaged, come up with a final estimate. The three estimates you’ll use in this technique are the most likely estimate, an optimistic estimate, and a pessimistic estimate. The most likely estimate assumes there are no disasters and the activity can be completed as planned. The optimistic estimate is the fastest time frame in which your resource can complete the activity. The pessimistic estimate assumes the worst happens and it takes much longer than planned to get the activity completed. You’ll want to rely on experienced folks to give you these estimates. Then you can choose to use one of two formulas to calculate the expected duration estimate (E). The first formula, called the triangular distribution, consists of summing the optimistic (O), the pessimistic (P), and the most likely (M) estimates and then dividing that sum by 3. The formula looks like this:
E = (O + P + M) / 3
The second formula is called a beta distribution, which is taken from the program evaluation and review technique (PERT) that we will review in depth in the Develop Schedule process later in this process. The formula for beta distribution, or PERT, looks like this:
E = (O + P + 4M) / 6
Group Decision-Making Techniques
Group decision-making techniques include brainstorming and the Delphi or nominal group techniques. These techniques get your team members involved and will help improve the accuracy of your estimates. Brainstorming is an age-old technique where all participants have an opportunity to speak up. No idea is a bad idea with this technique, and it’s essential that the facilitator not allow participants to get into judging contests or debates on the merits of the ideas proposed during the brainstorming session.
The Delphi technique is similar to brainstorming in that you involve subject matter experts in determining estimates. Their experiences with the organization and on similar past projects will help improve the accuracy of the estimates. Because you have them involved in the process and they know that the estimates derived from this exercise will be attached to the project schedule, they are likely to provide more accurate estimates and work hard to meet or beat them.
Reserve Analysis
Contingency reserves—also called buffers or time reserves in the PMBOK® Guide—means a portion of time (or money when you’re estimating budgets) that is added to the schedule to account for risk or uncertainty. You might choose to add a percentage of time or a set number of work periods to the activity or the overall schedule or both. Contingency reserves are calculated for known risks that have documented contingency or mitigation response plans to deal with the risk event should it occur, but you don’t necessarily know how much time it will take to implement the mitigation plan and potentially perform rework. For example, you know it will take 100 hours to run new cable based on the quantitative estimate you came up with earlier. You also know that sometimes you hit problem areas when running the cable. To make sure you don’t impact the project schedule, you build in a reserve time of 10 percent of your original estimate to account for the problems you might encounter. This brings your activity duration estimate to 110 hours for this activity. Contingency reserves can be and should be modified as the project progresses. As you use the time, or find you don’t need the time, you will modify the reserve amounts.
Management reserves are a type of reserve used for unknown events. Since they are unknown, you have not identified them as risks. Management reserves are for that funny feeling you have that something could come up that you haven’t thought about during the Planning process. Management reserves set aside periods of time for this unknown work but are not included in the schedule baseline. Keep in mind this is not time that is available to throw in extra deliverables that didn’t make it into the scope statement. Management reserves must be used for project work that is within scope. If you do use management reserves during the project, you must change the schedule baseline to reflect the time used.
Estimate Activity Durations Outputs
Everything I’ve discussed to this point has brought you to the primary output of this process: the activity duration estimates. You use the inputs and tools and techniques to establish these estimates. As mentioned earlier, activity duration estimates are estimates of the required work periods needed to complete the activity. This is a quantitative measure usually expressed in hours, weeks, days, or months.
One factor to note about your final estimates as an output to this process is that they should contain a range of possible results. In the cable-running example, you would state the activity duration estimates as “100 hours ± 10 hours” to show that the actual duration will take at least 90 hours and might go as long as 110 hours—or you could use percentages to express this range.
The other output of Estimate Activity Durations is project documents updates. The information that may need to be revisited and updated as a result of this process includes the activity attributes and the assumptions you made regarding resource availability and skill levels.
Now that you have all the activity information in hand, along with a host of other inputs, you’re ready to develop the project schedule.
![]() Real World Scenario
Real World Scenario
DSU has hired a contract agency to create its new registration website. The website will allow students in good academic standing to register for classes over the Internet. You have been appointed as the project manager for the DSU side of this project. You’ll be working with Henry Lu from Websites International to complete this project.
Henry has given you an activity list and asked for time estimates that he can plug into the project plan.
Your first stop is Mike Walter’s desk. He’s the expert on the mainframe registration system and he’ll be writing the interface programs to accept registration data from the new website. Mike will also create the download that the Internet program will use to verify a student’s academic standing. Mike has created other programs just like this in the past. His expertise and judgment are very reliable.
The next stop is Kate Langdon. She’s the new team leader of the testing group. Kate has been with DSU for only one month. Since she has no experience working with DSU data and staff members, she tells you she’ll get back to you within a week with estimates for the testing activities. She plans to read through the project binders of some similar projects and base her estimates against the historical information on similar projects. She’ll run the estimates by her lead tester before giving them to you.
You’ve asked both of your resources to provide you with three-point estimates. Mike Walter’s estimates are an example of using the tool and technique of expert judgment to derive activity duration estimates. The estimates expected from Kate Langdon will be derived using historical information (implied by the research she’s going to do into past similar projects) and expert judgment because she’s involving her lead tester to verify the estimates.
Developing the Project Schedule
The Develop Schedule process is the heart of the Planning process group. This is where you lay out the schedule for your project activities, determine their start and finish dates, and finalize activity sequences and durations. Develop Schedule, along with Estimate Activity Resources and Estimate Activity Durations, is repeated several times before you come up with the project schedule. Most project management software programs today can automatically build a schedule for you once you’ve entered the needed information for the activities. The project schedule, once it’s approved, serves as the schedule baseline for the project that you can track against in later processes.
NOTE
Remember that you cannot perform Develop Schedule until you have completed at least the following processes in the Planning group (some of these can be performed at the same time for smaller, less complex projects): Collect Requirements, Define Scope, Create WBS, Define Activities, Sequence Activities, Estimate Activity Resources, Estimate Activity Durations, and Plan Human Resource Management. In practice, it’s also beneficial to perform Identify Risks, Perform Qualitative Risk Analysis, Perform Quantitative Risk Analysis, Plan Risk Responses, and Plan Procurement Management prior to developing the schedule.
There is a lot of material to cover in this process, so grab a cup of coffee or a soda now. I’ll start with the inputs to the Develop Schedule process and then follow up with an in- depth discussion of the tools and techniques of the process. These techniques will help you get to the primary output of this process: the project schedule.
Develop Schedule Inputs
Develop Schedule has 13 inputs, 9 of which are outputs from other Planning processes. The inputs are as follows:
Schedule management plan
Activity list
Activity attributes
Project schedule network diagrams
Activity resource requirements
Resource calendars
Activity duration estimates
Project scope statement
Risk register
Project staff assignments
Resource breakdown structure
Enterprise environmental factors
Organizational process assets
You can see how important it is to perform all the Planning processes accurately because the information you derive from almost every process in the Planning group is used somewhere else in Planning, many of them here. Your project schedule will reflect the information you know at this point in time. If you have incorrectly estimated activity durations or didn’t identify the right dependencies, for example, the inputs to this process will be distorted and your project schedule will not be correct. It’s definitely worth the investment of time to correctly plan your project and come up with accurate outputs for each of the Planning processes.
As with several other processes, you should pay particular attention to constraints and assumptions when performing Develop Schedule. Constraints are with you throughout the life of the project. The most important constraints to consider in the Develop Schedule process are time constraints, and they fall into two categories: imposed dates and key events/major milestones.
Imposed dates restrict the start or finish date of activities. The two most common constraints, start no earlier than and finish no later than, are used by most computerized project management software programs. Let’s look once again at the house-painting example. The painting activity cannot start until the primer has dried. If the primer takes 24 hours to dry and is scheduled to be completed on Wednesday, this implies that the painting activity can start no earlier than Thursday. This is an example of an imposed date.
Key events or milestones refer to the completion of specific deliverables by a specific date. Stakeholders, customers, or management staff might request that certain deliverables be completed or delivered by specific dates. Once you’ve agreed to those dates (even if the agreement is only verbal), it’s often cast in stone and difficult to change. These dates, therefore, become constraints.
NOTE
Be careful of the delivery dates you commit to your stakeholders or customers. You might think you’re simply discussing the matter or throwing out ideas, whereas the stakeholder might take what you’ve said as fact. Once the stakeholder believes the deliverable or activity will be completed by a specific date, there’s almost no convincing them that the date needs changing.
Develop Schedule Tools and Techniques
The primary outputs of Develop Schedule are the schedule baseline and the project schedule. The schedule baseline is the approved version of the project schedule. You can employ several tools and techniques to produce these outputs. The tools and techniques you choose depend on the complexity of the project. For the exam, however, you’ll need to know them all.
Develop Schedule has eight tools and techniques:
Schedule network analysis
Critical path method
Critical chain method
Resource optimization techniques
Modeling techniques
Leads and lags
Schedule compression
Scheduling tool
A lot of information is packed into some of these tools and techniques, and you should dedicate study time to each of them for the exam. We’ll look at each one next.
Schedule Network Analysis
Schedule network analysis produces the project schedule. It involves calculating early and late start dates and early and late finish dates for project activities (as does the critical path method). It uses a schedule model and other analytical techniques such as critical path and critical chain method, what-if analysis, and resource leveling (all of which are other tools and techniques in this process) to help calculate these dates and create the schedule. These calculations are performed without taking resource limitations into consideration, so the dates you end up with are theoretical. At this point, you’re attempting to establish the time periods within which the activities can be scheduled. Resource limitations and other constraints will be taken into consideration when you get to the outputs of this process.
Critical Path Method
The critical path method (CPM) is a schedule network analysis technique that estimates the minimum project duration. It determines the amount of float, or schedule flexibility, for each of the network paths by calculating the earliest start date, earliest finish date, latest start date, and latest finish date for each activity (without taking resource availability into account). This is a schedule network analysis technique that relies on sequential networks (one activity occurs before the next, a series of activities occurring concurrently is completed before the next series of activities begins, and so on) and on a single duration estimate for each activity. The precedence diagramming method (PDM) can be used to perform CPM. Keep in mind that CPM is a method to determine schedule durations without regard to resource availability.
The critical path (CP) is generally the longest full path on the project. Any project activity with a float time that equals 0 or with negative float is considered a critical path task. The critical path can change under a few conditions. When activities with float time use up all their float, they can become critical path tasks. Or you might have a milestone midway through the project with a finish no later than constraint that can change the critical path if it isn’t met.
Float time is also called slack time, and you’ll see these terms used interchangeably. There are two types of float: total float and free float. Total float (TF) is the amount of time you can delay the earliest start of a task without delaying the ending of the project. Free float (FF) is the amount of time you can delay the start of a task without delaying the earliest start of a successor task.
In the following section, you’ll calculate the CP for a sample project, and I’ll illustrate how you derive all the dates, the CP, and the float times.
Gathering Activity and Dependency Information
Let’s say you are the project manager for a new software project. Your team will be developing a custom application that manages, tracks, and analyzes charitable contributions to a variety of organizations managed by your parent company. You need to devise a software system that tracks all the information related to the contributions, the donors, and the receivers and also supplies the management team with reports that will help them make good business decisions. For purposes of illustration, I’m showing only a limited portion of the tasks that you would have on a project like this.
You’ll start this example by plugging information from the processes you’ve already completed into a table (a complete example is shown later in Table 4.1 in the section “Calculating the Critical Path”). The list of activities comes from the Define Activities process. The durations for each activity are listed in the Duration column and were derived during the Estimate Activity Durations process. The duration times are listed in days.
The Dependency column lists the activities that require a previous activity to finish before the current activity can start. You’re using only finish-to-start relationships. For example, you’ll see that activity 2 and activity 4 each depend on activity 1 to finish before they can begin. The dependency information came from the Sequence Activities process. Now, you’ll proceed to calculating the dates.
Calculating the Forward and Backward Pass
Project Deliverables is the first activity and, obviously, where the project starts. This activity begins on April 1. Project Deliverables has a 12-day duration. So, take April 1 and add 12 days to this to come up with an early finish date of April 12. Watch out, because you need to count day 1, or April 1, as a full workday. The simplest way to do this calculation is to take the early start date, add the duration, and subtract 1. Therefore, the early finish date for the first activity is April 12. By the way, we are ignoring weekends and holidays for this example. Activity 2 depends on activity 1, so it cannot start until activity 1 has finished. Its earliest start date is April 13 because activity 1 finished at the end of the previous day. Add the duration to this date minus 1 to come up with the finish date.
You’ll notice that since activity 4 depends on activity 1 finishing, its earliest start date is also April 13. Continue to calculate the remaining early start and early finish dates in the same manner. This calculation is called a forward pass.
To calculate the latest start and latest finish dates, you begin with the last activity. The latest finish for activity 9 is July 10. Since the duration is only one day, July 10 is also the latest start date. You know that activity 8 must finish before activity 9 can begin, so activity 8’s latest finish date, July 9, is one day prior to activity 9’s latest start date, July 10. Subtract the duration of activity 8 (three days) from July 9 and add one day to get the latest start date of July 7. You’re performing the opposite calculation that you did for the forward pass. This calculation is called a backward pass, as you might have guessed. Continue calculating the latest start and latest finish through activity 4.
Activity 3 adds a new twist. Here’s how it works: Activity 7 cannot begin until activity 3 and activity 6 are completed. No other activity depends on the completion of activity 3. If activity 7’s latest start date is June 29, activity 3’s latest finish date must be June 28. June 28 minus eight days plus one gives you a latest start date of June 21. Activity 3 depends on activity 2, so activity 2 must be completed prior to beginning activity 3. Calculate these dates just as you did for activities 9 through 4.
Activity 1 still remains. Activity 4 cannot start until activity 1 is completed. If activity 4’s latest start date is April 13, the latest finish date for activity 1 must be April 12. Subtract the duration of activity 1, and add 1 to come up with a latest start date of April 1. Alternatively, you can calculate the forward pass and backward pass by saying the first task starts on day 0 and then adding the duration to this. For example, activity number 1’s earliest start date is April 1, which is day 0. Add 12 days to day 0, and you come up with an earliest finish date of April 12.
You determine the calculation for float/slack time by subtracting the earliest start date from the latest start date. If the float time equals 0, the activity is on the critical path.
Calculating the Critical Path
To determine the CP duration of the project, add the duration of every activity with zero float. You should come up with 101 days because you’re adding the duration for all activities except for activity 2 and activity 3. A critical path task is any task that cannot be changed without impacting the project end date. By definition, these are all tasks with zero float.
Another way to determine the critical path is by looking at the network diagram. If the duration is included with the information on the node or if start and end dates are given, you simply calculate the duration and then add the duration of the longest path in the diagram to determine the CP. However, this method is not as accurate as what’s shown in Table 4.1.
Activity Number |
Activity Description |
Dependency |
Duration |
Early Start |
Early Finish |
Late Start |
Late Finish |
Float/Slack |
1 |
Project Deliverables |
— |
12 |
4/1 |
4/12 |
4/1 |
4/12 |
0 |
2 |
Procure Hardware |
1 |
2 |
4/13 |
4/14 |
6/19 |
6/20 |
67 |
3 |
Test Hardware |
2 |
8 |
4/15 |
4/22 |
6/21 |
6/28 |
67 |
4 |
Procure Software Tools |
1 |
10 |
4/13 |
4/22 |
4/13 |
4/22 |
0 |
5 |
Write Code |
4 |
45 |
4/23 |
6/6 |
4/23 |
6/6 |
0 |
6 |
Test and Debug |
5 |
22 |
6/7 |
6/28 |
6/7 |
6/28 |
0 |
7 |
Install |
3, 6 |
8 |
6/29 |
7/6 |
6/29 |
7/6 |
0 |
8 |
Training |
7 |
3 |
7/7 |
7/9 |
7/7 |
7/9 |
0 |
9 |
Acceptance |
8 |
1 |
7/10 |
7/10 |
7/10 |
7/10 |
0 |
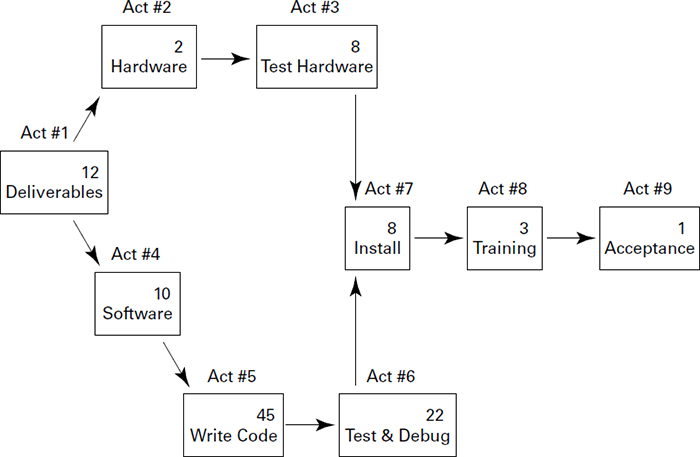
Figure 4.3 shows the same project in diagram form. The duration is printed in the top-right corner of each node. Add the duration of each path to determine which one is the critical path.
Remember that CP is usually the path with the longest duration. In Figure 4.1, path 1-2-3-7-8-9 equals 34 days. Path 1-4-5-6-7-8-9 equals 101 days; therefore, this path is the critical path.
FIGURE 4.3 Critical path diagram
Calculating Expected Value Using PERT
Program Evaluation and Review Technique (PERT) is a method that the United States Navy developed in the 1950s. The Navy was working on one of the most complex engineering projects in history at the time—the Polaris Missile Program—and needed a way to manage the project and forecast the project schedule with a high degree of reliability. PERT was developed to do just that.
PERT and CPM are similar techniques. The difference is that CPM uses the most likely duration to determine project duration, whereas PERT uses what’s called expected value (or the weighted average). Expected value is calculated using the three-point estimates for activity duration (I talked about three-point estimates earlier in this chapter) and then finding the weighted average of those estimates (I’ll talk about weighted average in the next section, “Calculating Expected Value”). If you take this one step further and determine the standard deviation of each activity, you can assign a confidence factor to your project estimates. Without getting too heavily involved in the mathematics of probability, understand that for data that fits a bell curve—which is what you’re about to calculate with the PERT technique—the following is true:
Work will finish within plus or minus three standard deviations 99.73 percent of the time.
Work will finish within plus or minus two standard deviations 95.45 percent of the time.
Work will finish within plus or minus one standard deviation 68.27 percent of the time.
Calculating Expected Value
The three-point estimates used to calculate expected value are the optimistic estimate, the pessimistic estimate, and the most likely estimate. Going back to the software example, let’s find out what these three time estimates might look like for the activity called Write Code. You get these estimates by asking the lead programmer, or key team member, to estimate the optimistic, pessimistic, and most likely duration for the activity based on past experience. Other historical information could be used to determine these estimates as well. Say in this case that you’re given 38 days for the optimistic time, 57 days for the pessimistic, and 45 days for the most likely. (Forty-five days was derived from the Estimate Activity Durations process and is the estimate you used to calculate CPM.)
The formula to calculate expected value is as follows:
(optimistic + pessimistic + (4 × mostlikely)) / 6
The expected value for the Write Code activity is as follows:
(38 + 57 + (4 × 45)) / 6 = 45.83
The formula for standard deviation, which helps you determine confidence level, is as follows:
(pessimistic – optimistic) / 6
The standard deviation for your activity is as follows:
(57 – 38) / 6 = 3.17
You could say the following, given the information you now have:
There is a 68.27 percent chance that the Write Code activity will be completed in 42.66 days to 49 days.
There is a 95.45 percent chance that the Write Code activity will be completed in 39.49 days to 52.17 days.
You calculated the range of dates for the 68.27 percent chance by adding and subtracting one standard deviation, 3.17, from the expected value, 45.83. You calculated the 95.45 percent chance by multiplying the standard deviation times 2, which equals 6.34, and adding and subtracting that result from the expected value to come up with the least number of days and the most number of days it will take to finish the activity. Generally speaking, two standard deviations, or 95.45 percent, is a close enough estimate for most purposes.
Determining Date Ranges for Project Duration
Let’s bring your table of activities back and plug in the expected values and the standard deviation for each (see Table 4.2).
Activity Number |
Activity Description |
Optimistic |
Pessimistic |
Most Likely |
Expected Value |
Standard Deviation (SD) |
SD Squared |
1 |
Project Deliverables |
10 |
14 |
12 |
12.00 |
0.67 |
0.45 |
2 |
Procure Hardware |
— |
— |
— |
— |
— |
— |
3 |
Test Hardware |
— |
— |
— |
— |
— |
— |
4 |
Procure Software Tools |
8 |
14 |
10 |
10.33 |
1.00 |
1.0 |
5 |
Write Code |
38 |
57 |
45 |
45.83 |
3.17 |
10.05 |
6 |
Test and Debug |
20 |
30 |
22 |
23.00 |
1.67 |
2.79 |
7 |
Install |
5 |
10 |
8 |
7.83 |
0.83 |
0.69 |
8 |
Training |
3 |
3 |
3 |
3.00 |
0 |
0 |
9 |
Acceptance |
1 |
1 |
1 |
1.00 |
0 |
0 |
Totals for CP Tasks |
|
|
|
|
102.99 |
|
14.98 |
NOTE
The higher the standard deviation is for an activity, the higher the risk. Because standard deviation measures the difference between the pessimistic and the optimistic times, a greater spread between the two, which results in a higher number, indicates a greater risk. Conversely, a low standard deviation means less risk.
Now let’s look at the total project duration using PERT and the standard deviation to determine a range of dates for project duration. You should add only the tasks that are on the critical path. Remember from the CPM example that activities 2 and 3 are not on the critical path, so their expected value and standard deviation calculations have been left blank in this table. When you add all the remaining tasks, the total expected value duration is 102.99 days, or 103 days rounded to the nearest day.
Your next logical conclusion might be to add the Standard Deviation column to get the standard deviation for the project. Unfortunately, you cannot add the standard deviations because you will come out with a number that is much too high. Totaling the standard deviations assumes that all the tasks will run over schedule, and that’s not likely. It is likely that a few tasks will run over but not every one of them. So now you’re probably wondering how to calculate the magic number.
You might have noticed an extra column at the right called SD Squared (or variance). This is the standard deviation squared—or for those of you with math phobias out there, the standard deviation multiplied by itself.
Once you have calculated the standard deviation squared for each activity, add the squares, for a total of 14.98. There’s one more step, and you’re done. Take the square root of 14.98 (you’ll need a calculator) to come up with 3.87. This is the standard deviation you will use to determine your range of projected completion dates. Here’s a recap of these last few calculations:
Total expected value = 103.00
Sum of SD Squared = 14.98
Square root of SD Squared = 3.87
You can now make the following predictions regarding your project:
There is a 68.27 percent chance that the project will be completed in 99.13 days to 106.87 days.
There is a 95.45 percent chance that the project will be completed in 95.26 days to 110.74 days.
PERT is not used often today. When it is, it’s used for very large, highly complex projects. However, PERT is a useful technique to determine project duration when your activity durations are uncertain. It’s also useful for calculating the duration for individual tasks in your schedule that might be complex or risky. You might decide to use PERT for a handful of the activities (those with the highest amount of risk, for example) and use other techniques to determine duration for the remaining activities.
Critical Chain Method
Critical chain method is a schedule network analysis technique that will modify the project schedule by accounting for limited or restricted resources, or for unforeseen project issues, by adding buffers to any schedule path. First construct the project schedule network diagram using the critical path method. You will apply the duration estimates, dependencies, and constraints and then enter resource availability. Buffers, called feeding buffers, are added at this time as well. The idea behind feeding buffers is similar to that of contingencies. Adding buffer activities (which are essentially nonwork activities) to the schedule gives you a cushion of time that protects the critical path and thus the overall project schedule from slipping. Feeding buffers are added to noncritical chain-dependent tasks that feed into the critical chain. Project buffers are a type of buffer that is added at the end of the critical chain. According to the PMBOK® Guide, after adding these buffer activities you should schedule your critical path tasks at their latest start and finish dates.
Once this modified schedule is calculated, you’ll often find that it changes the critical path. The new critical path showing the resource restrictions and feeding buffers is called the critical chain.
Critical chain uses both deterministic (step-by-step) and probabilistic approaches. A few steps are involved in the critical chain process:
Construct the schedule network diagram using activity duration estimates (you’ll use nonconservative estimates in this method).
Define dependencies.
Define constraints.
Calculate critical path.
Enter resource availability into the schedule.
Recalculate for the critical chain.
The critical chain method typically schedules high-risk tasks early in the project so that problems can be identified and addressed right away. It allows for combining several tasks into one task when one resource is assigned to all the tasks.
Resource Optimization Techniques
Earlier, I said that CPM and PERT do not consider resource availability. Now that you have a schedule of activities and have determined the critical path, it’s time to plug in resources for those activities and adjust the schedule or resources according to any resource constraints you discover. Remember that you identified resource estimates during the Estimate Activity Resources process. Now during Develop Schedule, resources are assigned to specific activities. Usually, you’ll find that your initial schedule has periods of time with more activities than you have resources to work on them. You will also find that it isn’t always possible to assign 100 percent of your team members’ time to tasks. Sometimes your schedule will show a team member who is overallocated, meaning they’re assigned to more work than they can physically perform in the given time period. Other times, they might not be assigned enough work to keep them busy during the time period. This problem is easy to fix. You can assign underallocated resources to multiple tasks to keep them busy. Adjusting the schedule for overallocated resources is a harder problem to fix. We will look at three techniques that optimize resources to prevent overallocation where possible: resource leveling, resource smoothing, and reverse resource allocation scheduling. You should use these techniques with CPM-based schedules.
Resource Leveling
Resource leveling—also called the resource-based method—is used when resources are overallocated, when they are only available at certain times, or when they are assigned to more than one activity at a time. In a nutshell, resource leveling attempts to balance out the resource assignments to get tasks completed without overloading the individual. You accomplish this by adjusting the start and finish dates of schedule activities based on the availability of resources. This typically means allocating resources to critical path tasks first, which often changes the critical path and, in turn, the overall project end date.
The project manager can accomplish resource leveling in a couple of other ways as well. You might delay the start of a task to match the availability of a key team member, or you might adjust the resource assignments so that more tasks are given to team members who are underallocated. Generally speaking, resource leveling of overallocated team members extends the project end date. If you’re under a date constraint, you’ll have to rework the schedule after assigning resources to keep the project on track with the committed completion date. You can accomplish this with resource smoothing, which we’ll look at next.
Resource Smoothing
Resource smoothing accommodates resource availability by modifying activities within their float times without changing the critical path or project end date. That means you’ll also use this technique when you need to meet specific schedule dates and are concerned about resource availability.
There are several ways you can accomplish this. You can adjust the resource assignments so that more tasks are given to team members who are underallocated. You could also require the resources to work mandatory overtime—that one always goes over well! Perhaps you can split some tasks so that the team member with the pertinent knowledge or skill performs the critical part of the task and the noncritical part of the task is given to a less-skilled team member. Other methods might include moving key resources from noncritical tasks and assigning them to critical path tasks or adjusting assignments. Reallocating those team members with slack time to critical path tasks to keep them on schedule is another option. Don’t forget, fast tracking is another way to keep the project on schedule.
Reverse Resource Allocation Scheduling
Reverse resource allocation scheduling is a technique used when key resources—like a thermodynamic expert, for example—are required at a specific point in the project and they are the only resource, or resources, available to perform these activities. This technique requires the resources to be scheduled in reverse order (that is, from the end date of the project rather than the beginning) in order to assign this key resource at the correct time.
Modeling Techniques
Modeling techniques typically include the use of what-if scenario analysis and simulation.
What-if scenario analysis uses different sets of activity assumptions to produce multiple project durations. For example, what would happen if a major deliverable is delayed or the weather prevents you from completing a deliverable on time? What-if analysis literally asks the question, “What if (fill in the blank) happens on the project?” and attempts to determine the potential positive and/or negative impacts to the project. What-if questions help determine the feasibility of the project schedule under adverse conditions. They are also useful to the project team in preparing risk responses or contingency plans to address the what-if situations. Worst-case what-if scenarios may result in a no-go decision.
Simulation techniques use a range of probable activity durations for each activity (often derived from the three-point estimates), and those ranges are then used to calculate a range of probable duration results for the project itself. Monte Carlo is a simulation technique that runs the possible activity durations and schedule projections many, many times to come up with the schedule projections and their probability, critical path duration estimates, and float time.
Leads and Lags
I talked about leads and lags earlier in this chapter. You’ll recall that lags delay successor activities and require time added either to the start date or to the finish date of the activity you’re scheduling. Leads require time to be subtracted from the start date or the finish date of the activity. Keep in mind that as you go about creating your project schedule, you might need to adjust lead and lag time to come up with a workable schedule.
Schedule Compression
Schedule compression is a form of mathematical analysis that’s used to shorten the project schedule duration without changing the project scope. Compression is simply shortening the project schedule to accomplish all the activities sooner than estimated.
Schedule compression might happen when the project end date has been predetermined or if, after performing the CPM or PERT techniques, you discover that the project is going to take longer than the original promised date. In the CPM example, you calculated the end date to be July 10. What if the project was undertaken and a July 2 date was promised? That’s when you’ll need to employ one or both of the duration compression techniques: crashing and fast tracking.
Crashing
Crashing is a compression technique that looks at cost and schedule trade-offs. Crashing the schedule is accomplished by adding resources—from either inside or outside the organization—to the critical path tasks. It wouldn’t help you to add resources to noncritical path tasks; these tasks don’t impact the schedule end date anyway because they have float time. Crashing could be accomplished by requiring mandatory overtime for critical path tasks or requiring overnight deliveries of materials rather than relying on standard shipping times. You may find that crashing the schedule can lead to increased risk or increased costs or both.
NOTE
Be certain to check the critical path when you’ve used the crashing technique because crashing might have changed the critical path. Also consider that crashing doesn’t always come up with a reasonable result. It often increases the costs of the project as well. The idea with crashing is to try to gain the greatest amount of schedule compression with the least amount of cost.
Fast Tracking
I talked about fast tracking in Chapter 1, “What Is a Project?” Fast tracking is performing two tasks or project phases in parallel that were previously scheduled to start sequentially. Fast tracking can occur for the entire duration of the task or phase or for a portion of the task or phase duration. It can increase project risk and might cause the project team to have to rework tasks. Fast tracking will work only for activities that can be overlapped. For example, it is often performed in object-oriented programming. The programmers might begin writing code on several modules at once, out of sequential order and prior to the completion of the design phase. However, if you remember our house-painting example, you couldn’t start priming and painting at the same time, so fast tracking isn’t a possibility for those activities.
Scheduling Tool
Given the examples you’ve worked through on Develop Schedule and resource leveling, you have probably already concluded how much a scheduling tool might help you with these processes. The scheduling tools I’ve used are in the form of project management software programs. They will automate the mathematical calculations (such as forward and backward pass) and perform resource-leveling functions for you. Obviously, you can then print the schedule that has been produced for final approval and ongoing updates. It’s common practice to email updated schedules with project notes so that stakeholders know what activities are completed and which ones remain to be done.
It’s beyond the scope of this book to go into all the various software programs available to project managers. Suffice it to say that scheduling tools and project management software range from the simple to the complex. The level of sophistication and the types of project management techniques that you’re involved with will determine which software product you should choose. Many project managers that I know have had great success with Microsoft Project software and use it exclusively. It contains a robust set of features and reporting tools that will serve most projects well.
Don’t forget that you are the project manager, and your good judgment should never be usurped by the recommendation of a software product. Your finely tuned skills and experience will tell you whether relationship issues between team members might cause bigger problems than what the resource-leveling function indicates. Constraints and stakeholder expectations are difficult for a software package to factor in. Rely on your expertise when in doubt. If you don’t have the experience yet to make knowledge-based decisions, seek out another project manager or a senior stakeholder, manager, or team member and ask them to confirm whether you’re on the right track. Here’s a word of caution: Don’t become so involved with the software that you’re managing the software instead of managing the project. Project management software is a wonderful tool, but it is not a substitute for sound project management practices or experience.
Scheduling Process Outputs
The Develop Schedule process has six outputs:
Schedule baseline
Project schedule
Schedule data
Project calendars
Project management plan updates
Project documents updates
We’ll take a look at a few of the outputs of this process next, starting with the project schedule first. Take note that the two primary outputs from this process that will carry forward throughout the rest of the project are the project schedule and the schedule baseline.
![]() Real World Scenario
Real World Scenario
Kate Newman is a project manager for Sunny Surgeons, Inc. Sunny Surgeons, Inc., is a software company that produces software for handheld devices for the medical profession. The software allows surgeons to keep notes regarding patients, upcoming surgeries, and ideas about new medicines and techniques to research. Kate’s latest project is to write an enhanced version of the patient-tracking program with system integration capabilities to a well-known desktop software product used by the medical industry.
The programming department has had some recent turnover. Fortunately, Stephen, the senior programmer who led the development effort on the original version of the patient tracker, still works for Sunny. His expertise with handheld technologies, as well as his knowledge of the desktop software product, makes him an invaluable resource for this project.
Kate discovered a problem during the development of the project schedule. Stephen is overallocated for three key activities. Kate decides to see what his take is on the situation before deciding what to do.
Stephen, the eternal optimist programmer who loves his job and does all but sleep in his office at night, says he can easily complete all the activities and that Kate shouldn’t give it a second thought. He also suggests to Kate that Karen Wong, a junior programmer on his team who worked on the last project with him, might be able to handle the noncritical path task on her own, with a little direction from Stephen.
Kate thinks better of the idea of overallocating her key project resource, even if he does think he can do the entire thing single-handedly. She decides to try some resource leveling to see what turns up.
Kate discovers that rearranging the order of activities, along with assigning Karen to handle the noncritical path activity, might be a possible solution. However, this scenario lengthens the project by a total of eight days. Since Kate knows the primary constraint on this project is quality, she’s fairly sure she can get a buy-off from the project sponsor and stakeholders on the later schedule date. She can also sell the resource-leveled schedule as a low-risk option as opposed to assigning Stephen to all the activities and keeping the project end date the same. Overallocating resources can cause burnout and stress- related illnesses, which will ultimately have a negative impact on the project schedule.
Project Schedule
The purpose of the Develop Schedule process is to analyze most of the steps we’ve talked about so far, including sequencing activities, determining their durations, considering schedule constraints, and analyzing resource requirements. One of the primary outputs of this process is the project schedule, which presents the start and finish dates for each of the project activities, the duration of activities, dependencies among activities, milestones, and resources in a project schedule model. Determining resource assignments occurs in the Acquire Project Team process, and depending on the size and complexity of your project or your organization’s culture, this process might not be completed yet. If that’s the case, the project schedule is considered preliminary until the resources are assigned to the activities.
NOTE
In PMBOK® Guide terms, the project schedule is considered preliminary until resources are assigned. In reality, keep in mind that once you’ve published the project schedule (even though it’s in a preliminary state), some stakeholders might regard it as the actual schedule and expect you to keep to the dates shown. Use caution when publishing a schedule in its preliminary form.
The project schedule should be approved by stakeholders and functional managers, who should sign off on it. This assures you that they have read the schedule, understand the dates and resource commitments, and will likely cooperate. You’ll also need to obtain confirmation that resources will be available as outlined in the schedule when you’re working in a functional organization. The schedule cannot be finalized until you receive approval and commitment for the resource assignments outlined in it.
Once the schedule is approved, it will become your baseline for the remainder of the project. Project progress and task completion will be monitored and tracked against the project schedule to determine whether the project is on course as planned.
According to the PMBOK® Guide, the schedule models are called presentations. You can present the schedule in a variety of ways, some of which are variations on what you’ve already seen. Project schedule network diagrams, like the ones discussed earlier, will work as schedule diagrams when you add the start and finish dates to each activity. These diagrams usually show the activity dependencies and critical path. Figure 4.4 shows a sample portion of a project schedule network diagram highlighting the programming activities.
FIGURE 4.4 Project schedule network diagram with activity dates
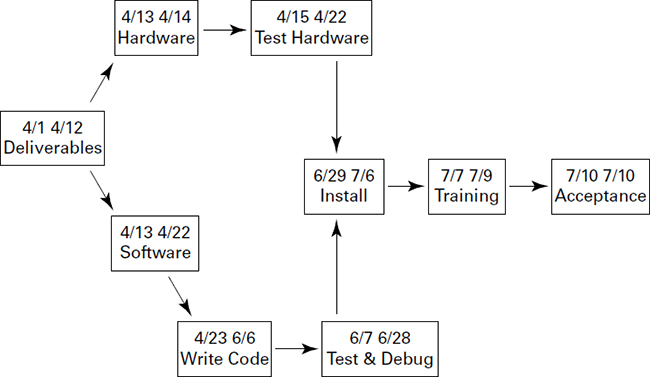
Gantt charts are easy to read and commonly used to display schedule activities. Depending on the software you’re using to produce the Gantt chart, it might also show activity sequences, activity start and end dates, resource assignments, activity dependencies, and the critical path. Figure 4.5 is a simple example that plots various activities against time. These activities do not relate to the activities in the tables or other figures shown so far. Gantt charts are also known as bar charts
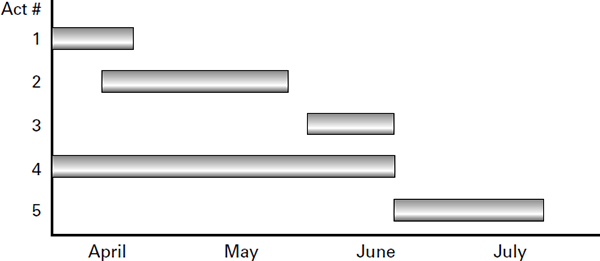
Milestone charts are another way to depict schedule information. Milestones mark the completion of major deliverables or some other key events in the project. For example, approval and sign-off on project deliverables might be considered a milestone. Other examples might be completion of a prototype, system testing, and contract approval.
Milestone charts might show the key events and their start or completion dates in a bar chart form similar to a Gantt chart. Or they can be written in a simple table format with milestones listed in the rows and expected schedule dates in one column and actual completion dates in another, as shown in Table 4.3. As the milestones are met, the Actual Date column is filled in. This information can be included with the project status reports.
Milestone |
Scheduled Date |
Actual Date |
Sign-off on deliverables |
4/12 |
4/12 |
Sign-off on hardware test |
4/22 |
4/25 |
Programming completed |
6/06 |
|
Testing completed |
6/28 |
|
Acceptance and sign-off |
7/10 |
|
Project closeout |
7/10 |
|
NOTE
Milestone charts are an ideal way to present information to the executive team. They are high level, easy to read, and to the point. Bar charts (or Gantt charts) are great for presenting the schedule to the management level. They have a bit more detail and are a quick way to see at a glance what resources are required when.
Schedule Baseline
The schedule baseline is the final, approved version of the project schedule with baseline start and baseline finish dates and resource assignments. The approved project schedule becomes a part of the project management plan we talked about in Chapter 3 and, once approved, must follow change control procedures if changes are needed.
NOTE
According to the PMI® Project Management Professional (PMP) Examination Content Outline, in order to manage the timely completion of your project you’ll need the project schedule, the approved project deliverables (documented in the project scope statement), milestones, scope management plan, and resource management plans.
As I’ve noted during discussions of some of the other Planning processes, project planning and project management are iterative processes. Rarely is anything cast in cement. You will continue to revisit processes throughout the project to refine and adjust. Eventually, processes do get put to bed. You wouldn’t want to return to the Planning process at the conclusion of the project, for example, but keep in mind that the Planning, Executing, and Monitoring and Controlling process groups are iterative, and it’s not unusual to have to revise processes within these process groups as you progress on the project.
In practice, for small to medium-sized projects, you can complete Define Activities, Sequence Activities, Estimate Activity Resources, Estimate Activity Durations, and Develop Schedule at the same time with the aid of a project management software tool. You can produce Gantt charts; you can produce the critical path, resource allocation, and activity dependencies; you can perform what-if analysis; and you can produce various reports after plugging your scheduling information into most project management software tools. Regardless of your methods, be certain to obtain sign-off on the project schedule and provide your stakeholders and project sponsor with regular updates. Keep your schedule handy—there will likely be changes and modifications as you go. While you’re at it, be certain to save a schedule baseline for comparative purposes. Once you get into the Executing and Monitoring and Controlling processes, you’ll be able to compare what you planned to do against what actually happened.
Schedule Data
The schedule data refers to documenting the supporting data for the schedule. The minimum amount of information in this output includes the milestones, schedule activities and activity attributes, and the assumptions and constraints regarding the schedule. You should document any other information that doesn’t necessarily fit into the other categories. Always err on the side of too much documentation rather than not enough.
You will have to be the judge of what other information to include here because it will depend on the nature of the project. The PMBOK® Guide suggests that you might include schedule contingencies, alternative schedules, and resource histograms. Chapter 7, “Planning Project Resources,” contains an example of a resource histogram if you want to peek ahead. Resource histograms typically display hours needed on one axis and period of time (days, weeks, months, years) on the other axis. You might also include alternative schedules or contingency schedule reserves in the schedule data section.
Project Documents Updates
As with many of the other processes you’ve seen in this chapter, creating the project schedule may require updates to the activity resource requirements document, activity attributes, calendars, and the risk register.
![]() Real World Scenario
Real World Scenario
You worked with the stakeholders to document the activity list last week. After creating the first draft of the project schedule network diagram, you went back to each of them to ask for time estimates for each of the activities. Ricardo’s estimates are shown here:
1. Procure the T1 connection. This takes 30 to 45 days. This activity can be done concurrently with the other activities listed here. Ricardo will perform this activity.
2. Run Ethernet cable throughout the building. This activity depends on the lease being signed and must finish before the build-out can start. The estimated time to complete is 16 hours, which was figured using parametric estimating techniques. Ricardo has one person on staff who can complete this specialized activity. His first available date is October 5.
3. Purchase the router, switch, server, and rack for the equipment room and the four point-of-service terminals. Delivery time is two weeks. Ricardo will perform this activity.
4. Install the router and test the connection. Testing depends on the T1 installation at demarcation. The time estimate to install is eight hours. Ricardo’s staff will perform this activity.
5. Install the switch. Based on past experience, the time estimate to install is two hours. Ricardo’s staff will do this activity.
6. Install the server and test. The testing depends on the T1 connection installation. Based on past experience, the time estimate to install is six hours. Ricardo’s staff will do this activity.
7. The web team will add the new store location and phone number to the lookup function on the Internet site. The time estimate is two hours. Ricardo will assign his applications programming manager to this activity. This activity depends on the lease being signed.
Jake and Jill have each written similar lists with estimates and potential resource assignments. You begin to align all the activities in sequential order and discover a problem. Jill needs 14 days to hire personnel and stock shelves, meaning that the build- out must be finished by January 16. Build-out takes approximately 120 days and can’t start before September 20 because of the contractor’s availability. This is a problem because Ricardo’s Ethernet cable expert isn’t available until October 5, and he needs 2 days to complete the cabling. This pushes out the build-out start date by almost 2 weeks, which means the project completion date, or store-opening date, is delayed by 2 weeks.
After gathering more information from Ricardo, you head to Dirk’s office.
“So, Dirk,” you conclude after filling him in on all the details, “we have two options. Hire a contractor to perform the cable run since Ricardo’s person isn’t available or push the store opening out by two weeks.”
Dirk asks, “How much will the contractor charge to run the cable, and are they available within the time frame you need?”
“Yes, they are available, and I’ve already requested that Ricardo book the week of September 18 to hold this option open for us. They’ve quoted a price of $10,000.”
“Okay, let’s bring in the contractor. At this point, $10,000 isn’t going to break the budget. How is that planning coming anyway? Signed a lease yet?”
“Yes, we’ve signed the lease. Jake has been meeting with Gomez Construction on the build-out. We’ve used Gomez on three out of the last five new stores and have had good luck with them.”
You spend the next couple of days working on the project schedule in Microsoft Project, clarifying tasks and activities with Jake, Ricardo, and Jill. You decide that a Gantt chart will work excellently for reporting status for this project. You stare intensely at the problem you see on the screen. The Grand Opening task is scheduled to occur 13 days later than when you need it! The grand opening must happen February 1 and 2, not February 14 and 15 as the schedule shows. You trace the problem back and see that the Grand Opening task depends on Train Store Personnel, which itself depends on several other tasks, including Hire Store Personnel and Install and Test Hardware. Digging deeper, build-out can’t begin until the Ethernet cable is run throughout the building. Ricardo already set up the time with the contractor to run the cable on September 18. This date cannot move, which means build-out cannot start any sooner than September 20, which works with Gomez’s availability.
You pick up the phone and dial Jake’s number. “Jake,” you say into the receiver, “I’m working on the project schedule, and I have some issues with the Gomez activity.”
“Shoot,” Jake says.
“Gomez Construction can’t start work until the Ethernet cable is run. I’ve already confirmed with Ricardo that there is no negotiation on this. Ricardo is hiring a contractor for this activity, and the earliest they can start is September 18. It takes them two days to run the cable, which puts the start date for build-out at September 20.”
“What’s the problem with the September 20 date?” Jake asks
“Jill wants to have the build-out finished prior to hiring the store personnel. During the last store opening, those activities overlapped, and she said it was unmanageable. She wants to hire folks and have them stock the shelves in preparation for store opening but doesn’t want contractors in there while they’re doing it. A September 20 start date for Gomez puts us at a finish date of January 26, which is too late to give Jill time to hire and stock shelves. My question is this: Is 120 days to finish a build-out a firm estimate?”
“Always—I’ve got this down to a science. Gomez has worked with me on enough of these build-outs that we can come within just a couple of days of this estimate either way,” Jake says.
You pick up your schedule detail and continue, “I’ve scheduled Gomez’s resource calendar as you told me originally. Gomez doesn’t work Sundays, and neither do we. Their holidays are Labor Day, a couple of days at Thanksgiving, Christmas, and New Year’s, but this puts us too far out on the schedule. Our February 1 opening must coincide with the Home and Garden Show dates.”
“I can’t change the 120 days. Sounds like you have a problem.”
“I need to crash the schedule,” you say. “What would the chances be of Gomez agreeing to split the build-out tasks? We could hire a second contractor to come in and work alongside Gomez’s crew to speed up this task. That would shorten the duration to 100 days, which means we could meet the February 1 date.”
“Won’t happen. I know Gomez. They’re a big outfit and have all their own crews. We typically work with them exclusively. If I brought another contractor into the picture, I might have a hard time negotiating any kind of favors with them later if we get into a bind.”
“All right,” you say. “How about this? I’m making some changes to the resource calendar while we’re talking. What if we authorize Gomez’s crew to work six 10-hour days, which still leaves them with Sundays off, and we ask them to work on Labor Day and take only one day at Thanksgiving instead of two?”
“I think Gomez would go for that. You realize it’s going to cost you?”
“Project management is all about trade-offs. We can’t move the start date, so chances are the budget might take a hit to accommodate schedule changes or risk. Fortunately, I’m just now wrapping up the final funding requirements, so if you can get me the increased cost from Gomez soon, I’d appreciate it. This change will keep us on track and resolve Jill’s issues too.”
“I don’t think Gomez’s crew will mind the overtime during the holiday season. Everyone can use a little extra cash at that time of year, it seems. I’ll have the figures for you in a day or two.”
Project Case Study Checklist
The main topics discussed in the case study are as follows:
Estimate Activity Durations
Estimate Activity Resources
Developing project schedule
Calendars
Lead and lag time
Critical path
Duration compression
Crashing
Fast tracking
Utilizing project management software
Producing project schedule
Milestones
Gantt chart
Resource leveling
Understanding How This Applies to Your Next Project
The schedule management plan documents how you will define, monitor, control, and change the project schedule. It is the only output of the Plan Schedule Management process. Define Activities and Sequence Activities are the first two processes in the “Activity” sequence you’ll complete on the road to Develop Schedule. You perform Estimate Activity Resources to determine the resource requirements and quantity of resources needed for each schedule activity. For small to medium-sized projects, I’ve found that you can perform this process at the same time as the Estimate Activity Durations process. If you work in an organization where the same resource pool is used for project after project, you already know the people’s skills sets and availability, so you can perform this process at the same time you’re creating the project schedule. The same logic holds for projects where the material resources are similar for every project you conduct. If you don’t have the need to perform this process, I do recommend that you create a resource calendar at a minimum so that you can note whether team members have extended vacations or family issues that could impact the project schedule. Needless to say, if you’re working on a large project or your project teams are new for every project, you should perform the Estimate Activity Resources process rather than combining it with Develop Schedule. It will come in handy later when you’re ready to plug names into the activities listed on the project schedule.
Estimate Activity Durations is a process you’ll perform for most projects on which you’ll work. For larger projects, I’m a big fan of PERT estimates. PERT gives you estimates with a high degree of reliability, which are needed for projects that are critical to the organization, projects that haven’t been undertaken before, or projects that involve complex processes or scope. It’s easy to create a spreadsheet template to automatically calculate these estimates for you. List your schedule activities in each row, and in the individual columns to the right, record the most likely, pessimistic, and optimistic estimates. The final column can hold the calculation to perform the weighted average of these three estimates, and you can transfer the estimates to your schedule. You can easily add columns to calculate standard deviation as well.
In theory, if you’ve performed all the “Activity” processes, the schedule should almost be a no-brainer. You can plug the activity list, resources, estimates, and successor and predecessor tasks into the schedule. From there, you will want to take the next step and determine the critical path. The critical path is, well, critical to your project’s success. If you don’t know which activities are on the critical path, you won’t know what impacts delays or risk events will have on the project. No matter how big or small the project, be sure you know and understand the critical path activities.
Summary
Great job! You’ve made it through the Planning activities associated with the Project Time Management Knowledge Area. I covered several processes in this chapter, including Plan Schedule Management, Define Activities, Sequence Activities, Estimate Activity Resources, Estimate Activity Durations, and Develop Schedule.
Define Activities uses the scope baseline (which includes the project scope statement, WBS, and WBS dictionary) to help derive activities. Activities are used to help derive a basis for estimating and scheduling project work during the Planning processes and for executing and monitoring and controlling the work of the project in later processes.
The Sequence Activities process takes the activities and puts them in a logical, sequential order based on dependencies. Dependencies exist when the current activity relies on some action from a predecessor activity or it impacts a successor activity. Four types of dependencies exist: mandatory, discretionary, external, and internal. PDM (also known as AON) and ADM (also known as AOA) are two methods for displaying project schedule network diagrams. PDM has four logical relationships, or dependencies: finish-to-start, start-to-finish, finish-to-finish, and start-to-start.
The Estimate Activity Resources process considers all the resources needed and the quantity of resources needed to perform project activities. This information is determined for each activity and is documented in the activity resource requirements output.
Duration estimates are produced as a result of the Estimate Activity Durations process. Activity duration estimates document the number of work periods needed for each activity, including their elapsed time. Analogous estimating—also called top-down estimating or gross value estimating—is one way to determine activity duration estimates. You can also use top-down techniques to estimate project durations and total project costs. Parametric estimating techniques multiply a known element—such as the quantity of materials needed—by the time it takes to install or complete one unit of materials. The result is a total estimate for the activity. Three-point estimates use two formulas to calculate estimates, including triangular distributions (an average estimate based on the most likely estimate, a pessimistic estimate, and an optimistic estimate) and beta distributions (the PERT formula). Reserve analysis takes schedule risk into consideration by adding a percentage of time or another work period to the estimate just in case you run into trouble.
PERT calculates a weighted average estimate for each activity by using the optimistic, pessimistic, and most likely times. It then determines variances, or standard deviations, to come up with a total project duration within a given confidence range. Work will finish within plus or minus one standard deviation 68.27 percent of the time. Work will finish within plus or minus two standard deviations 95.45 percent of the time.
Develop Schedule is the process in which you assign beginning and ending dates to activities and determine their duration. You might use CPM to accomplish this. CPM calculates early start, early finish, late start, and late finish dates. It also determines float time. All tasks with zero float are critical path tasks. The critical path is the longest path of tasks in the project.
Schedules sometimes need to be compressed to meet promised dates or to shorten the schedule times. Crashing looks at cost and schedule trade-offs. Adding resources to critical path tasks or approving over time are two ways to crash the schedule. Fast tracking involves performing tasks (or phases) in parallel that were originally scheduled to start one after the other. Crashing may change the critical path; fast tracking does not. Fast tracking usually increases project risk. You can use Monte Carlo analysis in the Develop Schedule process to determine multiple, probable project durations.
Resource leveling is used when resources are overallocated and may create changes to the critical path and project end date. Resource smoothing modifies activities within their floats without changing the critical path or project end date.
The project schedule presents the activities in graphical form through the use of project schedule network diagrams with dates, Gantt charts, milestone charts, and project schedule network diagrams.
Exam Essentials
Be able to name the purpose of the Estimate Activity Resources process. The purpose of Estimate Activity Resources is to determine the types of resources needed (human, equipment, and materials) and in what quantities for each schedule activity within a work package.
Be familiar with the tools and techniques of Estimate Activity Durations. The tools and techniques of Estimate Activity Durations are expert judgment, analogous estimating, parametric estimating, three-point estimating, group decision-making techniques, and reserve analysis.
Know the difference between analogous estimating and bottom-up estimating. Analogous estimating is a top-down technique that uses expert judgment and historical information. Bottom-up estimating performs estimates for each work item and rolls them up to a total.
Be able to calculate the critical path. The critical path includes the activities with durations that add up to the longest path of the project schedule network diagram. Critical path is calculated using the forward pass, backward pass, and float calculations.
Be able to define a critical path task. A critical path task is a project activity with zero or negative float.
Be able to describe and calculate PERT duration estimates. This is a weighted average technique that uses three estimates: optimistic, pessimistic, and most likely. The formula is as follows: (optimistic + pessimistic + (4 × most likely)) / 6.
Be able to describe the difference between resource leveling and resource smoothing. Resource leveling can change the critical path and project end date. Resource smoothing does not change the critical path or project end date.
Be familiar with the duration compression techniques. The duration compression techniques are crashing and fast tracking.
Be able to describe a critical chain. The critical chain is the new critical path in a modified schedule that accounts for limited resources and feeding buffers.
Know the key outputs of the Develop Schedule process. The key outputs are the project schedule and schedule baseline.
Review Questions
You can find the answers to the review questions in Appendix A.
1. You are the project manager for Changing Tides video games. You have gathered the inputs for the Estimate Activity Durations process. Which of the following tools and techniques will you employ to produce the outputs for this process?
A. Activity list, expert judgment, alternatives analysis, analogous estimating, parametric estimating, three-point estimating, and reserve analysis
B. Activity list, expert judgment, analogous estimating, parametric estimating, group decision-making techniques, and three-point estimating
C. Expert judgment, analogous estimating, parametric estimating, three-point estimating, group decision-making techniques, and reserve analysis
D. Expert judgment, alternatives analysis, analogous estimating, parametric estimating, three-point estimating, and group decision-making techniques
2. You are the project manager for Changing Tides video games. You have produced a project schedule network diagram and have updated the activity list. Which process have you just finished?
A. The Define Activities process, which identifies all the specific activities of the project
B. The Sequence Activities process, which identifies all the activity dependencies
C. The Develop Schedule process, which diagrams project network time estimates
D. The Estimate Activity Durations process, which estimates activity durations
3. Your project’s primary constraint is quality. To make certain the project team members don’t feel too pressed for time and to avoid schedule risk, you decide to use which of the following activity estimating tools?
A. Three-point estimates
B. Analogous estimating
C. Reserve analysis
D. Parametric estimating
4. You have been hired as a contract project manager for Grapevine Vineyards. Grapevine wants you to design an Internet wine club for its customers. One of the activities for this project is the installation and testing of several new servers. You know from past experience it takes about 16 hours per server to accomplish this task. Since you’re installing 10 new servers, you estimate this activity to take 160 hours. Which of the estimating techniques have you used?
A. Parametric estimating
B. Analogous estimating
C. Bottom-up estimating
D. Reserve analysis
5. All of the following statements describe the activity list except which one?
A. The activity list is an output of the Define Activities process.
B. The activity list includes all activities of the project.
C. The activity list is an extension of and a component of the WBS.
D. The activity list includes an identifier and description of the activity.
6. You have been hired as a contract project manager for Grapevine Vineyards. Grapevine wants you to design an Internet wine club for its customers. Customers must register before being allowed to order wine over the Internet so that legal age can be established. You know that the module to verify registration must be written and tested using data from Grapevine’s existing database. This new module cannot be tested until the data from the existing system is loaded. This is an example of which of the following?
A. Preferential logic
B. Soft logic
C. Discretionary dependency
D. Hard logic
7. You are the project manager for Design Your Web Site, Inc. Your company is designing the website for a national grocery store chain. You have your activity list in hand and are ready to diagram the activity dependencies using the PDM technique. Which of the following statements is true?
A. PDM is also the AON diagramming method and it uses one time estimate.
B. PDM is also the AOA diagramming method and uses logical relationships.
C. PDM is also the ADM diagramming method and its most common logical relationship is finish-to-start.
D. PDM is also the GERT method, which allows for conditions, branches, and loops.
8. You are working on a project that requires resources with expertise in the areas of hospitality management and entertainment. You are preparing your project schedule network diagram and know that you will use only finish-to-start dependencies. Which of the following diagramming methods does this describe?
A. PDM
B. ADM
C. AON
D. Network template
9. Which logical relationship does the PDM use most often?
A. Start-to-finish
B. Start-to-start
C. Finish-to-finish
D. Finish-to-start
10. You are a project manager for Picture Shades, Inc. Your company manufactures window shades that have replicas of Renaissance-era paintings for hotel chains. Picture Shades is taking its product to the home market, and you’re managing the new project. It will offer its products at retail stores as well as on its website. You’re developing the project schedule for this undertaking and have determined the critical path. Which of the following statements is true?
A. You calculated the most likely start date and most likely finish dates, float time, and weighted average estimates.
B. You calculated the activity dependency and the optimistic and pessimistic activity duration estimates.
C. You calculated the early and late start dates, the early and late finish dates, and float times for all activities.
D. You calculated the optimistic, pessimistic, and most likely duration times, and the float times for all activities.
11. You are a project manager for Picture Shades, Inc. Your company manufactures window shades that have replicas of Renaissance-era paintings for hotel chains. Picture Shades is taking its product to the home market, and you’re managing the new project. It will offer its products at retail stores as well as on its website. You’re developing the project schedule for this undertaking. Looking at the following graph, which path is the critical path?
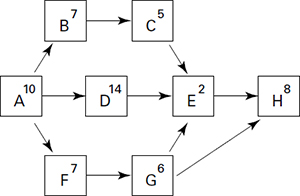
A. A-B-C-E-H
B. A-D-E-H
C. A-F-G-H
D. A-F-G-E-H
12. Use the following graphic to answer this question. If the duration of activity B was changed to 10 days and the duration of activity G was changed to 9 days, which path is the critical path?
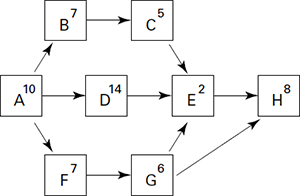
A. A-B-C-E-H
B. A-D-E-H
C. A-F-G-H
D. A-F-G-E-H
13. Which of the following statements is true regarding the critical path?
A. It should not be compressed.
B. It allows for looping and branching.
C. The critical path technique is the same as PERT.
D. It’s the duration of all tasks with zero or negative float.
14. You are a project manager for Move It Now trucking company. Your company specializes in moving household goods across the city or across the country. Your project involves upgrading the nationwide computer network for the company. Your lead engineer has given you the following estimates for a critical path activity: 60 days most likely, 72 days pessimistic, 48 days optimistic. What is the weighted average or expected value?
A. 54
B. 66
C. 60
D. 30
15. You are a project manager for Move It Now trucking company. Your company specializes in moving household goods across the city or across the country. Your project involves upgrading the nationwide computer network for the company. Your lead engineer has given you the following estimates for a critical path activity: 60 days most likely, 72 days pessimistic, 48 days optimistic. What is the standard deviation?
A. 22
B. 20
C. 2
D. 4
16. If you know the expected value is 500 and the standard deviation is 12, you can say with approximately a 95 percent confidence rating which of the following?
A. The activity will take from 488 to 512 days.
B. The activity will take from 464 to 536 days.
C. The activity will take from 494 to 506 days.
D. The activity will take from 476 to 524 days.
17. If your expected value is 110 and the standard deviation is 12, which of the following is true?
A. There is approximately a 99 percent chance of completing this activity in 86 to 134 days.
B. There is approximately a 68 percent chance of completing this activity in 98 to 122 days.
C. There is approximately a 95 percent chance of completing this activity in 98 to 122 days.
D. There is approximately a 75 percent chance of completing this activity in 86 to 134 days.
18. You are the project manager working on a research project for a new drug treatment. Your preliminary project schedule runs past the due date for a federal grant application. The manager of the R&D department has agreed to release two resources to work on your project to meet the federal grant application date. This is an example of ________________.
A. crashing
B. fast tracking
C. resource leveling
D. adjusting the resource calendar
19. You are the project manager for Rivera Gourmet Adventure Vacations. Rivera combines the wonderful tastes of great gourmet food with outdoor adventure activities. Your project involves installing a new human resources software system. Your stakeholders understand this is a large undertaking and that you might experience some schedule slippage. Jason, the database analyst working on this project, is overallocated. He is critical to the success of the project and you don’t want to burn him out by overscheduling him. Which of the following actions should you take?
A. You should use fast tracking to smooth out resource overallocation.
B. You should use crashing to resource level the critical path tasks.
C. You should use resource leveling to balance out resource assignments.
D. You should use resource smoothing to smooth out resource assignments.
20. What is one of the problems with project management software?
A. The project manager manages the software instead of the project.
B. Project duration calculations are sometimes approximate.
C. You cannot override the project management software decisions regarding schedules.
D. It’s expensive and difficult to use.