
Chapter 6 Risk Planning
THE PMP® EXAM CONTENT FROM THE PLANNING PERFORMANCE DOMAIN COVERED IN THIS CHAPTER INCLUDES THE FOLLOWING:
✓ Task 10: Plan for risk management by developing a risk management plan; identifying, analyzing, and prioritizing project risks; creating the risk register; and defining risk response strategies in order to manage uncertainty and opportunity throughout the project life cycle.
✓ Knowledge and Skills:
Requirements gathering techniques (e.g., planning sessions, brainstorming, and focus groups)
Regulatory and environmental impacts assessment planning
Risk management planning
Risk is evident in everything we do. When it comes to project management, understanding risk and knowing how to minimize its impacts (or take full advantage of its opportunities) on your project are essential for success. This entire chapter is dedicated to project risk. Five of the six risk processes, all contained in the Risk Management Knowledge Area, fall in the Planning process group. I’ll cover Plan Risk Management, Identify Risks, Perform Qualitative Risk Analysis, Perform Quantitative Risk Analysis, and Plan Risk Responses in this chapter. I’ll follow up with the last risk process, Control Risks, in Chapter 11, “Controlling Work Results.”
Hold on to your hats! I’m going to cover a lot of material in this chapter, but it will go fast. I promise.
NOTE
The process names, inputs, tools and techniques, outputs, and descriptions of the project management process groups and related materials and figures in this chapter are based on content from A Guide to the Project Management Body of Knowledge (PMBOK® Guide), Fifth Edition (PMI, 2013).
Planning for Risks
Every one of us takes risks on a daily basis. Just getting out of bed in the morning is a risk. You might stub your toe in the dark on the way to the light switch or trip over the dog and break a leg. These events don’t usually happen, but the possibility exists. The same is true for your project. Risk exists on all projects, and the potential that a particular risk event will occur depends on the nature of the risk.
Risk, like most of the elements of the other Planning processes, changes as the project progresses and should be monitored throughout the project. As you get close to a risk event, that’s the time to reassess your original assumptions about it and your plans to deal with it and make any adjustments as required.
Not all risks are bad. Risks can present future opportunities as well as future threats to a project. Risk events may occur due to one reason or several reasons, and they may have multiple impacts. All risks have causes, and if the risk event occurs during a project, there are consequences. Those consequences will likely impact one or more of the project objectives, and you’ll need to know whether the consequences have positive or negative impacts.
Risk is, after all, uncertainty. The more you know about risks and their impacts beforehand, the better equipped you will be to handle a risk event when it occurs. The processes that involve risk, probably more than any other project Planning process, concern balance. You want to find that point where you and the stakeholders are comfortable with the risk based on the benefits you can potentially gain. In a nutshell, you’re balancing the action of taking a risk against avoiding the consequences or impacts of a risk event or enjoying the benefits it may bring. The rest of this chapter will deal with finding out what risk events might occur (and how to deal with risks that are unknown), determining an organization’s tolerance for risk taking, and developing action plans for risks you’ve determined have hefty impacts. The first step is performing the Plan Risk Management process. Here, you determine the approach you’ll use for risk management activities and document your plans for them in a risk management plan. You’ll look at that process now.
Planning Your Risk Management
Risks come about for many reasons. Some are internal to the project, and some are external. The project environment, the planning process, the project management process, inadequate resources, and so on can all contribute to risk. Some risks you’ll know about in advance and plan for during this process; others risk events will occur unannounced during the project. The Plan Risk Management process determines how you’ll prepare for and perform risk management activities on your project.
To document the risk management plan, you need to gather some inputs that will help you determine your organization’s risk policies and tolerance for risk. You’ll look at those inputs next.
Plan Risk Management Inputs
Risks associated with a project are generally concerned with any number and combination of four project objectives—time, cost, scope, and quality. As you might have guessed, the project management plan is an input to this process and it includes the scope statement, which describes your project deliverables. The inputs of this process are as follows:
Project management plan
Project charter
Stakeholder register
Enterprise environmental factors
Organizational process assets
The risk attitude of the organization and the stakeholders is a key element of the enterprise environmental factors input. Risk attitude consists of three elements:
Risk Appetite Risk appetite is the level of uncertainty the stakeholders are willing to accept in exchange for the potential positive impacts of the risk. For example, let’s say your organization is a multinational manufacturing firm that is implementing a new inventory system. The end users are grumbling and have expressed their concerns for the new system. The old system does everything they want it to do, and they are not interested in this new technology. There is a potential for the represented employees to protest this new system, and such a reaction could impact production. Your stakeholders are willing to accept this risk even though they don’t know if, or to what extent, production may be impacted because the benefits of the new system far outweigh the potential unknown impacts of employees protesting.
Risk Tolerance Risk tolerance is that balance I talked about earlier where stakeholders are comfortable taking a risk because the known benefits to be gained outweigh what could be lost—or just the opposite. They will avoid taking a risk because the cost or impact is too great given the amount of benefit that can be derived. Here’s an example to describe risk tolerance: Suppose you’re a 275-pound brute who’s surrounded by three bodyguards of equal proportion everywhere you go. Chances are, walking down a dark alley in the middle of the night doesn’t faze you in the least. That means your risk tolerance for this activity is high. However, if you’re a petite 90-pounder without the benefit of bodyguards or karate lessons, performing this same activity might give you cause for concern. Your risk tolerance is low, meaning you wouldn’t likely do this activity. The higher your tolerance for risk, the more you’re willing to take on risk and its consequences.
Risk tolerance is different than risk appetite because risk appetite concerns the amount of uncertainty you are willing to take on to gain a benefit whereas risk tolerance concerns the amount of risk, and hence the potential consequences or benefits you might gain or lose if the risk event occurs.
NOTE
Organizations and stakeholders, as well as individuals, all have different tolerances for risk. One organization might believe that the risk of a potential 7 percent cost overrun is high, whereas another might think it’s low. However, either one of these organizations might decide to accept the risk if it believes the risk is in balance with the potential rewards. It’s important for the project manager to understand the tolerance level that the organization and the stakeholders have for risk before evaluating and ranking risk.
Risk Threshold Risk thresholds are measures or levels of uncertainty or impact the organization is willing to operate within. For example, a monetary risk threshold might state if the risk poses a threat that could cost more than 5 percent of the total project budget, the risk should not be accepted. If it’s below 5 percent, it may be accepted.
Remember that organizational process assets include policies and guidelines that might already exist in the organization. Your organization’s risk categories, risk statement formats, and risk templates should be considered when planning for risks. Also, when developing the risk management plan, consider the defined roles and responsibilities and the authority levels the stakeholders and project manager have for making decisions regarding risk planning.
The project management plan includes all of the subsidiary plans and baselines for the project. This is the first place you’ll start looking when identifying risks, and it should be considered when determining the process you’ll use to evaluate risks. The risk management plan (the only output of this process) will also become part of the project management plan.
Tools and Techniques for Plan Risk Management
The Plan Risk Management process has three tools and techniques: analytical techniques, expert judgment, and meetings.
Analytical techniques in this case are understanding stakeholder risk appetites and tolerances, developing a method for scoring risks, and determining the risk exposure of the project. We will cover these topics in more depth throughout the remainder of this chapter.
The purpose of meetings—which are held with project team members, stakeholders, functional managers, and others who might have involvement in the risk management process—is to contribute to the risk management plan. During these meetings, the fundamental plans for performing risk management activities will be discussed and determined and then documented in the risk management plan.
The key outcomes of performing these planning meetings are as follows:
Risk cost elements are developed for inclusion in the project budget.
Schedule activities associated with risk are developed for inclusion in the project schedule.
Risk responsibilities are assigned.
The risk contingency reserve process is established or reviewed.
Templates for risk categories are defined or modified for this project.
Definitions of terms (probability, impact, risk types, risk levels, and so on) are developed and documented.
The probability and impact matrix is defined or modified for this project.
NOTE
I’ll discuss risk responsibilities, define the terms associated with risk management, and help you construct your own probability and impact matrix in the remaining sections of this chapter.
![]() Real World Scenario
Real World Scenario
Julia is the project manager for a small project her department is undertaking. The project objective is to give customers the ability to download videos of the properties her organization has listed for lease. Two programmers from the information technology department will be working on the updates to the website, programming the links, and so on. The project sponsor wants to fast-track this project. She’d like to skip most of the Planning processes, and she sees no need for a risk management plan. Julia explains to the sponsor that the risk management plan for a project this size might be only a paragraph or two long. She emphasizes the importance of documenting how they’ll identify risks, how they’ll quantify them, and how they’ll monitor the risks as the project progresses. Julia has project management experience on projects of all sizes and knows firsthand that ignoring this step could bring some unexpected surprises to the sponsor later in the project. She explains a bad past experience where this step was ignored and then assures the sponsor that they can probably agree to the plan, identify and quantify the risks, and determine response plans in an hour and a half or less. The sponsor now understands the issues and agrees to the meeting.
Ultimately, your goal for this process is documenting the risk management plan. This document is the basis for understanding the remaining risk processes. Because the risk management plan encompasses a wealth of information, I’ve given this topic its own section. Let’s get to it.
Creating the Risk Management Plan
The purpose of the Plan Risk Management process is to create a risk management plan, which describes how you will define, monitor, and control risks throughout the project. This involves identifying risks, analyzing and prioritizing them, and developing risk response strategies so that you can manage both uncertainty and opportunity throughout the life of the project. The risk management plan is a subsidiary of the project management plan, and it’s the only output of this process.
The risk management plan details how risk management processes (including Identify Risks, Perform Qualitative Risk Analysis, Perform Quantitative Risk Analysis, Plan Risk Responses, and Control Risks) will be implemented, monitored, and controlled throughout the life of the project. It details how you will manage risks but does not attempt to define responses to individual risks.
NOTE
I’ll talk about how to develop the risk response plans in the section “Developing a Risk Response Plan” later in this chapter.
According to the PMBOK® Guide, the risk management plan should include the following elements:
Methodology
Roles and responsibilities
Budgeting
Timing
Risk categories
Definitions of risk probability and impact
Probability and impact matrix
Revised stakeholder tolerances
Reporting formats
Tracking
You’ll take a look at most of these elements next. However, risk categories, probability and impact, and probability and impact matrix are pretty meaty topics, so I’ll cover those in their own sections following this one:
Methodology Methodology is a description of how you’ll perform risk management, including elements such as methods, tools, and where you might find risk data that you can use in the later processes.
Roles and Responsibilities Roles and responsibilities describe the people who are responsible for managing the identified risks and their responses for each type of activity identified in the risk management plan. These risk teams might not be the same as the project team. Risk analysis should be unbiased, which might not be possible when project team members are involved.
Budgeting The budget for risk management is included in the plan as well. With this category, you’ll assign resources and estimate the costs of risk management and its methods, including contingency reserves. These costs are then included in the project’s cost baseline.
Timing Timing documents the timing of the risk management processes (including when and how often they’ll be performed on the project) and includes the activities associated with risk management in the project schedule.
Revised Stakeholder Tolerances This is just as it implies. As you proceed through the risk management processes, you might find that risk tolerances will change. Document those new tolerance levels in the risk management plan.
Reporting Formats Reporting formats describe the content of the risk register and the format of this document. (I’ll talk more about the risk register later in this chapter.) Reporting formats also detail how risk management information will be maintained, updated, analyzed, and reported to project participants.
Tracking This includes a description of how you’ll document the history of the risk activities for the current project and how the risk processes will be audited. You can reference this information when you’re performing risk-planning processes later in the current project or on future projects. This information is also helpful for lessons learned, which I’ll cover in Chapter 9, “Conducting Procurements and Sharing Information.”
Risk Categories
Risk categories are a way to systematically identify risks and provide a foundation for understanding. When determining and identifying risks, the use of risk categories helps improve the process by giving everyone involved a common language or basis for describing risk.
Risk categories should be identified during this process and documented in the risk management plan. These categories will assist you in making sure the next process, Identify Risks, is performed effectively and produces a quality output. The following list includes some examples of the categories you might consider during this process (or modify based on previous project information):
Technical, quality, and performance risks
Project management risks
Organizational risks
External risks
You can go about describing categories of risk in a couple of ways. One way is simply listing them. You could, and should, review prior projects for risk categories and then tailor them for this project.
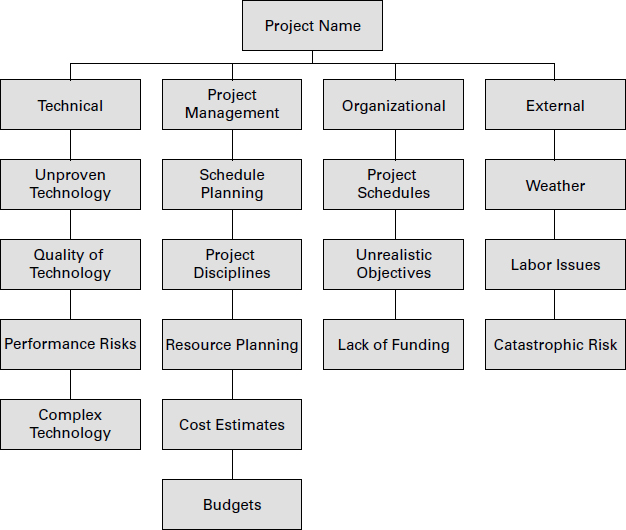
You could also construct a risk breakdown structure (RBS), which lists the categories and subcategories. Figure 6.1 shows a sample of an RBS.
FIGURE 6.1 Risk breakdown structure
NOTE
The organizational process assets input might include an RBS that you can reference for this project. Don’t forget your PMO. The project management office might have templates or an RBS already developed.
Risk categories might reflect the type of industry or application area in which the project exists. For example, information technology projects will likely have many risks that fall into the technical category, whereas construction projects might be more subject to risks that fall into the external risks category. The categories do not have to be industry specific, however. Keep in mind that project management, for example, is a risk for every project in every industry. You can find a description of each of the categories next:
Technical/Quality/Performance Risks Technical, quality, and performance risks include risks associated with unproven technology, complex technology, or changes to technology anticipated during the course of the project. Performance risks might include unrealistic performance goals. Perhaps one of the project deliverables concerns a component manufactured to specific performance standards that have never been achieved. That’s a performance risk.
Project Management Risks The project management risk category includes improper schedule and resource planning, poor project planning, and improper or poor project management disciplines or methodologies.
Organizational Risks The organizational risk category can include resource conflicts because of multiple projects occurring at the same time in the organization; scope, time, and cost objectives that are unrealistic given the organization’s resources or structure; and lack of funding for the project or diverting funds from this project to other projects.
External Risks The external risk category includes those aspects that are external to the project, such as new laws or regulations, labor issues, weather, changes in ownership, and foreign policy for projects performed in other countries. Catastrophic risks—known as force majeure—are usually outside the scope of Plan Risk Management and instead require disaster recovery techniques. Force majeure includes events such as earthquakes, meteorites, volcanoes, floods, civil unrest, terrorism, and so on.
Defining Probability and Impact
When you’re writing the risk management plan, you’ll want to document the definitions for probability and impact as they relate to potential negative risk events and their impacts on the four project objectives. Probability describes the potential for the risk event occurring, whereas impact describes the effects or consequences the project will experience if the risk event occurs. This definition can be sophisticated or simple. For example, you might use numeric values to define probability and impact or simply assign a high-medium-low rating to each risk. What’s important to note now is that you don’t use these probability and impact definitions here. You use these definitions later in the Perform Qualitative Risk Analysis process. (I’ll talk in depth about probability and impact in the section “Analyzing Risks Using Qualitative Techniques” later in this chapter.) But you should define and document them here in the risk management plan.
Probability and Impact Matrix
A probability and impact matrix prioritizes the combination of probability and impact scores and helps you determine which risks need detailed risk response plans. For example, a risk event with a high probability of occurring and a high impact will likely need a response plan. This matrix is typically defined by the organization, but if you don’t have one, you’ll need to develop this now—during your planning meetings (a tool and technique of this process). You’ll use this matrix in the Perform Qualitative Risk Analysis process, and I’ll talk more in depth about it in the section “Analyzing Risks Using Qualitative Techniques” later in this chapter. Again, you want to define (or modify) and document the probability and impact matrix in the risk management plan.
NOTE
The key point about this process is that you’ll define what the probability and impact tools look like now during Plan Risk Management so that the team has an agreed-upon basis for evaluating the identified risks later during the Perform Qualitative Risk Analysis process.
To recap, the steps associated with these last few elements of the risk management plan are as follows:
1. Define the risk categories (these will assist the risk team in the Identify Risks process).
2. Determine how probability and impact will be defined (to be used in the Perform Qualitative Risk Analysis process).
3. Develop or modify the probability and impact matrix (to be used in the Perform Qualitative Risk Analysis process).
Doing all these steps, together with the other elements of the risk management plan, gives you and the risk management team a common understanding for evaluating risks throughout the remainder of the project.
Identifying Potential Risk
The Identify Risks process involves identifying all the risks that might impact the project, documenting them, and documenting their characteristics. Identify Risks is an iterative process that continually builds on itself. As you progress through the project, more risks might present themselves. Once you’ve identified or discovered a potential new risk, you should analyze it to determine whether a response plan is needed. You can see that the risk management cycle starts again with Identify Risks and progresses through the remaining risk processes to determine what to do about them.
You can include several groups of folks to help identify risks, including project team members, risk team members, stakeholders, subject matter experts, users of the final product or service, and anyone else who you think might help in the process. Perhaps in the first round of Identify Risks you could include just the project team and subject matter experts and then bring in the stakeholders or risk management team to further flesh out risks during the second round of identification. Risk events can occur at any time during the project, and all project participants should be encouraged to continually watch for and report potential risk events.
NOTE
I’ll talk more about the techniques you can use to identify risks in the section “Tools and Techniques for Identify Risks.”
Risks might or might not adversely affect the project. Some risks have positive consequences, whereas others have negative consequences. However, you should identify all risk events and their consequences. Here’s a partial list to get you thinking about where risk might be found:
Budgets/funding
Schedules
Scope or requirements changes
Project plan
Project management processes
Technical issues
Personnel issues
Hardware
Contracts
Political concerns
Business processes
Legal processes and activities
Environmental concerns
Management policies, processes, and attitudes
This is by no means an exhaustive list. Remember that risk is uncertainty, and realize that risk (uncertainty) is lurking almost anywhere on your project. It’s your job to discover as many of the potential risks as possible using the tools and techniques of this process and to document these risks.
Identify Risks Inputs
The inputs to the Identify Risks process are as follows:
Risk management plan
Cost management plan
Schedule management plan
Quality management plan
Human resource management plan
Scope baseline
Activity cost estimates
Activity duration estimates
Stakeholder register
Project documents
Procurement documents
Enterprise environmental factors
Organizational process assets
We have covered each of these inputs previously, with the exception of the quality management plan and the human resource management plan. We’ll talk about both of these inputs in Chapter 7, “Planning Project Resources,” where we will discuss quality planning and human resource planning in depth. For purposes of the Identify Risks process, understand that the quality management process, identified in the quality management plan, has the potential to produce or prevent risks itself. We’ll touch on a few of the key elements of some of these other inputs also.
You should pay particular attention to the roles and responsibilities section of the risk management plan and the budget and schedule for risk activities. Don’t forget to examine the categories of risks as well. This is a great place to start when you get the team together and begin brainstorming your list of risks.
The project scope statement, part of the scope baseline, contains a list of project assumptions. You’ll recall that assumptions are things believed to be true. During the risk-planning stages of your project and throughout the work of the project, it’s imperative to revisit and revalidate your project assumptions. At the time you recorded an assumption about vendor deliveries, for example, the vendor had a great track record and never missed a date. Months later on the project, that vendor merges with one of its competitors. Now you’ll need to reexamine your assumptions about delivery times and determine whether the assumption is still valid or whether you have a risk on your hands.
The cost, schedule, and human resource management plans can be helpful sources when identifying risks. You should also consider network diagrams, baselines, work performance reports, and other project information during this process.
The enterprise environmental-factors input concerns aspects from outside the project that might help you determine or influence project outcomes. Be certain to check for industry information (commercial databases, checklists, benchmarking studies, and so on) or academic research that might exist for your application areas regarding risk information.
As always, don’t forget about historical information such as previous project experiences via the project files. You might find risk templates and lessons learned in these files that will help with the current project. Project team knowledge is another form of historical information.
NOTE
Although the PMBOK® Guide doesn’t mention it, I’ve found that other elements of your project are helpful when identifying risk, such as the work breakdown structure (WBS), the staffing management plan, project staff assignments, and resource availability. In practice, you should examine the outputs of most of the Planning processes when attempting to identify risks.
Tools and Techniques for Identify Risks
The Identify Risks process is undertaken using seven tools and techniques:
Documentation reviews
Information gathering
Checklist analysis
Assumptions analysis
Diagramming techniques
SWOT analysis
Expert judgment
You’ll learn more about each of these in the following sections.
Documentation Reviews
Documentation reviews involve reviewing project plans, assumptions, procurement documents, and historical information from previous projects from both a total project perspective and an individual deliverables and activities level. This review helps the project team identify risks associated with the project objectives. Pay attention to the quality of the plans (is the content complete, or does it seem to lack detail?) and the consistency between plans. An exceptionally documented schedule is great, but if the budget isn’t as well documented, you might have some potential risks.
Information Gathering
Information gathering encompasses several techniques, including brainstorming, the Delphi technique, interviewing, and root cause analysis. The goal of these techniques is to end up with a comprehensive list of risks at the end of the meeting. Let’s take a quick look at each of these techniques.
Brainstorming
Brainstorming is probably the most often used technique of the Identify Risks process. You’ve probably used this technique many times for many purposes. Brainstorming involves getting subject matter experts, team members, risk management team members, and anyone else who might benefit the process in a room and asking them to start identifying possible risk events. The trick here is that one person’s idea might spawn another idea, and so on, so that by the end of the session you’ve identified all the possible risks. The facilitator could start the group off by going through the categories of risks to get everyone thinking in the right direction. Edward de Bono devised a method of brainstorming called Six Thinking Hats (based on his book by the same name) that you might want to investigate. You may recall that Edward de Bono is also noted for lateral thinking techniques, which we discussed in Chapter 3, “Developing the Project Scope Statement.”
Delphi Technique
The Delphi technique is a lot like brainstorming, except that the people participating in the meeting don’t know one another. In fact, the people participating in this technique don’t all have to be located in the same place and usually participate anonymously. You can use email to facilitate the Delphi technique easily.
What you do is assemble your experts, from both inside and outside the company, and provide them with a questionnaire to identify potential risks. The questionnaire is often designed with forced choices that require the experts to select between various options. The questionnaire asks participants about risks associated with the project, the business process, and the product of the project, and it asks the readers to rank their answers in regard to the potential impacts of the risks. They in turn send their responses back to you (or to the facilitator of this process). All the responses are organized by content and sent back to the Delphi members for further input, additions, or comments. The participants then send their comments back one more time, and the facilitator compiles a final list of risks.
The Delphi technique is a great tool that allows consensus to be reached quickly. It also helps prevent one person from unduly influencing the others in the group and, therefore, prevents bias in the outcome because the participants are usually anonymous and don’t necessarily know how others in the group responded.
Interviewing
Interviews are question-and-answer sessions held with others, including other project managers, subject matter experts, stakeholders, customers, the management team, project team members, and users. These folks provide you with possible risks based on their past experiences with similar projects.
This technique involves interviewing those folks with previous experience on projects similar to yours or those with specialized knowledge or industry expertise. Ask them to tell you about any risks that they’ve experienced or that they think might happen on your project. Show them the WBS and your list of assumptions to help get them started thinking in the right direction.
Root Cause Analysis
Did you ever hear someone say you’re looking at the symptoms and not at the problem? That’s the idea here. Root cause analysis involves digging deeper than the risk itself and looking at the cause of the risk. This helps define the risk more clearly, and it also helps you later when it’s time to develop the response plan for the risk.
Checklist Analysis
Checklists used during the Identify Risks process are usually developed based on historical information and previous project team experience. If you typically work on projects that are similar in nature, begin to compile a list of risks. You can then convert this to a checklist that will allow you to identify risks on future projects quickly and easily. You can also use the lowest level of the RBS as a checklist. However, don’t rely solely on checklists for Identify Risks because you might miss important risks. It isn’t possible for a single checklist to be an exhaustive source for all projects. You can improve your checklists at the end of the project by adding the new risks that were identified.
Assumptions Analysis
Assumptions analysis is a matter of validating the assumptions you identified and documented during the course of the project-planning processes. Assumptions should be accurate, complete, and consistent. Examine all your assumptions for these qualities. Assumptions are also used as jumping-off points to further identify risks.
The important point to note about the project assumptions is that all assumptions are tested against two factors:
The strength of the assumption or the validity of the assumption
The consequences that might impact the project if the assumption turns out to be false
All assumptions that turn out to be false should be evaluated and scored just as risks.
Diagramming Techniques
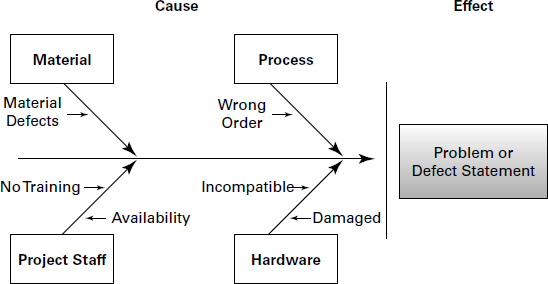
Three types of diagramming techniques are used in Identify Risks: cause-and-effect, system or process flowcharts, and influence diagrams. Cause-and-effect diagrams show the relationship between the effects of problems and their causes. This diagram depicts every potential cause and subcause of a problem and the effect that each proposed solution will have on the problem. This diagram is also called a fishbone diagram, and it’s also called an Ishikawa diagram after its developer, Kaoru Ishikawa. Figure 6.2 shows an example cause- and-effect diagram.
FIGURE 6.2 Cause-and-effect diagram
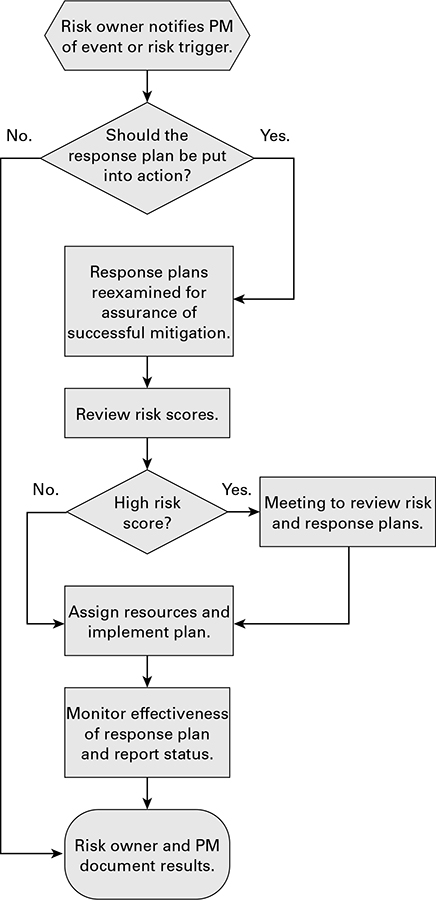
The system or process flowchart shows the logical steps needed to accomplish an objective, how the elements of a system relate to each other, and what actions cause what responses. This flowchart is probably the one with which you’re most familiar. It’s usually constructed with rectangles and parallelograms that step through a logical sequence and allow for “Yes” and “No” branches (or some similar type of decision). Figure 6.3 shows a flowchart to help determine whether risk response plans should be developed for the risk (I’ll talk about response plans in the section “Developing a Risk Response Plan” later in this chapter).
NOTE
Cause-and-effect diagrams and system or process flowcharts are used in the Identify Risks process as well as in the Control Quality process.
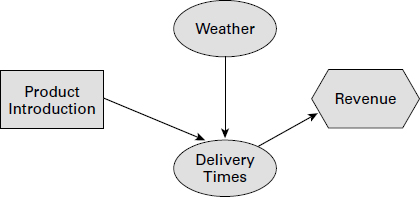
A third diagramming technique used during Identify Risks is called influence diagramming. According to the PMBOK® Guide, influence diagrams typically show the causal influences among project variables, the timing or time ordering of events, and the relationships among other project variables and their outcomes. Simply put, they visually depict risks (or decisions), uncertainties, or impacts and how they influence each other. Figure 6.4 shows an influence diagram for a product introduction decision. The weather is a variable that could impact delivery time, and delivery time is a variable that can impact when revenues will occur.
Each of these techniques provides a way for you to help identify project risks. It’s important that you identify all the risks early in the process. The better job you do of identifying the project’s risks at the Planning stage, the more comprehensive the risk response plan will be. Identify Risks is not an area of project planning that you should skip.
Strengths, Weaknesses, Opportunities, and Threats (SWOT)
Strengths, weaknesses, opportunities, and threats (also known as SWOT analysis) is a technique that examines the project from each of these viewpoints. It also requires examining the project from the viewpoint of the project itself and from project management processes, resources, the organization, and so on to identify risks, including those that are generated internally to the project. Strengths and weaknesses are generally related to issues that are internal to the organization. Strengths are what your organization does well according to your customers, or the marketplace. Weaknesses are areas the organization could improve upon. Typically, negative risks are associated with the organization’s weaknesses and positive risks are associated with its strengths. Opportunities and threats are usually external to the organization. SWOT analysis is sometimes known as internal-external analysis and can be used in combination with brainstorming techniques to help discover and document potential risks.
Expert Judgment
Experts for risk identification purposes can include anyone who has experience working on similar projects, experience working in the business area for which the project was undertaken, or specific industry experience. When using this technique, you should consider any bias your experts may have regarding the project or potential risk events.
Identify Risks Outputs
The output of the Identify Risks process is the risk register. Everything you’ve done in this process up to this point will get documented here. The risk register contains the following elements:
List of identified risks
List of potential responses
The risk register also often contains warning signs, or triggers, although they aren’t listed as an official part of the register. You’ll take a look at all of these elements next. Understand that all risks should be documented, tracked, reviewed, and managed throughout the project.
List of Identified Risks
Risks are all the potential events and their subsequent consequences that could occur as identified by you and others during this process. You might want to consider logging your risks in a risk database or tracking system to organize them and keep a close eye on their status. This can easily be done in spreadsheet format or whatever method you choose. List the risks, assign each risk a tracking number, and note the potential cause or event and the potential impact. This list gives you a means to track the risks, their occurrence, and the responses implemented.
List of Potential Responses
You might identify potential responses to risks at the same time you’re identifying the risks. Sometimes just identifying a risk will tell you the appropriate response. Document those responses here. You’ll refer to them again in the Plan Risk Responses process a little later in this chapter.
A sample risk register is shown in Table 6.1. As you progress through the risk planning processes, and through the project itself, more risks may be identified and more information will become known about the risks. You should update the risk register with new information as it becomes known.
ID |
Risk |
Trigger |
Event |
Cause |
Impact |
Owner |
Response Plan |
1 |
Infrastructure team is not available when needed |
Predecessor tasks not completed on time |
Operating system upgrade delayed |
Equipment was not delivered on time |
Schedule delay |
Brown |
Compress the schedule by beginning tasks in the next milestone while working on operating system upgrade |
Triggers
Triggers are warning signs or symptoms that a risk event is about to occur. For example, if you’ve ever suffered from a hay fever attack, you can’t mistake the itchy, runny nose and scratchy throat that can come on suddenly and send you into a sneezing frenzy. Signals like this are known as triggers, and they work the same way when you’re determining whether a risk event is about to occur. For example, if you’re planning an outdoor gathering and rain clouds start rolling in from the north on the morning of the activity, you probably have a risk event waiting to happen. A key team member hinting about job hunting is a warning sign that the person might be thinking of leaving, which in turn can cause schedule delays, increased costs, and so on. This is another example of a trigger.
Triggers are not listed as one of the risk register elements until the Plan Risk Responses process is carried out, but in practice this is an appropriate time to list them. You will likely encounter questions on the exam about triggers, so don’t say I didn’t warn you. Also, throughout the remainder of the project, be on the alert for triggers that might signal that a risk event is about to occur.
Analyzing Risks Using Qualitative Techniques
The Perform Qualitative Risk Analysis process involves determining what impact the identified risks will have on the project objectives and the probability they’ll occur. It also ranks the risks in priority order according to their effect on the project objectives so that you can spend your time efficiently by focusing on the high-priority risks. This helps the team determine whether Perform Quantitative Risk Analysis should be performed or whether you can skip right to developing response plans. The Perform Qualitative Risk Analysis process also considers risk tolerance levels, especially as they relate to the project constraints (scope, time, cost, and quality) and the time frames of the potential risk events.
The Perform Qualitative Risk Analysis process should be performed throughout the project. This process is the one you’ll find you’ll use most often when prioritizing project risks because it’s fast, relatively easy to perform, and cost effective. The PMBOK® Guide notes that you should identify and manage the risk attitudes of those assisting with this process, and if bias is introduced, you should evaluate it and correct it if necessary. It also notes that simply conducting the Perform Qualitative Risk Analysis process and evaluating the impact and probability of risks can help to keep bias at a minimal level.
Perform Qualitative Risk Analysis Inputs
The Perform Qualitative Risk Analysis process has five inputs:
Risk management plan
Scope baseline
Risk register
Enterprise environmental factors
Organizational process assets
The critical element in this process, as with most of the processes where the risk register is an input, is the list of risks contained in the risk register. The risk management plan documented the roles and responsibilities of risk team members, budget and schedule factors for risk activities, the stakeholder risk tolerances, the definitions for probability and impact, and the probability and impact matrix, all of which should be utilized when prioritizing risks. You’ll examine probability and impact more closely in the next section, “Tools and Techniques for Perform Qualitative Risk Analysis.”
The scope baseline describes the deliverables of the project, and from there you should be able to determine whether you’re dealing with a high level of uncertainty or a project that’s similar in size and scope to one you’ve performed before. Projects with high levels of uncertainty or that are more complex than what the team has undertaken before require more diligence during the Perform Qualitative Risk Analysis process.
As with the Identify Risks process, you should examine historical information and lessons learned from past projects as a guide for prioritizing the risks for this project. Risk databases from your industry or application area can be used here as well. These are part of the organizational process assets input.
The real key to this process lies in the tools and techniques you’ll use to prioritize risks. Hold on tight because you’re going in the deep end.
Tools and Techniques for Perform Qualitative Risk Analysis
The Perform Qualitative Risk Analysis process’s tools and techniques are primarily concerned with discovering the probability of a risk event and determining the impact (or consequences) the risk will have if it does occur. The output of this process is project documents updates (that will include risk register updates) where you’ll document the prioritized risks you’ve scored using these tools and techniques. All the information you gather regarding risks and probability needs to be as accurate as possible. It’s also important that you gather unbiased information so that you don’t unintentionally overlook risks with great potential or consequences.
The purpose of this process is to determine risk event probability and risk impact and to prioritize the risks and their responses. You’ll use the tools and techniques of this process to establish risk scores, which is a way of categorizing the probability and risk impact. The Perform Qualitative Risk Analysis process includes the following tools and techniques:
Risk probability and impact assessment
Probability and impact matrix
Risk data quality assessment
Risk categorization
Risk urgency assessment
Expert judgment
We’ll look at each of these tools and techniques next.
Risk Probability and Impact Assessment
This tool and technique assesses the probability that the risk events you’ve identified will occur, and it determines the effect their impacts have on the project objectives, including time, scope, quality, and cost. Analyzing risks in this way allows you to determine which risks require the most aggressive management. When determining probabilities and impacts, you’ll refer to the risk management plan element called “definitions of risk probability and impact.”
Probability
Probability is the likelihood that an event will occur. The classic example is flipping a coin. There is a 0.50 probability of getting heads and a 0.50 probability of getting tails on the flip. Note that the probability that an event will occur plus the probability that the event will not occur always equals 1.0. In this coin-flipping example, you have a 0.50 chance that you’ll get heads on the flip. Therefore, you have a 0.50 chance you will not get heads on the flip. The two responses added together equal 1.0. Probability is expressed as a number from 0.0—which means there is no probability of the event occurring—to 1.0—which means there is 100 percent certainty the event will occur.
Determining risk probability can be difficult because it’s most commonly accomplished using expert judgment. In nonproject management terms, this means you’re guessing (or asking other experts to guess) at the probability a risk event will occur. Granted, you’re basing your guess on past experiences with similar projects or risk events, but no two risk events (or projects) are ever the same. It’s best to fully develop the criteria for determining probability and get as many experts involved as you can. Carefully weigh their responses to come up with the best probability values possible.
Impact
Impact is the amount of pain (or the amount of gain) the risk event poses to the project. The risk impact scale can be a relative scale (also known as an ordinal scale) that assigns values such as high, medium, or low (or some combination of these) or a numeric scale known as a cardinal scale. Cardinal scale values are actual numeric values assigned to the risk impact. Cardinal scales are expressed as values from 0.0 to 1.0 and can be stated in equal (linear) or unequal (nonlinear) increments.
Table 6.2 shows a typical risk impact scale for cost, time, and quality objectives based on a high-high to low-low scale. You’ll notice that each of the high-medium-low value combinations on this impact scale has been assigned a cardinal value. I’ll use these in the section coming up on the probability and impact matrix.
Objectives |
Low-Low |
Low |
Medium |
High |
High-High |
|
0.05 |
0.20 |
0.40 |
0.60 |
0.80 |
Cost |
No significant impact |
Less than 6% increase |
7–12% increase |
13–18% increase |
More than 18% increase |
Time |
No significant impact |
Less than 6% increase |
7–12% increase |
13–18% increase |
More than 18% increase |
Quality |
No significant impact |
Few components impacted |
Significant impact requiring customer approval to proceed |
Unacceptable quality |
Product not usable |
When you’re using a high-medium-low scale, it’s important that your risk team understands what criteria were used to determine a high score versus a medium or low score and how they should be applied to the project objectives.
Assessing Probability and Impact
The idea behind both probability and impact values is to develop predefined measurements that describe what value to place on a risk event.
If the risk impact scale has not been previously defined, develop one for the project as early in the Planning processes as possible. You can use any of the techniques I talked about earlier in the section “Tools and Techniques for Identify Risks,” such as brainstorming or the Delphi technique, to come up with the values for probability and impact.
During the Perform Qualitative Risk Analysis process, you’ll determine and assess probability and impact for every risk identified during the Identify Risks process. You could interview or hold meetings with project team members, subject matter experts, stakeholders, or others to help assess these factors. During this process, you should document not only the probability and impact but also the assumptions your team members used to arrive at these determinations. The next technique—probability and impact matrix—takes the probability and impact values one step further by assigning an overall risk score.
Probability and Impact Matrix
The outcome of a probability and impact matrix is an overall risk rating for each of the project’s identified risks. The combination of probability and impact results in a classification usually expressed as high, medium, or low. Typically, high risks are considered a red condition, medium risks are considered a yellow condition, and low risks are considered a green condition. This type of ranking is known as an ordinal scale because the values are ordered by rank from high to low. (In practice, ordinal values might also include ranking by position. In other words, the risks are listed in order by rank as the first, the second, the third, and so on.)
Now let’s look at an example. You have identified a risk event that could impact project costs, and your experts believe costs could increase by as much as 9 percent. According to the risk impact rating matrix in Table 6.2, this risk carries a medium impact, with a value of 0.40. Hold on to that number because you’re going to plug it into the probability impact matrix—along with the probability value—to determine an overall risk value next.
You’ll remember from the discussion previously that probability values should be assigned numbers from 0.0 to 1.0. In this example, the team has determined that there is a 0.2 probability of this risk event occurring. The risk impact scale shows a medium, or 0.40, impact should the event occur.
Now, to determine whether the combination of the probability and impact of this risk is high, medium, or low, you’ll need to check the probability impact matrix. Table 6.3 shows a sample probability and impact matrix.
TABLE 6.3 Sample probability and impact matrix
Probability |
Impact Values* Low-Low .05 |
Low .20 |
Medium .40 |
High .60 |
High-High .80 |
0.8 |
.04 |
.16 |
.32 |
.48 |
.64 |
0.6 |
.03 |
.12 |
.24 |
.36 |
.48 |
0.4 |
.02 |
.08 |
.16 |
.24 |
.32 |
0.2 |
.01 |
.04 |
.08 |
.12 |
.16 |
*No formatting = low assignment or green condition; bold = medium assignment or yellow condition; bold italic = high assignment or red condition.
First, look at the probability column. Your risk event has a probability of .2. Now, follow that row across until you find the column that shows the impact score of .40 (it’s the Medium column). According to your probability and impact matrix values, this risk carries an overall score of .08 and falls in the low threshold, so this risk is assigned a low (or green condition) value.
The values assigned to the risks determine how Plan Risk Responses is carried out for the risks later during the risk-planning processes. Obviously, risks with high probability and high impact are going to need further analysis and formal responses. Remember that the values for this matrix (and the probability and impact scales discussed earlier) are determined prior to the start of this process and documented in the risk management plan. Also keep in mind that probability and impact do not have to be assigned the same values I’ve assigned here. You might use 0.8, 0.6, 0.4, and 0.2 for probability, for example, and assign .05, 0.1, .3, 0.5, and 0.7 for impact scales.
![]() Real World Scenario
Real World Scenario
Screen Scrapers is a software-manufacturing company that produces a software product that looks at your mainframe screens, commonly called green screens, and converts them to browser-based screens. The browser-based screens look like any other Windows-compatible screens with buttons, scroll bars, and drop-down lists.
Screen Scrapers devised this product for companies that use mainframe programs to update and store data because many of the entry-level workers beginning their careers today are not familiar with green screens. They’re cumbersome and difficult to learn, and no consistency exists from screen to screen or from program to program. Pressing the F5 key in one program might mean go back one page, whereas pressing F5 in another program might mean clear the screen. New users are easily confused, make a lot of mistakes, and have to write tablets full of notes on how to navigate all the screens.
Your company has purchased the Screen Scraper product and has appointed you as the project manager over the installation. This project consists of a lot of issues to address, and you’ve made great headway. You’re now at the Identify Risks and Perform Qualitative Risk Analysis stage. You decide to use the Delphi technique to assist you in identifying risk and assigning probability and impact rankings. Some experts are available in your company to serve on the Delphi panel, as well as some folks in industry organizations you belong to outside the company.
You assemble the group, set up a summary of the project, and send it out via email, requesting responses to your questions about risk. After the first pass, you compile the list of risks as follows (this list is an example and isn’t exhaustive because your list will be project specific):
Vendor viability (will the software company stay in business?)
Vendor responsiveness with problems after implementation
Software compatibility risks with existing systems
Hardware compatibility risk
Connection to the mainframe risk
Training IT staff members to maintain the product
You send this list back to the Delphi members and ask them to assign a probability of 0.0 to 1.0 and an impact of high-high, high, medium, low, or low-low to each risk. The Delphi members assign probability and impact based on a probability scale and an impact scale designed by the risk management team. The values of the impact scale are as follows:
High-high = 0.8
High = 0.6
Medium = 0.4
Low = 0.2
Low-low = 0.05
The results are compiled to determine the following probability and impact values:
Vendor viability = 0.6 probability, high impact
Vendor responsiveness = 0.4 probability, medium impact
Software compatibility = 0.4 probability, medium impact
Hardware compatibility = 0.6 probability, high-high impact
Mainframe connection = 0.2 probability, high-high impact
Training = 0.2 probability, low-low impact
The probability and impact matrix you used to assign the overall risk scores was derived from the probability and impact matrix shown in the following table.
Based on the probability and impact matrix thresholds, the project risks are assigned the following overall probabilities:
Vendor viability = high
Vendor responsiveness = medium
Software compatibility = medium
Hardware compatibility = high
Mainframe connection = medium
Training = low
PI Matrix for Screen Scrapers, Inc.
Probability |
Impact Scores*.05 |
.20 |
.40 |
.60 |
.80 |
.8 |
.04 |
.16 |
.32 |
.48 |
.64 |
.6 |
.03 |
.12 |
.24 |
.36 |
.48 |
.4 |
.02 |
.08 |
.16 |
.24 |
.32 |
.2 |
.01 |
.04 |
.08 |
.12 |
.16 |
*No formatting = low assignment or green condition; bold = medium assignment or yellow condition; bold italic = high assignment or red condition.
Risk Data Quality Assessment
The risk data quality assessment involves determining the usefulness of the data gathered to evaluate risk. Most important, the data must be unbiased and accurate. You will want to examine elements such as the following when using this tool and technique:
The quality of the data used
The availability of data regarding the risks
How well the risk is understood
The reliability and integrity of the data
The accuracy of the data
Low-quality data will render the results from the Perform Qualitative Risk Analysis process almost useless. Spend the time to validate and verify the information you’ve collected about risks so that your prioritization and analysis is as accurate as it can be. If you find that the quality of the data is questionable, you guessed it—go back and get better data.
Risk Categorizations
This tool and technique is used to determine the effects risk has on the project. You can examine not only the categories of risk determined during the Plan Risk Management process (and described in the RBS) but also the project phase and the WBS to determine the elements of the project that are affected by risk.
Risk Urgency Assessment
Using this tool you’ll determine how soon the potential risk events might occur and quickly determine responses for those risk events that could occur soon. You should consider the risk triggers, the time to develop and implement a response, and the overall risk rating when deciding how quickly responses are needed.
Expert Judgment
Because this process determines qualitative values, by its very nature you must rely on expert judgment to determine the probability, impact, and other information we’ve derived so far. The more knowledge and similar experience your experts have, the better your assessments will be. Interviews and facilitated workshops are two techniques you can use in conjunction with expert judgment to perform this process. As with the Identify Risks process, make certain to take into account any bias your experts have and to correct it when necessary.
Ranking Risks in the Risk Register
The goal of the Perform Qualitative Risk Analysis process is to rank the risks and determine which ones need further analysis and, eventually, risk response plans. The output of this process is project documents updates. This almost always involves updating the risk register. According to the PMBOK® Guide, you’ll update the risk register with the following information:
Risk ranking (or priority) for the identified risks
Risk scores
Updated probability and impact analysis
Risk urgency information
Causes of risk
List of risks requiring near-term responses
List of risks that need additional analysis and response
Watch list of low-priority risks
Trends in qualitative risk analysis results
Each element becomes a new entry in the risk register. For example, risk ranking assigns the risk score or priority you determined using the probability and impact matrix to the list of identified risks previously recorded in the risk register. I discussed the categories and the list of risks requiring near-term responses earlier. Note these in the risk register.
You should also note those risks that require further analysis (including using the Perform Quantitative Risk Analysis process), you’ll create a list of risks that have low risk scores to review periodically, and you should note any trends in Perform Qualitative Risk Analysis that become evident as you perform this process.
The assumptions log is another project document that should be updated as new information is discovered throughout this process. Assumptions are generally documented in the project scope statement or can be kept in a separate document so that they are easier to update. Assumptions can and do change throughout the course of the project, and the process of identifying and prioritizing risks may require updates to the assumptions.
Quantifying Risk
The Perform Quantitative Risk Analysis process evaluates the impacts of risk prioritized during the Perform Qualitative Risk Analysis process. It is typically performed for risks identified in Perform Qualitative Risk Analysis that could have a significant impact on the project. Perform Quantitative Risk Analysis quantifies the aggregate risk exposure for the project by assigning numeric probabilities to risks and their impacts on project objectives. This quantitative approach is accomplished using techniques such as Monte Carlo simulation and decision tree analysis. To paraphrase the PMBOK® Guide, the purpose of this process is to perform the following:
Quantify the project’s possible outcomes and probabilities.
Determine the probability of achieving the project objectives.
Identify risks that need the most attention by quantifying their contribution to overall project risk.
Identify realistic and achievable schedule, cost, or scope targets.
Determine the best project management decisions possible when outcomes are uncertain.
Perform Quantitative Risk Analysis—like Perform Qualitative Risk Analysis—examines risk and its potential impact on the project objectives. You might choose to use both of these processes to assess all risks or only one of them, depending on the complexity of the project and the organizational policy regarding risk planning. The Perform Quantitative Risk Analysis process follows the Perform Qualitative Risk Analysis process. If you use this process, be sure to repeat it every time the Plan Risk Responses process is performed and as part of the Control Risks process so that you can determine whether overall project risk has decreased.
I’ve already covered many of the inputs to the Perform Quantitative Risk Analysis process in previous sections of this chapter. They are as follows:
Risk management plan
Cost management plan
Schedule management plan
Risk register
Environmental enterprise factors
Organizational process assets
The elements of the enterprise environmental factors you’ll want to pay close attention to as an input to this process are risk databases and risk specialists’ studies performed on similar projects. The elements of the organizational process assets input include historical information from previous projects of a similar nature.
Tools and Techniques for Perform Quantitative Risk Analysis
The Perform Quantitative Risk Analysis process includes three tools and techniques: data-gathering and representation techniques, quantitative risk analysis and modeling techniques, and expert judgment.
Data-Gathering and Representation Techniques
The data-gathering and representation techniques include interviewing techniques and probability distributions.
Interviewing
This technique is like the interviewing technique discussed earlier when I talked about the Identify Risks process. Project team members, stakeholders, and subject-matter experts are prime candidates for risk interviews. Ask them about their experiences on past projects and about working with the types of technology or processes you’ll use during this project.
NOTE
For the exam, remember that interviewing is a tool and technique of the Perform Quantitative Risk Analysis process. Although you can use this technique in the Identify Risks process, keep in mind that it’s part of the data-gathering and representation techniques and not a named tool and technique itself.
When using this technique, you should first determine what methods of probability distribution (described next) you’ll use to analyze your information. The technique you choose will dictate the type of information you need to gather. For example, you might use a three-point scale that assesses the low, high, and most likely risk scenarios or take it a step further and use standard deviations calculations.
Make certain you document how the interviewees decided on the risk ranges, the criteria they used to place risks in certain categories, and the results of the interview. This information will help you later in developing risk responses.
Probability Distributions
It’s beyond the scope of this book to delve into probability distributions and calculations, so I’ll point out a few aspects of them that you should remember for the exam.
Continuous probability distributions (particularly beta and triangular distributions) are commonly used in Perform Quantitative Risk Analysis. According to the PMBOK® Guide, continuous probability distributions include normal, lognormal, triangular, beta, and uniform distributions. Distributions are graphically displayed and represent both the probability and time or cost elements.
Triangular distributions use estimates based on the three-point estimate (the pessimistic, most likely, and optimistic values). This means that during your interviews, you’ll gather these pieces of information from your experts. Then you’ll use them to quantify risk for each WBS element.
Normal and lognormal distributions use mean and standard deviations to quantify risk, which also require gathering the optimistic, most likely, and pessimistic estimates.
Discrete distributions represent possible scenarios in a decision tree (we’ll discuss this in a bit), outcomes of a test, results of a prototype, and other uncertain events.
Quantitative Risk Analysis and Modeling Techniques
For the exam, you should know the four analysis and modeling techniques within the Quantitative Risk Analysis tool and technique: sensitivity analysis, expected monetary value analysis, decision tree analysis, and modeling and simulation. Let’s take a brief look at each of them.
Sensitivity Analysis
Sensitivity analysis is a quantitative method of analyzing the potential impact of risk events on the project and determining which risk event (or events) has the greatest potential for impact by examining all the uncertain elements at their baseline values. One of the ways sensitivity analysis data is displayed is a tornado diagram. Figure 6.5 shows a sample tornado diagram.
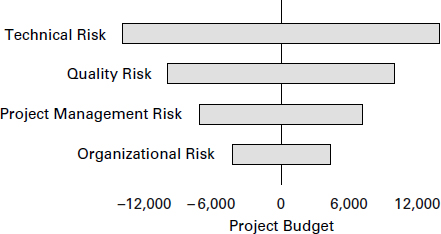
You can see by the arrangement of horizontal bars (each representing a sensitivity variable) how the diagram gets its name. The idea is that each sensitivity bar displays the low and high value possible for the element the bar represents. It’s beyond the scope of this book to explain how these values are determined. The questions you might encounter on the exam are focused on the context of this type of analysis. The variables with the greatest effect on the project appear at the top of the graph and decrease in impact as you progress down through the graph. This gives you a quick overview of how much the project can be affected by uncertainty in the various elements. It also allows you to see at a glance which risks might have the biggest impacts on the project and will require carefully crafted, detailed response plans. You can use tornado diagrams to determine sensitivity in cost, time, and quality objectives or for risks you’ve identified during this process. Sensitivity analysis can also be used to determine stakeholder risk tolerance levels.
Expected Monetary Value (EMV) Analysis
Expected monetary value (EMV) analysis is a statistical technique that calculates the average, anticipated future impact of the decision. EMV is calculated by multiplying the probability of the risk by its impact for two or more potential outcomes (for example, a good outcome and a poor outcome) and then adding the results of the potential outcomes together. EMV is used in conjunction with the decision tree analysis technique, which is covered next. I’ll give you an example of the EMV formula in the next section. Positive results generally mean the risks you’re assessing pose opportunities to the project, whereas negative results generally indicate a threat to the project.
Decision Tree Analysis
Unfortunately, this isn’t a tree outside your office door that produces “yes” and “no” leaves that you can pick to help you make a decision. Decision trees are diagrams that show the sequence of interrelated decisions and the expected results of choosing one alternative over the other. Typically, more than one choice or option is available when you’re faced with a decision or, in this case, potential outcomes from a risk event. The available choices are depicted in tree form starting at the left with the risk decision branching out to the right with possible outcomes. Decision trees are usually used for risk events associated with time or cost.
Figure 6.6 shows a sample decision tree using expected monetary value (EMV) as one of its inputs.
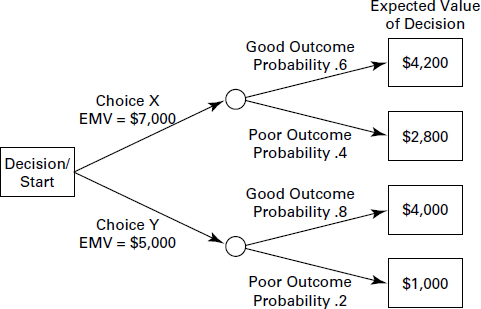
The expected monetary value of the decision is a result of the probability of the risk event multiplied by the impact for two or more potential outcomes and then summing their results. The squares in this figure represent decisions to be made, and the circles represent the points where risk events might occur.
The decision with an expected value of $7,000 is the correct decision to make because the resulting outcome has the greatest value.
Modeling and Simulation
Modeling and simulation techniques are often used for schedule risk analysis and cost analysis. For example, modeling allows you to translate the potential risks at specific points in the project into their impacts so you can determine how the project objectives are affected. Simulation techniques compute the project model using various inputs, such as cost estimates or activity durations, to determine a probability distribution for the variable chosen. (Cost risks typically use either a work breakdown structure or a cost breakdown structure as the input variable. Schedule risks always use the schedule network diagram and duration estimates as the input variable.) If you used simulation techniques to determine project cost and use the cost of the project elements as the input variable, a probability distribution for the total cost of the project would be produced after running the simulation numerous times. Modeling and simulation techniques examine the identified risks and their potential impacts on the project objectives from the perspective of the whole project.
Monte Carlo analysis is an example of a simulation technique. Monte Carlo analysis is replicated many times, typically using cost or schedule variables. Every time the analysis is performed, the values for the variable are changed using a probability distribution for each variable. Monte Carlo analysis can also be used during the Develop Schedule process.
Expert Judgment
I’ve talked about this tool and technique before. Experts can come from inside or outside the organization and should have experience that’s applicable to your project. For example, if your project involves manufacturing a new product or part, you might want to consider experts such as engineers or statisticians. If you’re dealing with sensitive data in an information technology project, consider bringing in a security expert. When evaluating risk, use experts who understand the tools associated with analyzing risk, including the benefits and drawbacks of the tools or methods you’ll use.
Perform Quantitative Risk Analysis Outputs
The output of the Perform Quantitative Risk Analysis process is—I’ll bet you can guess—project documents updates. As with the Perform Qualitative Risk Analysis process, you’ll record the following new elements in the risk register:
Probabilistic Analysis of the Project Probabilistic analysis of the project is the forecasted results of the project schedule and costs as determined by the outcomes of risk analysis. These results include projected completion dates and costs, along with a confidence level associated with each. According to the PMBOK® Guide, this output is often expressed as a cumulative frequency distribution, and you’ll use these results along with stakeholder risk tolerances to quantify the time and cost contingency reserves. (I’ll talk about contingency reserves in the next section, “Developing a Risk Response Plan.”)
Confidence levels can also be used to describe the level of confidence placed on the outcome of the forecasted results. For example, suppose the projected schedule completion date is July 12 and the confidence level is .85. This says you believe the project will finish on or before July 12 and that you have an 85 percent level of confidence that this date is accurate.
Probability of Achieving the Cost and Time Objectives Using the tools and techniques of Perform Quantitative Risk Analysis allows you to assign a probability of achieving the cost and time objectives of the project. This output documents those probabilities and as such requires a thorough understanding of the current project objectives and knowledge of the risks.
Prioritized List of Quantified Risks The prioritized list in this process is similar to the list produced during the Perform Qualitative Risk Analysis process. The list of risks includes those that present the greatest risk or threat to the project and their impacts. It also lists those risks that present the greatest opportunities to the project. This list should also indicate which risks are most likely to impact the critical path and those that have the largest cost contingency.
Trends in Perform Quantitative Risk Analysis Results Trends in Perform Quantitative Risk Analysis will likely appear as you repeat the risk analysis processes. This information is useful as you progress, making those risks with the greatest threat to the project more evident, which gives you the opportunity to perform further analysis or go on to develop risk response plans.
Developing a Risk Response Plan
The Plan Risk Responses process is the last process covered in this chapter. (I hear you cheering out there!) Plan Risk Responses is a process of deciding what actions to take to reduce threats and take advantage of the opportunities discovered during the risk analysis processes. This process also includes assigning departments or individual staff members the responsibility of carrying out the risk response plans you’ll outline in this process. These folks are known as risk owners.
NOTE
The more effective your risk response plans are, the better your chances for a successful project. Well-developed and well-written risk response plans will likely decrease overall project risk.
Generally, you’ll want to develop risk response plans for risks with a combination of high probability of occurrence and significant impact to the project, those ranked high (or red) on the probability/impact matrix, or those ranked high as a result of Perform Quantitative Risk Analysis. Developing risk response plans for risks of low severity or insignificant impact is not an efficient or good use of the project team’s time. Spend your time planning responses that are appropriate given the impact the risk itself poses (or the opportunity the risk presents), and don’t spend more time, money, or energy to produce a response than the risk event itself would produce if it occurred.
The inputs you’ll use to assist you in this process are the risk register and the risk management plan. Several strategies are used in this process to reduce or control risk. It’s important that you choose the right strategy for each risk so that the risk and its impacts are dealt with effectively. After deciding on which strategy to use, you’ll develop an action plan to put this strategy into play should the risk event occur. You might also choose to designate a secondary or backup strategy.
Tools and Techniques for Plan Risk Responses
The Plan Risk Responses process consists of four tools and techniques, and each one of them involves a strategy. The tools and techniques are as follows:
Strategies for negative risks or threats
Strategies for positive risks or opportunities
Contingent response strategies
Expert judgment
You’ll take a look at the first three next.
Strategies for Negative Risks or Threats
Four strategies exist to deal with negative risks or threats to the project objectives: avoid, transfer, mitigate, and accept. Accept is a strategy you can use for positive risks or opportunities also.
Avoid
To avoid a risk means you’ll evade it altogether by eliminating the cause of the risk event or by changing the project management plan to protect the project objectives from the risk event. Let’s say you’re going to take a car trip from your home to a point 800 miles away. You know—because your friends who just took the same trip told you—that there is a long stretch of construction on one of the highways you’re planning on using. To avoid the risk of delay, you plan the trip around the construction work and use another highway for that stretch of driving. In this way, you change your plans, avoid the risk of getting held up in construction traffic, and arrive at your destination on time.
With risk avoidance, you essentially eradicate the risk by eliminating its cause. Here’s another example: Suppose your project was kicked off without adequate scope definition and requirements gathering. You run a high probability of experiencing scope creep—ever-changing requirements—as the project progresses, thereby impacting the project schedule. You can avoid this risk by adequately documenting the project scope and requirements during the Planning processes and taking steps to monitor and control changes to scope so it doesn’t get out of hand.
Risks that occur early in the project might easily be avoided by improving communications, refining requirements, assigning additional resources to project activities, refining the project scope to avoid risk events, and so on.
Transfer
The idea behind a risk transfer is to transfer the risk and the consequences of that risk to a third party. The risk hasn’t gone away, but the responsibility for the management of that risk now rests with another party. Most companies aren’t willing to take on someone else’s risk without a little cash thrown in for good measure. This strategy will impact the project budget and should be included in the cost estimate exercises if you know you’re going to use it.
Transfer of risk can occur in many forms but is most effective when dealing with financial risks. Insurance is one form of risk transfer. You are probably familiar with how insurance works. Car insurance is a good example. You purchase car insurance so that if you come upon an obstacle in the road and there is no way to avoid hitting it, the cost to repair the damage to the car is paid by the insurance company ... okay, minus the deductible and all the calculations for the age of the car, the mileage, the color and make of the car, the weather conditions the day you were driving—but I digress.
Another method of risk transfer is contracting. Contracting transfers specific risks to the vendor, depending on the work required by the contract. The vendor accepts the responsibility for the cost of failure. Again, this doesn’t come without a price. Contractors charge for their services, and depending on the type of contract you negotiate, the cost might be quite high. For example, in a fixed-price contract, which I’ll talk more about in Chapter 7, the vendor (or seller) increases the cost of the contract to compensate for the level of risk they’re accepting. A cost reimbursable contract, however, leaves the majority of the risk with you, the buyer. This type of contract might reduce costs if project changes occur midway through the project.
Keep in mind that contracting isn’t a cure-all. You might just be swapping one risk for another. For example, say you hire a driver to go with you on your road trip, and that person’s job is to do all the driving. If the driver becomes ill or in some way can’t fulfill their obligation, you aren’t going to get to your destination on time. You’ve placed the risks associated with the trip on the contract driver; however, you’ve taken on a risk of delay because of nonperformance, which means you’ve just swapped one risk for another. You’ll have to weigh your options in cases like this and determine which side of the risk coin your organization can more readily accept.
Other forms of transference include warranties, guarantees, and performance bonds.
Mitigate
When you mitigate a risk, you attempt to reduce the probability of a risk event occurring or reduce its impacts to an acceptable level. This strategy is a lot like defensive driving. You see an obstacle in the road ahead, survey your options, and take the necessary steps to avoid the obstacle and proceed safely on your journey. Seeing the obstacle ahead (identifying risk) allows you to reduce the threat by planning ways around it or planning ways to reduce its impact if the risk does occur (mitigation strategies).
According to the PMBOK® Guide, the purpose of mitigation is to reduce the probability that a risk will occur and/or reduce the impact of the risk to a level where you can accept the risk and its outcomes. It’s easier to take actions early on that will reduce the probability of a risk event or its consequences than it is to fix the damage once it has occurred. Some examples of risk mitigation include performing more tests, using less complicated processes, creating prototypes, and choosing more reliable vendors.
Accept
The acceptance strategy is used when you aren’t able to eliminate all the threats on the project. Acceptance of a risk event is a strategy that can be used for risks that pose either threats or opportunities to the project. There are two alternatives to the acceptance strategy. Passive acceptance means you won’t make any plans to try to avoid or mitigate the risk. You’re willing to accept the consequences of the risk should it occur. This strategy is often used when it’s more cost-effective to accept the impacts of the risk than to spend time or resources developing plans to deal with the consequences. Passive acceptance might also be used because the project team was unable to come up with an adequate response strategy and must accept the risk and its consequences. Active acceptance is the second strategy and might include developing contingency plans and reserves to deal with risks should they occur. (You’ll look at contingency reserves in the Contingency Planning section.)
Let’s revisit the road trip example. You could plan the trip using the original route and just accept the risk of running into construction. If you get to that point and you’re delayed, you’ll just accept it. This is passive acceptance. You could also go ahead and make plans to take an alternative route but not enact those plans until you actually reach the construction and know for certain that it is going to impede your progress. This is active acceptance and might involve developing a contingency plan.
![]() Real World Scenario
Real World Scenario
You work for a small hotel and resort in western Colorado. Your company has taken on a project to expand the convention center by adding another wing. This wing will add six more meeting rooms (four of which can be combined into a large room by folding back the movable walls to accommodate large groups). This is a popular resort, and one of the risks identified with this project was an increase in demand for conference reservations after the construction finishes. The marketing team members decide they’ll mitigate this risk by contacting the organizations who’ve consistently reserved space with them over the past three years and offer them incentives on their next reservation if they book their convention before the construction is completed. That way, their most important customers won’t be turned away when the new reservations start pouring in.
Strategies for Positive Risk or Opportunities
Four strategies exist to deal with opportunities or positive risks that might present themselves on the project: exploit, share, enhance, and accept. We already covered accept, so we’ll look at the remaining strategies next.
Exploit
When you exploit a risk event, you’re looking for opportunities for positive impacts. This is the strategy of choice when you’ve identified positive risks that you want to make certain will occur on the project. Examples of exploiting a risk include reducing the amount of time to complete the project by bringing on more qualified resources or by providing even better quality than originally planned.
Share
The share strategy is similar to transferring because you’ll assign the risk to a third- party owner who is best able to bring about the opportunity the risk event presents. For example, perhaps what your organization does best is investing. However, it isn’t so good at marketing. Forming a joint venture with a marketing firm to capitalize on a positive risk will make the most of the opportunities.
Enhance
The enhance strategy closely watches the probability or impact of the risk event to assure that the organization realizes the benefits. The primary point of this strategy is to attempt to increase the probability and/or impact of positive risks. This entails watching for and emphasizing risk triggers and identifying the root causes of the risk to help enhance impacts or probability.
Contingency Planning
The last tool and technique of the Plan Risk Responses process we’ll address is called the contingent response strategy, better known as contingency planning. Contingency planning involves planning alternatives to deal with certain risks (such as those with accept strategies) should they occur. This is different from mitigation planning in that mitigation looks to reduce the probability of the risk and its impact, whereas contingency planning doesn’t necessarily attempt to reduce the probability of a risk event or its impacts.
Contingency comes into play when the risk event occurs. This implies you need to plan for your contingencies well in advance of the threat or opportunity occurring. After the risks have been identified and quantified, contingency plans should be developed and kept at the ready.
Contingency reserves are a common contingency response. We talked about this topic in the last chapter as well. Contingency reserve strategies for risk events are similar to those for cost and activity durations. This may include setting aside funding or resources or adding contingency time to the project schedule.
Fallback plans should be developed for risks with high impact or for risks with identified strategies that might not be the most effective at dealing with the risk. Fallback plans are not contingency plans. For example, in the information technology field, we often have high-impact risks associated with upgrading operating systems or implementing new applications. A contingency plan may include calling the vendor to assist in the middle of the night (that’s always when things fall apart) when we can’t figure out a solution. A fallback plan in this case may describe how we are going to bring the old system back online so users can still do their work while we figure out what went wrong with the implementation.
In practice, you’ll find that identifying, prioritizing, quantifying, and developing responses for potential threats might happen simultaneously. In any case, you don’t want to be taken by surprise, and that’s the point of the risk processes. If you know about potential risks early, you can often mitigate them or prepare appropriate response plans or contingency plans to deal with them.
Plan Risk Responses Outputs
As you’ve no doubt concluded, the purpose of the Plan Risk Responses process is to develop risk responses for those risks with the highest threat to or best opportunity for the project objectives. The Plan Risk Responses process has two outputs: project management plan updates and project documents updates.
NOTE
Remember that you might need to revisit other Planning processes after performing Plan Risk Responses to modify project plans as a result of risk responses.
Project Management Plan Updates
As we’ve discussed throughout the book, the management plans created to document how the schedule, budget, quality, procurement, and human resources will be defined, managed, and controlled on the project become subsidiary plans to the project management plan. Any and all of these management plans may require updates after you perform the risk processes. In addition, the WBS, the scope baseline, the schedule baseline, and cost baseline may require updates as well.
Other project documents, such as technical documentation and the assumptions documented in the project scope statement, could need an update after performing these processes as well.
Project Documents Updates
For this output, you may need to update project documents, including the risk register, technical documents, the assumptions log, and change requests. The risk register is updated at the end of this process with the information you’ve discovered during this process. The response plans are recorded in the risk register. You’ll recall that the risk register lists the risks in order of priority (those with the highest potential for threat or opportunity first), so it makes sense that the response plans you have for these risks will be more detailed than the remaining lists. Some risks might not require response plans at all, but you should put them on a watch list and monitor them throughout the project.
Let’s take a look at what the risk register should contain at this point. According to the PMBOK® Guide, after Identify Risks, Perform Qualitative Risk Analysis, and Perform Quantitative Risk Analysis are performed, the following elements should appear in the risk register:
Prioritized list of identified risks, including their descriptions, what WBS element (or area of the project) they impact, categories (RBS), root causes, and how the risk impacts the project objectives
Risk ranking
Risk owners and their responsibility
Agreed-upon response strategies
Actions needed to implement response plans
Cost and schedule activities needed to implement risk responses
Contingency plans
Fallback plans
List of residual and secondary risks
Contingency reserves
The only elements in the preceding list I haven’t talked about so far are residual and secondary risks. A residual risk is a leftover risk, so to speak. After you’ve implemented a risk response strategy—mitigation, for example—some minor risk might still remain. The contingency reserve is set up to handle situations like this.
Secondary risks are risks that come about as a result of implementing a risk response. The example given previously where you transferred risk by hiring a driver to take you to your destination but the person became ill along the way is an example of a secondary risk. The driver’s illness delayed your arrival time, which is a risk directly caused by hiring the driver or implementing a risk response. When planning for risk, identify and plan responses for secondary risks.
Risks exist on all projects, and risk planning is an important part of the project Planning processes. Just the act of identifying risks and planning responses can decrease their impact if they occur. Don’t take the “What I don’t know won’t hurt me” approach to risk planning. This is definitely a case where not knowing something can be devastating. Risks that are easily identified and have planned responses aren’t likely to kill projects or your career. Risks that you should have known about but ignored could end up costing the organization thousands or millions of dollars, causing schedule delays, causing loss of competitive advantage, or ultimately killing the project. There could be a personal cost as well, because cost and schedule overruns due to poor planning on your part are not easily explained.
![]() Real World Scenario
Real World Scenario
Ricardo knocks on your office door and asks whether you have a few minutes to talk. “Of course,” you reply, and he takes a seat on one of the comfy chairs at the conference table. You have a feeling this might take a while.
“I think you should know that I’m concerned about the availability of the T1 line. I’ve already put in the call to get us on the list because, as I said last week, there’s a 30- to 45- day lead time on these orders.”
“We’re only partway through the Planning processes. Do you need to order the T1 so soon? We don’t even know the store location yet,” you say.
“Even though they say lead time is 30 to 45 days, I’ve waited as long as five or six months to get a T1 installed in the past. I know we’re really pushing for the early February store opening, so I thought I’d get the ball rolling now. What I need from you is the location address, and I’ll need that pretty quick.”
“We’re narrowing down the choices between a couple of properties, so I should have that for you within the next couple of weeks. Is that soon enough?”
“The sooner, the better,” Ricardo replies.
“Great. I’m glad you stopped by, Ricardo. I wanted to talk with you about risk anyway, and you led us right into the discussion. Let me ask you, what probability would you assign to the T1 line installation happening six months from now?”
“I’d say the probability for six months is low. It’s more likely that if there is a delay, it would be within a three- to four-month time frame.”
“If they didn’t get to it for six months, would it be a showstopper? In other words, is there some other way we could transfer Jill’s data until the T1 did get installed?”
“Sure, we could use other methods. Jill won’t want to do that for very long, but workarounds are available.”
“Good. Now, what about the risk for contractor availability and hardware availability and delivery schedules?” you ask.
You and Ricardo go on to discuss the risks associated with the IT tasks. Later, you ask Jill and Jake the same kinds of questions and compile a list of risks. In addition, you review the project information for the Atlanta store opening because it’s similar in size and scope to this store. You add the risks from that store opening to your list as well. You divide some of the risks into the following categories: IT, Facilities, and Retail. A sample portion of your list appears as follows, with overall assignments made based on Perform Qualitative Risk Analysis and the probability and impact matrix:
Category: IT
T1 line availability and installation. Risk score: Low
Contractor availability for Ethernet installation. Risk score: Medium
POS and server hardware availability. Risk score: Medium
Category: Facilities
Desirable location in the right price range. Risk score: High
Contractor availability for build-out. Risk score: Low
Availability of fixtures and shelving. Risk score: Low
Category: Retail
Product availability. Risk score: Medium
Shipment dates for product. Risk score: Medium
After examining the risks, you decide that response plans should be developed for the last two items listed under the IT source, the first item under Facilities, and both of the risks listed under Retail.
Ricardo has already mitigated the T1 connection and installation risk by signing up several months ahead of the date when the installation is needed. The contractor availability can be handled with a contingency plan that specifies a backup contractor should the first choice not be available. For the POS terminals and hardware, you decide to use the transfer strategy. As part of the contract, you’ll require these vendors to deliver on time, and if they cannot, they’ll be required to provide and pay for rental equipment until they can get your gear delivered.
The Facilities risk and Retail risks will be handled with a combination of acceptance, contingency plans, and mitigation.
You’ve calculated the expected monetary value for several potential risk events. Two of them are detailed here.
Desirable location has an expected monetary value of $780,000. The probability of choosing an incorrect or less than desirable location is 60 percent. The potential loss in sales is the difference between $2.5 million in sales per year that a high-producing store generates versus $1.2 million in sales per year that an average store generates.
The expected monetary value of the product availability event is $50,000. The probability of the event occurring is 40 percent. The potential loss in sales is $125,000 for not opening the store in conjunction with the Home and Garden Show.
Project Case Study Checklist
Plan Risk Management
Identify Risks
Documentation reviews
Information-gathering techniques
Perform Qualitative Risk Analysis
Risk probability and impact
Probability and impact rating
List of prioritized risks
Perform Quantitative Risk Analysis
Interviewing
Expected monetary value
Plan Risk Responses
Avoidance, transference, mitigation, and acceptance strategies
Risk response plans documented
Understanding How This Applies to Your Next Project
Risk management, and all the processes it involves, is not a process I recommend you skip on a project of any size. This is where the Boy Scouts of America motto, “Be Prepared,” is wise advice. If you haven’t examined what could be lurking around the corner on your project and come up with a plan to deal with it, then you can be assured you’re in for some surprises. Then again, if you like living on the edge, never knowing what might occur next, you’ll probably find yourself back on the job-hunting scene sooner than you planned (oh, wait, you didn’t plan because you’re living on the edge).
In all seriousness, as with most of the Planning processes I’ve discussed so far, risk management should be scaled to match the complexity and size of your project. If you’re working on a small project with a handful of team members and a short timeline, it doesn’t make sense to spend a lot of time on risk planning. However, it does warrant spending some time identifying project risk, determining impact and probability, and documenting a plan to deal with the risk.
My favorite Identify Risks technique is brainstorming. I like its cousin the Nominal Group technique too. Both techniques help you quickly get to the risks with the greatest probability and impact because, more than likely, these are the first risks that come to mind. Identify Risks can also help the project team find alternative ways of completing the work of the project. Further digging and the ideas generated from initial identification might reveal opportunities or alternatives you wouldn’t have thought about during the regular Planning processes.
After you’ve identified the risks with the greatest impact to the project, document response plans that are appropriate for the risk. Small projects might have only one or two risks that need a response plan. The plans might consist of only a sentence or two, depending on the size of the project. I would question a project where no risks require a response plan. If it seems too good to be true, it probably is.
The avoid, transfer, and mitigate strategies are the most often used strategies to deal with risk, along with contingency planning. Of these, mitigation and contingency planning are probably the most common. Mitigation generally recognizes that the risk will likely occur and attempts to reduce the impact.
I have used brainstorming and the Nominal Group technique to strategize response plans for risks on small projects. When you’re working on a small project, you can typically identify, quantify, and create response plans for risks at one meeting.
Identifying positive risk, in my experience, is fairly rare. Typically, when my teams perform Identify Risks, it’s to determine what can go wrong and how bad the impact will be if it does. The most important concept from this chapter that you should apply to your next project is that you and your team should identify risks and create response plans to deal with the most significant ones.
Summary
Congratulations! You’ve completed another fun-filled, action-packed chapter, and all of it on a single topic—risk. Risk is inherent in all projects, and risks pose both threats to and opportunities for the project. Understanding the risks facing the project better equips you to determine the appropriate strategies to deal with those risks and helps you develop the response plans for the risks (and the level of effort you should put into preparing those plans).
The Plan Risk Management process determines how you will plan for risks on your project. Its only output is the risk management plan, which details how you’ll define, monitor, and control risks throughout the project. The risk management plan is a subsidiary of the project management plan.
The Identify Risks process seeks to identify and document the project risks using information-gathering techniques such as brainstorming, the Delphi technique, interviewing, and root cause analysis. This list of risks gets recorded in the risk register, the only output of this process.
Perform Qualitative Risk Analysis and Perform Quantitative Risk Analysis involve evaluating risks and assigning probability and impact values to them. Many tools and techniques are used during these processes, including risk probability and impact assessment, probability and impact matrix, interviewing, probability distributions, expert judgment, sensitivity analysis, decision tree analysis, and simulation.
A probability and impact matrix uses the probability multiplied by the impact value to determine the risk score. The threshold of risk based on high, medium, and low tolerances is determined by comparing the risk score based on the probability level to the probability and impact matrix.
Monte Carlo simulation is a technique used to quantify schedule or cost risks. Decision trees graphically display decisions and their various choices and outcomes, and they are typically used in combination with expected monetary value.
The Plan Risk Responses process is the last Planning process and culminates with an update to the risk register documenting the risk response plans. The risk response plans detail the strategies you’ll use to respond to risk and assign individuals to manage each risk response. Risk response strategies for negative risks include avoidance, mitigation, and transference. Risk strategies for positive risks include exploit, share, and enhance. Acceptance is a strategy for both negative and positive risks.
Contingency planning involves planning alternatives to deal with risk events should they occur. Contingency reserves are set aside to deal with risks associated with cost and time according to the stakeholder tolerance levels.
Exam Essentials
Be able to define the purpose of the risk management plan. The risk management plan describes how you will define, monitor, and control risks throughout the project. It details how risk management processes (including Identify Risks, Perform Qualitative Risk Analysis, Perform Quantitative Risk Analysis, Plan Risk Responses, and Control Risks) will be implemented, monitored, and controlled throughout the life of the project. It describes how you will manage risks but does not attempt to define responses to individual risks. The risk management plan is a subsidiary of the project management plan, and it’s the only output of the Plan Risk Management process.
Be able to name the purpose of Identify Risks. The purpose of the Identify Risks process is to identify all risks that might impact the project and then document them and identify their characteristics.
Be able to define the purpose of Perform Qualitative Risk Analysis. Perform Qualitative Risk Analysis determines the impact the identified risks will have on the project and the probability they’ll occur, and it puts the risks in priority order according to their effects on the project objectives.
Be able to define the purpose of Perform Quantitative Risk Analysis. Perform Quantitative Risk Analysis evaluates the impacts of risk prioritized during the Perform Qualitative Risk Analysis process and quantifies risk exposure for the project by assigning numeric probabilities to each risk and their impacts on project objectives.
Be able to define the purpose of the Plan Risk Responses process. Plan Risk Responses is the process where risk response plans are developed using strategies such as avoid, transfer, mitigate, accept, exploit, share, enhance, develop contingent response strategies, and apply expert judgment. The risk response plan describes the actions to take should the identified risks occur. It should include all the identified risks, a description of the risks, how they’ll impact the project objectives, and the people assigned to manage the risk responses.
Be able to define the risk register and some of its primary elements. The risk register is an output of the Identify Risks process, and updates to the risk register occur as an output of every risk process that follows this one. By the end of the Plan Risk Responses process, the risk register contains these primary elements: identified list of risks, risk owners, risk triggers, risk strategies, contingency plans, and contingency reserves.
Review Questions
You can find the answers to the review questions in Appendix A.
1. You are a project manager for Fountain of Youth Spring Water bottlers. Your project involves installing a new accounting system, and you’re performing the risk-planning processes. You have identified several problems along with the causes of those problems. Which of the following diagrams will you use to show each problem and its causes and effects?
A. Decision tree diagram
B. Fishbone diagram
C. Benchmark diagram
D. Simulation tree diagram
2. Assessing the probability and consequences of identified risks to the project objectives, assigning a risk score to each risk, and creating a list of prioritized risks describe which of the following processes?
A. Perform Quantitative Risk Analysis
B. Identify Risks
C. Perform Qualitative Risk Analysis
D. Plan Risk Management
3. Each of the following statements is true regarding the risk management plan except for which one?
A. The risk management plan is an output of the Plan Risk Management process.
B. The risk management plan includes a description of the responses to risks and triggers.
C. The risk management plan includes thresholds, scoring and interpretation methods, responsible parties, and budgets.
D. The risk management plan is an input to all the remaining risk-planning processes.
4. You are using the interviewing technique of the Perform Quantitative Risk Analysis process. You intend to use normal and lognormal distributions. All of the following statements are true regarding this question except which one?
A. Interviewing techniques are used to quantify the probability and impact of the risks on project objectives.
B. Normal and lognormal distributions use mean and standard deviation to quantify risks.
C. Distributions graphically display the impacts of risk to the project objectives.
D. Triangular distributions rely on optimistic, pessimistic, and most likely estimates to quantify risks.
5. The information-gathering techniques used in the Identify Risks process include all of the following except _______________________.
A. root cause analysis
B. the Delphi technique
C. brainstorming
D. checklist analysis
6. Which of the following processes assesses the likelihood of risk occurrences and their consequences using a numerical rating?
A. Perform Qualitative Risk Analysis
B. Identify Risks
C. Perform Quantitative Risk Analysis
D. Plan Risk Responses
7. You are the project manager for a new website for the local zoo. You need to perform the Perform Qualitative Risk Analysis process. When you’ve completed this process, you’ll produce all of the following as part of the project documents updates output except which one?
A. Priority list of risks
B. Watch list of low-priority risks
C. Probability of achieving time and cost estimates
D. Risks grouped by categories
8. You’ve identified a risk event on your current project that could save $100,000 in project costs if it occurs. Which of the following is true based on this statement?
A. This is a risk event that should be accepted because the rewards outweigh the threat to the project.
B. This risk event is an opportunity to the project and should be exploited.
C. This risk event should be mitigated to take advantage of the savings.
D. This is a risk event that should be avoided to take full advantage of the potential savings.
9. You’ve identified a risk event on your current project that could save $500,000 in project costs if it occurs. Your organization is considering hiring a consulting firm to help establish proper project management techniques in order to assure it realizes these savings. Which of the following is true based on this statement?
A. This is a risk event that should be accepted because the rewards outweigh the threat to the project.
B. This risk event is an opportunity to the project and should be exploited.
C. This risk event should be mitigated to take advantage of the savings.
D. This is a risk event that should be shared to take full advantage of the potential savings.
10. Your hardware vendor left you a voicemail saying that a snowstorm in the Midwest might prevent your equipment from arriving on time. She wanted to give you a heads-up and asked that you return the call. Which of the following statements is true?
A. This is a trigger.
B. This is a contingency plan.
C. This is a residual risk.
D. This is a secondary risk.
11. You are constructing a probability and impact matrix for your project. Which of the following statements is true?
A. The probability and impact matrix multiplies the risk’s probability by the cost of the impact to determine an expected value of the risk event.
B. The probability and impact matrix multiplies the risk’s probability—which falls from 0.0 to 1.0—and the risk’s impact for each potential outcome and then adds the result of the potential outcomes together to determine a risk score.
C. The probability and impact matrix are predetermined thresholds that use the risk’s probability multiplied by the impact of the risk event to determine an overall risk score.
D. The probability and impact matrix multiplies the risk’s probability by the risk impact—which both fall from 0.0 to 1.0—to determine a risk score.
12. Your stakeholders have asked for an analysis of the cost risk. All of the following are true except for which one?
A. Monte Carlo analysis is the preferred method to use to determine the cost risk.
B. Monte Carlo analysis is a modeling technique that computes project costs one time.
C. A traditional work breakdown structure can be used as an input variable for the cost analysis.
D. Monte Carlo usually expresses its results as probability distributions of possible costs.
13. Your hardware vendor left you a voicemail saying that a snowstorm in the Midwest will prevent your equipment from arriving on time. You identified a risk response strategy for this risk and have arranged for a local company to lease you the needed equipment until yours arrives. This is an example of which risk response strategy?
A. Transfer
B. Acceptance
C. Mitigate
D. Avoid
14. Risk attitude is an enterprise environmental factor that you should evaluate when performing the Plan Risk Management process. Risk attitude consists of all of the following elements except for which one?
A. Risk appetite
B. Risk threshold
C. Risk urgency
D. Risk tolerance
15. You work for a large manufacturing plant. You are working on a new project to release an overseas product line. This is the company’s first experience in the overseas market, and it wants to make a big splash with the introduction of this product. The stakeholders are a bit nervous about the project and historically proceed cautiously and take a considerable amount of time to examine information before making a final decision. The project entails producing your product in a concentrated formula and packaging it in smaller containers than the US product uses. A new machine is needed to mix the ingredients into a concentrated formula. After speaking with one of your stakeholders, you discover this will be the first machine your organization has purchased from your new supplier. Which of the following statements is true given the information in this question?
A. The question describes risk tolerance levels of the stakeholders, which should be considered when performing the Plan Risk Management process.
B. This question describes the interviewing tool and technique used during the Identify Risks process.
C. This question describes risk triggers that are derived using interviewing techniques and recorded in the risk register during the Perform Qualitative Risk Analysis process.
D. This question describes a risk that requires a response strategy from the positive risk category.
16. Your project team has identified several potential risks on your current project that could have a significant impact if they occurred. The team examined the impact of the risks by keeping all the uncertain elements at their baseline values. What type of diagram will the team use to display this information?
A. Fishbone diagram
B. Tornado diagram
C. Influence diagram
D. Process flowchart
17. Your project team is in the process of identifying project risks on your current project. The team has the option to use all of the following tools and techniques to diagram some of these potential risks except for which one?
A. Ishikawa diagram
B. Decision tree diagram
C. Process flowchart
D. Influence diagram
18. All of the following statements are true regarding the RBS except for which one?
A. The RBS is contained in the risk management plan.
B. It describes risk categories, which are a systematic way to identify risks and provide a foundation for understanding for everyone involved on the project.
C. The lowest level of the RBS can be used as a checklist, which is a tool and technique of the Identify Risks process.
D. The RBS is similar to the WBS in that the lowest levels of both are easily assigned to a responsible party or owner.
19. Your team has identified the risks on the project and determined their risk score. The team is in the midst of determining what strategies to put in place should the risks occur. After some discussion, the team members have determined that the risk of losing their network administrator is a risk they’ll just deal with if and when it occurs. Although they think it’s a possibility and the impact would be significant, they’ve decided to simply deal with it after the fact. Which of the following is true regarding this question?
A. This is a negative response strategy.
B. This is a positive response strategy.
C. This is a response strategy for either positive or negative risk known as contingency planning.
D. This is a response strategy for either positive or negative risks known as passive acceptance.
20. All of the following are true regarding the Perform Qualitative Risk Analysis process except which one?
A. Probability and impact and expert interviews are used to help correct biases that occur in the data you’ve gathered during this process.
B. The probability and impact matrix is used during this process to assign red, yellow, and green conditions to risks.
C. Perform Qualitative Risk Analysis is an easy method of determining risk probability and impact and usually takes a good deal of time to perform.
D. Risk urgency assessment is a tool and technique of this process used to determine which risks need near-term response plans.