
Chapter 1
Energy, Global Warming and Impact of Power Electronics in the Present Century
Bimal K. Bose
Department of Electrical Engineering and Computer Science, The University of Tennessee, Tennessee, USA
1.1 Introduction
Power electronics concerns the conversion and control of electrical power with the aid of power semiconductor devices, which include diodes, thyristors, triacs, gate turn-off thyristors (GTO), power metal oxide silicon field effect transistors (MOSFET), insulated gate bipolar transistors (IGBT) and integrated gate-commutated thyristors (IGCT). Their applications include regulated power supplies (DC and AC), uninterruptible power supply (UPS) systems, electrochemical processes (such as electroplating, electrolysis, anodizing and metal refining), control of heating and lighting, electronic welding, power line static var compensators (SVC or STATCOM) and flexible AC transmission systems (FACTS), active harmonic filters (AHFs), high-voltage direct current (HVDC) systems, photovoltaic (PV) and fuel cell (FC) converters, electronic circuit breakers, high-frequency heating, energy storage and motor drives. The extensive applications of power electronics in global industrialization have been somewhat unprecedented in history. We now live in a global society in which the nations in the world are highly interdependent. In the present trend, it is expected that future wars in the world will be fought on an economic front rather than military. In future, all the nations in the world will face severe industrial competitiveness for their survival and prosperity. In such an environment, power electronics and motion control will play a very important role. In addition, as the price of energy increases and environmental regulations become more stringent, power electronics applications will spread practically everywhere. The role of power electronics in this century will be as, if not more, important as computer, communication and information technologies.
It should be mentioned here that power electronics technology has now gained significant maturity after several decades of the dynamic technology evolution of power semiconductor devices, converters, pulse width modulation (PWM) techniques, electrical machines, variable-frequency drives, advanced controls and computer simulation techniques. According to the estimate of the Electric Power Research Institute (EPRI) of the United States, roughly 70% of electrical energy in the United States is now processed through power electronics, which will eventually expand to 100%. In the present century, we expect to see the significant impact of power electronics not only in global industrialization and general energy systems, but also in energy conservation, renewable energy systems, bulk energy storage and electric vehicles (EVs) and hybrid electric vehicles (HEVs). The corresponding impact in solving or mitigating climate change problems is expected to be significant. This chapter will start with a review of the global energy perspective, environmental pollution because of the burning of fossil fuels, the corresponding climate change or global warming problems and the methods for their mitigation. Then, it will review the impact of power electronics in energy saving, renewable energy systems, the bulk storage of energy and EVs and HEVs. Finally, the future scenario of power electronics technology evolution will be reviewed in the conclusion.
1.2 Energy
Let us first discuss the global energy perspective [1–6]. Figure 1.1 shows the global energy generation and the generation of US energy in the same perspective. About 84% of global energy is generated by fossil fuels, 3% from nuclear plants and the remaining 13% comes from renewable sources, such as hydro, wind, solar, biofuels, geothermal, wave and tidal power. US energy generation follows a similar pattern. About 41% of US energy comes from oil, of which a significant part is imported. The present availability of shale oil (and natural gas) is decreasing this dependence, and according to the forecast of the International Energy Agency (IEA), the United States will be energy independent in the future. The global per capita energy consumption is highest in the United States. With nearly 4.5% of world's population (313 million out of 7 billion), the United States consumes nearly 28% of global energy and this reflects a very high standard of living. In comparison, China, now the world's second largest economy, with nearly 19% of the world's population (1.34 billion), consumes nearly half the total energy consumed by the United States. Of course this scenario is changing fast because of the rapid industrialization of China.

Figure 1.1 Global and US energy generation scenarios (2008) [2]
Figure 1.2 shows the idealized energy depletion curves of fossil and nuclear fuels throughout the world, which are somewhat Gaussian in nature. The world has enormous reserves of coal, and at the present consumption rate it is expected to last approximately 200 years. From the oil depletion curve, it appears that we are presently near the peak and is expected to become exhausted in 100 years. The oil price has been increasing recently because of the rising demand and dwindling supply. The natural gas reserves are expected to last around 150 years.

Figure 1.2 Idealized fossil and nuclear energy depletion curves for the world [2]
The recent availability of large amounts of shale oil and gas is creating an economic boom in some countries, particularly in the United States, as mentioned previously. Uranium (U-235) has a very low reserve and is expected to become exhausted in around 50 years.
With adequate conservation, the curves in the figure can be flattened in order to last for a longer period. Exploration of new fuel sources, particularly offshore resources, can provide new sources of oil and gas. Renewable energy resources (not included in the figure) will theoretically extend the energy depletion curve to infinity. It is no wonder that due to their competitive costs, extensive availability and environmentally clean nature, renewable energy sources are now being extensively explored all over the world. Recent studies show that renewable energy alone (with adequate storage) can supply all the energy needs of the world.
Figure 1.3 shows electricity generation according to different fuel types for the United States, Japan, China and India. For example, in the United States, 40% of the total energy is consumed in electrical form, of which typically 50% comes from coal, 2% from oil, 18% from natural gas, 20% from nuclear plants and the remaining 10% comes from renewables (mainly hydroelectricity). The electricity generation from natural gas is more favored (with the corresponding decrease in coal) because of the availability of cheap and abundant shale gas. Japan produced 31% of its electricity from nuclear resources, but the recent accident at the Fukushima Daiichi nuclear plant is changing the scenario, with the emphasis now more on renewable resources. It is interesting to note that the world's two fastest developing economies (China and India) generate more than 70% of their electricity from coal.

Figure 1.3 Electricity generation by fuel types of some selected countries (2008) [2]
1.3 Environmental Pollution: Global Warming Problem
Unfortunately, fossil fuel burning generates gases (SO2, CO, NOX, HC and CO2) that cause environmental pollution. The most dominant effects of fossil fuel burning are climate change or global warming problems [3, 4], which is mainly caused by CO2 and other gases – called greenhouse gases (GHG). GHG trap solar heat from the atmosphere (called the greenhouse effect). The United Nations (UN) Intergovernmental Panel on Climate Change (IPCC) has ascertained that the man-made burning of fossil fuels causes the global warming problem. It may be mentioned here that nuclear power does not have the traditional environmental pollution problem, but the safety of nuclear plants with regard to the radiation hazard is of serious concern. Another problem with nuclear power is that the waste from nuclear plants remains radioactive for thousands of years, and we do not know how to safely dispose of such waste. It is possible that in the future this waste will cause considerable damage to our society.
Scientists have studied carbon (CO2) concentration variations in the atmosphere over a long period of time by analyzing ice samples from great depths in Antarctic regions. Figure 1.4 shows the CO2 concentration curves in the atmosphere over thousands of years. The causes for the cyclic variation in CO2 (ice age cycles) in the atmosphere is not well understood. However, one thing we are sure of is that in the past 1000 years (including the postindustrial revolution), the CO2 concentration has increased dramatically (see the upper curve in Figure 1.4), and is much greater than the upper limit of normal cyclic variation. Scientists believe that this peaking is due to the man-made burning of fossil fuels and is irreversible, and therefore the consequences are serious.

Figure 1.4 CO2 variation in atmosphere thousands of years ago [4]
It has been estimated that nearly 80% of atmospheric CO2 is generated by the man-made fossil fuel burning, of which typically 50% is due to electric power generation. Figure 1.5 shows the per capita CO2 emissions versus population for several selected countries in the world, where the horizontal axis shows the population and the vertical axis shows the CO2 emission per person (in tons/year). The United States has the highest per capita emission in the world and Canada is very close. Next comes Australia and the European nations, as well as Russia and Japan, where the emissions are typically less than 50% of that of the United States. The total emission of a country, given by the area of the rectangle, is very important with respect to the global warming problem.

Figure 1.5 Per capita CO2 emissions versus population of selected countries [2]
The standard of living in China is much lower than that of the United States; therefore, its per capita emission is very low. However, because of its large population the total emissions in China are large and, in fact, have exceeded that of the United States since 2006. Brazil has a good standard of living, but its per capita emission is low. In Brazil, typically 90% of energy (in electrical form) comes from hydroelectricity. In addition, it has a large Amazon rain forest that reduces CO2, and 50% of its automobiles run on renewable sugarcane-based biofuel. Biofuels are said to have a carbon neutralization effect because they absorb CO2 during the plant's growth but emit CO2 at burning.
At the present rate of growth of the world's energy consumption (if no remedial actions are taken), the estimate of the potential CO2 rise between 2002 and 2030 is provided in Figure 1.6. In 2002, the total energy consumption in the world was typically 410 quadrillion Btu (1 quadrillion = 1024 units), of which the share between fossil fuels and alternative energy sources is shown in the figure. The alternative energy sources consist of nuclear and renewable sources. The corresponding generation of CO2 by fossil fuels was typically 2.6 billion tons/year. The total energy consumption in the world is expected to grow by 60% over the next 28 years, and the corresponding CO2 level will rise by 62% (4.2 billion tons/year) because of an increased share of fossil fuels. Evidently, as a result, the global warming effect will be significant.

Figure 1.6 Potential CO2 rise during 2002–2030 without remedial measures [4]
1.3.1 Global Warming Effects
As mentioned previously, GHG cause the earth's atmosphere to accumulate solar heat and raise its temperature, which may be by a few degrees in 100 years. Climate scientists are trying to model the climate system (extremely complex) and predict the atmospheric temperature rise by extensive simulation studies on supercomputers. Figure 1.7 shows global warming over the past hundred years (1900–2000) and its future projection for the next hundred years (2000–2100) by various research agencies throughout the world. The large error in the projection is due to the inaccuracy of the climate model, which is extremely complex. However, note that none of the studies argue that there will not be any global warming.

Figure 1.7 Global warming projections by different research agencies [3]
The most harmful effect of global warming is the melting of the ice in the Arctic, the Antarctic, Greenland, the Himalayas and a large number of glaciers around the world. In fact, the study indicated that 500 000 mi2 of ice in the Arctic ocean melted in the year 2006 alone, which is much higher than the computer simulation studies by climate scientists. This is causing a great deal of confusion to climate scientists. The melting of ice is raising the levels of the oceans, with possible flooding to low-lying areas. It is estimated that about 100 million people of the world live within 3 ft of sea level. Again, with the predicted rise in the sea level, the estimate is that half of Bangladesh will be submerged in 300 years, which is expected to displace 75 million people. Again, the prediction is that should all the ice in Greenland and Antarctica melt, the sea level will rise by 200 ft. The Arctic region is expected to be free of ice (in the summer) by 2070.
The melting of the polar ice caps is destroying the habitats of polar bears and penguins, with the expected future extinction of these species. Sensitive corals in the sea are dying due to higher water temperatures and the acidity of dissolved CO2. The higher acidity of seawater will also adversely affect marine life (which is being studied extensively). Besides the rise in the ocean level, global warming will cause adverse effects to the world climate that will result in severe droughts in tropical countries. This will damage agriculture and vegetation; bring about hurricanes, tornados, heavy rains and floods; and cause the spread of diseases. These effects of global warming have been very evident in the United States in 2012. According to a UN estimate, if fossil fuel burning is completely stopped today, the ocean level will rise by nearly 5 ft over the next 1000 years. These climate change effects will result in serious unrest and instability in the world.
Considering these serious consequences, the UN Kyoto Protocol (an international agreement) was developed in 1997. According to this treaty, the participating countries are required to have a mandatory emission reduction within an assigned quota. If a country cannot meet the quota, it can purchase credits from a country that has a lower than assigned emission quota (called cap-and-trade policy). For example, the United Kingdom, with a higher than quota emission, can purchase credits from Brazil, which has an emission below the quota. Again, within a country a quota is assigned to each industry, which can buy or sell credits from another industry to satisfy the quota. The same principle is also applicable to individuals or families. There are trading organizations that control the buying and selling of credits, which are similar to transactions of shares. European countries took the leadership for the implementation of the Kyoto Treaty, but unfortunately the implementation is not being very successful in recent years. The United States did not sign up to the mandatory reduction formula of the Kyoto Treaty, although unofficial attempts are being made to reduce GHG emissions.
1.3.2 Mitigation of Global Warming Problems
The possible solutions or mitigation methods to global warming problems can be summarized as follows:
- Promote all energy consumption in electrical form. Centralized fossil fuel power stations can effectively use emission control strategies.
- Cut down or eliminate coal-fired power generation. Otherwise, develop clean coal technology with CO2 capture and underground sequestration, or an integrated gasification combined cycle (IGCC) process. As mentioned earlier, coal-based electricity generation is decreasing recently with a corresponding increase in natural gas-based generation that is cheaper and cleaner.
- Increase nuclear power. Nuclear power has the usual safety and radioactive waste problems. (The trend toward increasing nuclear power is reversing after the recent Fukushima Daiichi nuclear power plant accident in Japan.)
- Since trees absorb CO2, preserve rain forests throughout the world and promote widespread forestation.
- Control human and animal populations since they exhale GHG. In addition, a larger population means greater energy consumption. This method is not possible to implement.
- Extensively promote environmentally clean renewable energy systems.
- Replace internal combustion engine (ICE) vehicles by EVs and HEVs.
- Promote mass transportation, particularly electric trains and buses.
- Save energy by the more efficient generation, transmission, distribution and utilization of electricity, which is the goal of the future smart grid (discussed later).
- Finally, prevent energy wastage. Energy consumption should be economized to simplify life styles. Almost one-third of the total energy consumption in the world can be saved by this method.
There are, of course, a few beneficial effects of climate change. These are the exploration of offshore Arctic oil and gas, opening of shipping routes through Arctic Ocean in the summer, recovery of new land and the economy of space heating in cold climates.
1.4 Impact of Power Electronics on Energy Systems
Now let us discuss why power electronics is so important today with regard to energy systems, particularly from the viewpoint of mitigating global warming problems.
1.4.1 Energy Conservation
The improved efficiency of power electronics-based energy systems has been discussed previously. The saving of energy gives financial benefit, particularly where the energy cost is high. In addition, lower energy consumption means reduced generation, which mitigates environmental pollution or global warming problems. Power electronic control is obviously more efficient because of the switching mode operation of power semiconductor devices. According to EPRI of the United States, nearly 60–65% of grid-generated energy in the United States is consumed by motor drives and 75% of these are pumps, fans and compressor-type drives for industrial applications. For these applications, the conventional method of flow control is by throttle or damper opening, where a coupled induction motor runs at a constant speed. This method causes a lot of energy wastage due to the fluid vortex. In such applications, a power electronics-based variable-frequency motor speed control with fully open throttle can save around 20% of energy under a light load. In addition, a converter-fed machine's efficiency can be improved further by flux programming control at light load. Power electronics-based load-proportional speed control of air conditioner/heat pump can save energy by up to 20%. For example, the cost of electricity is high in Japan. For this reason, most Japanese homes use variable-speed air-conditioning to save energy. The extra cost of power electronics is recovered within a short period. One popular application of power electronics in recent years is variable-frequency multi-megawatt drives in diesel–electric ship propulsion, which can save a considerable amount of fuel compared with that of the traditional diesel–turbine drive. The flexibility of equipment installation in a ship is an additional advantage. It is estimated that about 20% of grid energy in the United States is consumed in lighting. Power electronics-based compact fluorescent lamps (CFLs) are typically four times more efficient than incandescent lamps, besides having a 10 times longer life. Some countries in the world, such as Australia and Cuba, have already banned incandescent lamps. In the United States, they will be banned in the near future. Currently, solid-state LED lamps are being increasingly used, they consume 50% less energy than CFLs and have a five times longer life, but are more expensive. High-efficiency induction and microwave cooking also saves a lot of energy. The smart or intelligent grid of tomorrow will extensively use state-of-the-art power electronics, computers, and communication technologies, and will permit optimum resource utilization, economic electricity to customers, higher energy efficiency, higher reliability and improved system security. It has been estimated that the widespread efficiency improvement in power electronics and other methods with existing technologies can save 20% of the global energy demand. Unfortunately, approximately one-third of global energy is simply wasted (particularly in the United States) because of energy being very cheap and people being affluent and have bad consumer habits. Eliminating such wastage by regulation or price increases can have a significant impact on climate change problems.
1.4.2 Renewable Energy Systems
It was mentioned earlier that renewable energy resources [7–9], such as hydro, wind, solar, biofuels, geothermal, wave and tidal powers, are environmentally clean (called “green energy”) and abundant in nature, and are therefore receiving very strong emphasis throughout the world. Scientific American recently published a paper by two Stanford University professors [10], which predicts that renewable energies alone (with adequate storage) can supply all the energy needs of the world. Another study by the UN IPCC reports that 50% of total world energy can be met by renewable resources by 2050. After the recent nuclear accident in Japan, both Japan and Germany are heavily emphasizing renewable energy. Wind and solar resources, which are heavily dependent on power electronics for conversion and control, are particularly important to meet our growing energy needs and mitigate global warming problems.
1.4.2.1 Wind Energy
In wind energy systems, the energy from the wind is converted into electricity through a generator that is coupled to a variable-speed wind turbine. Many old installations in the world use fixed-speed, cage-type induction machines. Figure 1.8 shows the torque developed in wind turbine as a function of speed at different wind velocities. If the wind velocity remains constant and the turbine speed is increased, the torque increases, reaches a peak value and then decreases. Superimposed on the family of curves is a set of peak constant power curves that are tangential to the respective torque–speed curves. For a particular wind velocity, the turbine speed can be varied so that it can deliver the maximum power (maximum aerodynamic efficiency) by maximum power point tracking (MPPT) control. The torque follows the traditional square-law characteristics with speed and the output power follows the cube law, as indicated in the figure. Figure 1.9 shows a typical variable-speed wind power generation system with an induction generator and two-sided PWM converters. The generator excitation is supplied by the PWM rectifier in order to maintain the excitation current or flux constant (or programmable, as desired). The vector control within the speed control loop (not shown) controls the excitation and active currents. The speed is programmed with the wind velocity by an MPPT control. The variable-frequency variable-voltage power is then converted to a constant voltage and frequency through a DC-link converter system before feeding to the grid. The line-side converter is responsible for maintaining the constant DC-link voltage, as shown. A simplified control using hysteresis-band current control is shown, although synchronous current control can also be used. A Scherbius type of drive with a doubly fed induction generator (DFIG) and slip power control can be used. Alternatively, a permanent magnet synchronous generator (PMSG) with diode rectifier/boost DC–DC converter/PWM inverter or a two-sided PWM converter system can be used.

Figure 1.8 Family of torque–speed characteristics for a variable-speed wind turbine at different wind velocities

Figure 1.9 Typical wind power system with two-sided PWM converters
The world has enormous wind energy resources, and currently they are the most economic “green” energy. Stanford University estimates that only 20% of the available wind energy can meet all the electricity needs of the world. Recent technology advances in variable-speed wind turbines, power electronics, and machine drives have made wind energy very competitive, almost equal to that of fossil fuel power. Wind and PV energy are particularly attractive to the one-third of the world's population that lives outside electric grids. Among the developing countries, for example, China and India have large expansion programs for wind energy. Currently, in terms of percentage energy consumption, Denmark is the leader with 25% wind energy, which is expected to rise to 40% by 2030. In terms of installed capacity, China is now the leader and the United States occupies second place (close to Germany and Spain), with a total penetration of barely more than 3% (this is because the US energy consumption is the highest in the world). The United States has the ambitious goal of increasing it to 20% by 2030. One drawback of wind energy is that its availability is sporadic in nature and may require backup power from fossil or nuclear power plants. Of course, surplus wind energy at high wind can be stored (storage will be discussed later) for lean-time utilization. Offshore wind farms generally offer higher energy output than onshore farms, although their installation and maintenance are more expensive.
1.4.2.2 PV Energy
PV devices (crystalline or amorphous Si, CdTe and copper indium gallium selenide) directly convert sunlight into electricity. The generated DC is then converted to AC and fed to the grid, or used in isolated load. In an autonomous system, there is usually a battery backup energy source. Figure 1.10 shows a typical configuration of a PV system, where a PV string consists of series–parallel combination of cells. The generated DC voltage is boosted by a DC–DC converter before inversion to AC by a PWM sinusoidal inverter. The DC–DC converter controls the maximum power output of the string by MPPT control. The channels are paralleled on the AC side and boosted in voltage by a transformer before connecting to the AC grid. A multilevel cascaded H-bridge (CHB) transformerless connection has also been proposed.

Figure 1.10 Typical configuration of photovoltaic system
The PV devices have the advantages that they are static, safe, reliable, environmentally clean (green) and hardly require any repair and maintenance like wind power systems. However, in the current state of the technology, PV energy is more expensive than wind energy (see Figure 1.14), but it truly depends on the installation cost and utilization factor. The cost of power electronics is less compared to that of the PV cell cost. Although, currently, PV energy is more expensive than that of solar thermal, with the present trend of aggressive research the price is falling sharply to be more competitive in the future. PV energy is expected to experience a significant expansion around the world. The IEEE asserts the ambitious prediction that by 2050 PV will supply 11% of the global electricity demand. With the present trend, it may not be surprising that PV power may exceed that from the wind in the future. The lifetime of a PV panel is typically 20 years, and conversion efficiency is typically 16% with the commonly used thin-film amorphous silicon. PV power has been extensively used in space applications (where cost is not a concern). Currently their applications are expanding to rooftop installations, off-grid remote applications and grid-connected installations. Japan is very determined with regard to PV research and applications, because it does not have much indigenous energy resources, and there energy is expensive. The recent accident at the Fukushima Daiichi nuclear reactors is now putting Japan's shift of emphasis from nuclear to PV resources. Recently, China has been manufacturing PV cells very economically. Unfortunately, like wind, PV power is also statistical in nature and therefore requires backup energy sources or bulk storage of surplus power. The recent smart grid concept can shift the power demand curve to match the available power curve, as will be discussed later. Currently there are ambitious plans to explore solar energy from the African deserts such as the Sahara and the Kalahari through extensive PV installations, and then tying this to the European grid through HVDC transmission.
1.4.2.3 Wave Energy
Currently wave and tidal energies (often called ocean energy) [11] are receiving an emphasis, although these resources are considerably small. Wave energy tends to explore energy from the ocean surface waves that are induced by wind. The technology is yet in an infant stage. The ocean surface goes through up-and-down oscillatory movements due to waves, and the mechanical energy is converted into electrical energy by a wave energy converter (WEC). There are more than 1000 patents for WEC. One popular type is the Pelamis converter, shown in Figure 1.11, which was installed offshore Scotland (2004). In this scheme, a number of cylindrical sections of the Pelamis converter (anchored at the bottom of the ocean) are linked by hinged joints, which produce the up-and-down movement in order to pump oil by piston that drives a hydraulic motor. The motor is connected to a permanent magnet (PM) synchronous generator. The generated AC of an irregular waveform is rectified to DC, and a number of units are series-connected to boost the DC voltage. The DC is then inverted to AC for local supply or boosted by transformer for grid connection.

Figure 1.11 Principle of wave energy by Pelamis wave energy converter [11]
However, the total available wave power is low and expensive (typically $4–$15/W), but the cost per kilowatt-hour is generally low. Wave power has the advantage that it is consistent and predictable, unlike wind and PV, but is vulnerable to bad weather conditions. The first experimental wave farm was installed in Portugal in 2008, with a capacity of 2.25 MW. The United States does not have wind power except for a small installation in Hawaii. Recently Oregon State University has been taking a lot of research initiative in this area.
1.4.2.4 Tidal Energy
Tidal energy [12] is another form of renewable energy that explores energy from tides due to the earth–moon gravitational attraction and the earth's rotation. Lunar attraction has a 12-h cycle period, i.e., every 12-h period the water level reaches a peak level. Tidal energy can be classified into three different types, that is, tidal stream generator, barrage generator and dynamic tidal power. The world's first commercial stream generator (1.2 MW capacity), which was installed in Ireland in 2007, is shown in Figure 1.12. The scheme uses a submerged axial flow water turbine (like a wind turbine) that rotates slowly in one direction and generates electricity through the coupled synchronous generator. In a tidal barrage scheme, the water is stored in a pond by a barrage at high tide. At low tide, the low potential head of the pond water drives a water turbine-synchronous generator to generate electricity. The world's largest tidal barrage power station (254 MW) was installed in South Korea in 2011. The dynamic tidal power combines generation from up-and-down water flows across the barrage. The construction cost of the barrage and pond is high, and therefore exploration of this type of energy becomes expensive. The United States does not have any tidal power plants.

Figure 1.12 Principle of tidal energy by tidal stream generator (1.2 MW plant in Ireland) [12]
1.4.2.5 Geothermal Energy
For the completeness of renewable energy sources, geothermal energy [13] will be covered. Geothermal energy is extracted from the thermal energy stored and generated within the earth. The evidence of this energy is volcanos, hot springs and so on. In the latter case, rain water seeps into the earth and is heated by geothermal energy. The stored energy comes from the earth and was created by the sun, and the generated energy comes from the radioactive decay of minerals within the earth. The geothermal energy source is limited and originates from the regional geothermal heat belts of the earth. There are three types of geothermal energy: one is direct use (or district heating system), where the energy flows naturally on earth's surface (an example is a hot water spring). Another is geothermal heat pumps for home heating, where water is injected in a horizontal or vertical coil of pipes to absorb heat. In Iceland, for example, 93% of homes are heated by geothermal energy. The third is geothermal electricity, where water injected through a pipe transfers geothermal heat, and the generated steam runs a turbo-generator like a conventional steam power plant. There are three types of geothermal electricity: (1) dry steam plant, (2) flash steam plant and (3) binary cycle plant.
Figure 1.13 shows the principle of geothermal electric power generation by a flash steam plant (most commonly used). In this method, water is injected in a pipe (may be 1 or 2 miles deep) and steam and hot water under pressure are collected in another pipe. The water is separated from the steam through a separator and recirculated and steam drives a turbine-generator system to generate electricity, as shown in the figure. In a dry steam plant, water is fully converted to dry steam, whereas in a binary cycle plant, hot water exchanges heat to a low boiling point fluid to convert it to steam for driving a turbine. Geothermal power is economic, reliable and always available unlike wind energy and solar energy. The cost is typically $3.00/W and $0.10/kWh. The worldwide production of geothermal energy is 10.7 GW (2010), and the United States is the world leader (3 GW). Interestingly, Iceland generates 100% electrical energy from renewable sources, of which 70% is by hydroelectric means and 30% is geothermal.

Figure 1.13 Principle of geothermal electricity by flash steam plant
1.4.2.6 Cost Comparison of Renewable Energy Sources
Figure 1.14 shows a cost comparison of different renewable energy sources in a decreasing order of cost, but excludes wave and tidal energy. Solar PV is the most expensive, and solar thermal is very close to it. The minimum cost of PV is shown as 18 cents/kWh, whereas the maximum cost is 43 cents/kWh. The cost depends on various factors, such as the cost of materials, land and labor, the length of day, weather conditions and so on. Although, currently the cost of solar thermal installation is lower than that of PV, it is expected that eventually with cost reduction PV usage will be much higher than solar thermal. The minimum cost of biomass, geothermal and offshore and onshore winds is almost the same, but hydroelectricity is the cheapest (4 cents/kWh). Offshore wind installation and maintenance costs are much higher than that of onshore installation, but electricity generation is also higher because of the strong and consistent winds, which balance the high cost. The cost of power electronics and grid connection is not included in the figure.

Figure 1.14 Cost comparison of renewable energy sources
1.4.2.7 FC Energy
An FC is an electrochemical device, in which hydrogen is the gaseous fuel that combines with O2 to produce electricity and water. FC stacks can be considered equivalent to series-connected low-voltage batteries. The DC voltage generated by the FC is boosted by a DC–DC converter, and then converted to AC by an inverter for AC power supply or other applications. The FC has the properties of high output resistance and sluggish transient response. H2 can be generated from water by electrolysis (reverse process of FC) or from hydrocarbon fuels (gasoline and methanol) onboard through a reformer. An FC can be defined as a clean energy source if H2 is generated from a clean energy source. FC is safe and static, and has a high efficiency (typically 54%). FC varieties are defined by the types of their electrolytes. These can be classified as proton exchange membrane FC (PEMFC), phosphoric acid FC (PAFC), direct methanol FC (DMFC) and solid-state FC (SOFC). All are commercially available, but PEMFC is the most economic with a high power density and low temperature (60–100°C), and therefore is important for FC-based electric cars. Although it is bulky and expensive in the present state of the technology, intensive R&D has recently reduced the cost of FC dramatically. Figure 1.15 shows the principle of an FC-based EV, and also summarizes the different methods of H2 generation. In an FC vehicle, a PEMFC generates the DC power, which is boosted by a DC–DC converter (not shown) and then converted into variable-frequency variable-voltage power to drive the AC motor of the vehicle. Since FC cannot absorb the vehicle's regenerative power, a battery or ultracapacitor (UC) is needed at the FC terminal (through another DC–DC converter (not shown)). The battery/UC also supplies power during acceleration because of the sluggish FC response. The H2 fuel is supplied from a tank, where it can be stored in the form of cryogenically cooled liquid or compressed gas. H2 is usually generated from water using electricity from the grid, or from environmentally clean sources such as wind, PV, or nuclear. The O2 for the FC is obtained from air through a compressor.

Figure 1.15 Fuel cell-based electric vehicle showing H2 generation methods
1.4.3 Bulk Energy Storage
As mentioned earlier, renewable energy sources such as wind and PV are statistical in nature, because of their dependence on weather conditions (and time of the day), and therefore require bulk storage of surplus energy to match the load demand curve (which is also fluctuating) on the grid. On the other hand, fossil and nuclear power plants (and also hydroelectricity) can easily adjust their generation to match fluctuating consumption patterns, and therefore storage may not be essential. However, bulk storage may be desirable for fossil and nuclear plants, considering extra energy losses due to no load or part-load operation.
Grid energy storage [14, 15] methods can be briefly summarized as follows:
1.4.3.1 Pumped Storage in Hydro Power Plant
Hydroelectric generators can be used as motor pumps to pump water from a “tail” reservoir to a “head” reservoir and store it at high level using off-peak economic grid energy. During peak demand, the head water runs the generators, as usual, to supply the demand. It is possibly the cheapest method of energy storage, but is applicable with favorable site facilities. Otherwise it may be expensive. The typical cycle energy efficiency may be 75% and cost may be less than $0.01/kWh. Currently, there is over 90 GW of pumped storage facility around the world.
Figure 1.16 shows an example of the 400 MW Scherbius drive for a variable-speed hydroelectric generator and pump storage system (the world's largest) of the Kansai Power Co. of Japan [16]. Normally a synchronous machine at constant speed is used as the generator.

Figure 1.16 400 MW Scherbius drive for variable-speed hydroelectric generator and pump storage system [16]
In a hydroelectric power system, the water head in the upstream reservoir normally varies widely. It can be shown that with variable head, if a constant speed machine is replaced by a variable speed drive (speed increasing with head), an efficiency improvement of as much as 3% can be obtained. In the daytime, the drive runs as a generator feeding power to the 500 kV grid. The DFIG speed varies from sub-synchronous (330 rpm) to super-synchronous mode (390 rpm) as the water head increases. During night time, when utility demand is low and surplus grid power is available, the machine runs as a variable speed motor to pump water from the tail to the head storage. In pumping mode, the range of speed is the same. Note that the lagging RKVA of the cycloconverter can be canceled by the leading reactive kilovolt amperes (RKVA) of the machine stator so that the total power factor can be unity. In a modern drive, the cycloconverter can be replaced by a two-sided PWM converter system.
1.4.3.2 Battery Storage
The battery has been the most common form of energy storage in the grid. In this method, electrical energy from the grid is converted to DC and stored in a battery in chemical form. Then, the stored energy is retrieved through the same converter system to feed the grid. Although very convenient, with a high cycle efficiency (typically 90%), battery storage is possibly the most expensive (typically >$0.1/kWh). Historically, lead-acid batteries have been used extensively, but recently NiCd, NaS, Li-ion and vanadium redox flow batteries are finding preference. For example, GE installed a 10-MVA lead-acid battery storage in the Southern California Edison grid in 1988. The world's largest battery storage was installed by ABB at Fairbanks, Alaska, in 2003, which uses a NiCd battery with a capacity of 27 MW for 15 min. Flow batteries have a fast response and can be more economic in large-scale storage, but the “chemical plant” is complex with continuously circulating electrolyte by pumps.
Figure 1.17 shows the battery storage system in the Southern California Edison grid [16]. Basically, it is an 18-step GTO-based phase-shifted square-wave converter system with harmonic neutralization. The system fabricates an 18-step output voltage wave by using three groups of H-bridges, where the second and third groups have a 20o and 40° phase lead, respectively, with respect to the first group. The transformer secondary connections with 15 segments fabricate the 18-step voltage wave to neutralize the harmonics (17th, 19th, etc.) and boost the output voltage, and the capacitor bank filters the harmonics. The converter system can operate as a SVC, static var generator (SVG), or static synchronous compensator (STATCOM) (leading or lagging) that can regulate the bus voltage and stabilize the power system. In modern installations, multilevel converters can be used.

Figure 1.17 10 MVA utility system battery storage
1.4.3.3 Flywheel (FW) Storage
In this form of storage, electrical energy from the grid is converted into mechanical energy through a converter-fed drive system that charges an FW, and then the energy is retrieved by the same drive operating in generating mode. The FW can be placed in a vacuum or H2 medium, and active bearing can be used to reduce the energy loss. Steel or composite material can be used in FW to withstand the high centrifugal force due to the high speed. FW storage is more economical than battery storage ($0.05/kWh) and has been used before, but mechanical storage has the usual disadvantages. The drive system in Figure 1.16 has been used to construct an FW storage system.
1.4.3.4 Superconducting Magnet Energy Storage
In the superconducting magnet energy storage (SMES) method, grid energy is rectified to DC that charges an SMES coil to store energy in magnetic form. Then the energy is retrieved by the reverse process. The coil is cooled cryogenically so that dissipation resistance tends toward zero, and then the energy can be stored indefinitely. Either liquid helium (0°K) or a high-temperature superconductor (HTS) material in liquid nitrogen (77°) can be used. The cycle efficiency can be higher than 95%. This type of energy storage is very expensive.
1.4.3.5 UC Storage
This is an energy storage device like an electrolytic capacitor (EC), but its energy storage density can be as much as 100 times higher than that of EC. UCs are available with a low-voltage rating (typically 2.5 V), and capacitor values can be very high (up to several thousand farads). The units are connected in series–parallel for higher voltage and higher capacitance values. However, the watt-hour per kilogram of UC is low compared to that of a battery. The power density (W/kg) of UC is very high, and a large amount of power can cycle through it without causing any deterioration. It is a good temporary storage device in an FC car, as shown in Figure 1.15. UCs are presently very expensive for bulk grid energy storage.
1.4.3.6 Vehicle-to-Grid Storage (V-2-G)
This is a new method for bulk energy storage, assuming that a large number of EV batteries are plugged into the grid. An EV can sell electricity to the grid during peak demand and then charge a battery during off-peak hours. V-2-G technology can be used, turning each vehicle with its 20–50 kWh battery pack into a distributed load-balancing device or emergency power source. However, charge–discharge cycles can shorten the battery life.
1.4.3.7 H2 Gas Storage
H2 can be used as a bulk energy storage medium, and then used in FC or burnt as fuel in an ICE. This idea has generated the recent concept of hydrogen economy, i.e. H2 as the future clean energy source. H2 can be generated from abundantly available renewable energy sources like wind and PV, and stored as compressed or liquefied gas as a high density fuel. Of course it can also be generated from hydrocarbon fuels with underground sequestration of undesirable CO2 gas. Bulk H2 production using biomass and its underground storage in caverns, salt domes and depleted oil and gas fields are now being investigated. The overall energy efficiency of H2 storage cycle may be 50% to 60%, which is lower than that of battery or pumped storage systems.
1.4.3.8 Compressed Air Storage
Compressed air storage is another grid energy storage method, where electricity is used to compress air through a variable speed drive and store it underground. When the electricity demand is high, compressed air is heated with a small amount of natural gas and then burnt in a gas turbine to generate electricity. The scheme has been used in Europe.
1.5 Smart Grid
Currently, in the United States and some European countries there is a tremendous stimulus of R&D activities in smart or intelligent grid [17]. Unfortunately, our present power grid system is too old, obsolete, and inefficient and presents inadequate protection for faults. What is a smart grid? A smart grid is basically an advanced electric power grid of tomorrow, integrating the advanced state-of-the-art technologies of power electronics, computer and communication. The objectives of a smart grid can be summarized as follows:
- Optimum resource utilization
- Economic electricity distribution to customers
- Higher energy efficiency
- Higher system reliability
- Higher system security
The basic concept of the smart grid is explained in Figure 1.18. The smart grid will integrate distributed renewable energy systems, such as wind, PV, etc., along with bulk power generation plants (hydro, nuclear, and fossil fuel power sources). The future power grid will also integrate bulk energy storage systems, such as pumped storage, battery, FW, UC, H2, etc., because renewable resources are fluctuating in nature, and due to the fluctuating nature of consumer demand. One of the most important elements of the smart grid is its supply–demand interactive energy management. Normally, in a grid the energy generation follows the fluctuating consumer's demand. This causes surplus generation capacity in off-peak hours and a shortage of generation at peak demand hours. Using advanced smart metering, the demand curve can be controlled (demand-side energy management) to match the available generation capacity. This means that some loads (such as EV battery charging, operation of washer/dryer, dish washer) can be programmed to operate in off-peak hours, with the incentive of lower tariffs to consumers. Ideally, if the demand curve matches the available supply curve and there is no fault in the system, no bulk storage or spare system capacity is needed. This results in optimum resource utilization. In a smart grid, when demands are established at certain grid points, optimum generation of the resources and the electricity flow paths can be programmed for the most efficient supply of electricity to the consumers. Of course, bus voltages and system frequency should always be maintained within tolerance limits. A smart grid can use power electronics-based HVDC transmission, FACTS, STATCOM, UPS, etc. to achieve the objectives mentioned above. Smart grids will help us gradually transition to a carbon-free society.

Figure 1.18 Concept of smart grid
1.6 Electric/Hybrid Electric Vehicles
The shortage of oil and environmental pollution problems are the main reasons for the worldwide R&D activities in EV/HEV over more than the last three decades. Of course, replacing ICE-based vehicles by EV/HEV also helps solve the climate change problem.
Figure 1.19 shows a typical EV drive system [18], where a battery (lead-acid 204 V) is the energy storage device. The DC from the battery is converted to variable-frequency variable-voltage AC by a PWM inverter to drive an AC motor (induction or synchronous). The particular drive system (GE-ETXII) using interior permanent magnet (IPM) synchronous machine (NdFeB, 70 hp) and vector control, was developed by the author while employed at GE. The IPM motor has better efficiency, a reduced size and higher field-weakening speed control range. In EV, the braking energy is easily regenerated to recharge the battery, which improves the energy efficiency.
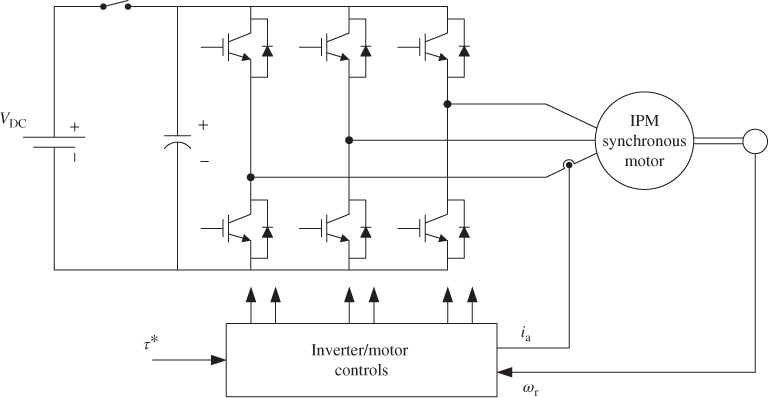
Figure 1.19 Electric vehicle drive with IPM synchronous motor (GE-ETXII)
In a HEV, the battery is the energy storage device. This is assisted by a power device which is usually a gasoline ICE. While range is the main problem in pure EV, there is no such problem in HEV. Figure 1.20 is an example configuration of the HEV drive of the popular Toyota Prius II. The axle drive power can be supplied either by an IPM synchronous motor (IPMSM) (50 kW, 500 V) or engine (57 kW at 5000 rpm), or both. The motor gets the drive power from a Ni–Mh battery (201.6 V, 1.2 kWh, 21 kW) through an IGBT inverter, which also gets the braking power from the motor. The battery has a boost DC–DC converter (not shown) to raise the DC voltage. There is no EV driving mode, but the battery assists motor acceleration and hill climbing, and (partially) absorbs the braking energy. It is charged by the engine/generator (non plug-in).

Figure 1.20 Hybrid electric vehicle drive system for Toyota Prius II (2004)
The power electronics and motor drive technology for EV/HEV is somewhat mature, with reasonably low cost. However, battery technology is not yet mature. The battery is expensive and bulky, with a large weight and limited cycle life, and charging takes several hours. Although Ni–Mh batteries have been extensively used, more recently improved Li-ion batteries are becoming available on the market. The latter has a higher storage density than the former, but is more expensive. It appears that Li-ion battery is the battery of the future, and currently there is strong emphasis on its research in the United States. HEVs are expected to disappear from the market as battery technology matures, when economic EVs with long range become available.
Currently, a number of EVs and HEVs are commercially available on the market. Among the HEVs, currently the Toyota Prius II is the most popular. Soon, a plug-in (chargeable from outlet) version with a Li-ion battery will be introduced that will give a pure EV mode of driving. Currently, Tesla Roadstar in the United States sells an EV (Li-ion battery, 215 kW, 3.5 h charging, 245 mile range) at a very high price. The battery life is typically 100 000 miles. Some examples of recent introductions to the market are the Nissan Leaf and Chevy Volt, both of which use a Li-ion battery. Leaf is a pure EV with a 100 mile range, the Volt is an HEV, for which the battery can either be charged by the ICE or from an outlet (plug-in). In pure EV mode, the range is only 40 miles, but this can extend to 360 miles with ICE charging of the battery.
1.6.1 Comparison of Battery EV with Fuel Cell EV
The R&D for both battery EV and FC EV are currently progressing simultaneously, and it is worth making some comparisons between the two types of EV. Figure 1.21 presents this comparison [19] in terms of the present technology for mass production with identical (300 mile) range, assuming that both deliver 60 kWh to the drive wheels. The battery EV is assumed to receive charging from wind energy (although currently it is mostly from coal or nuclear), which is required to supply 79 kWh with a power line efficiency of 92%, battery charging efficiency of 89%, battery efficiency of 94% and drive train efficiency of 89%, as shown in the figure. Typically, 6 kWh of regenerated energy is assumed in this calculation. The total energy efficiency of battery EV is calculated as 68%. The estimated cost of the vehicle is shown as $20 000 with a battery cost of $0.16/W and $250/kWh. The FC EV is also assumed to obtain its energy supply from wind turbines. Considering the efficiency figures of the FC EV line, the total energy efficiency is only 30%, which means that 202 kWh needs to be supplied from wind turbines. The corresponding cost figures for FC EV are indicated in the figure. Note that the auxiliary storage of the FC EV has been ignored for simplicity. Therefore, its cost figure is somewhat optimistic. In summary, the FC EV is 38% less efficient, has 43% more weight and is 50% more expensive compared to that of the battery EV. Due to these disadvantages, FC EV research has recently been considerably reduced in the United States.
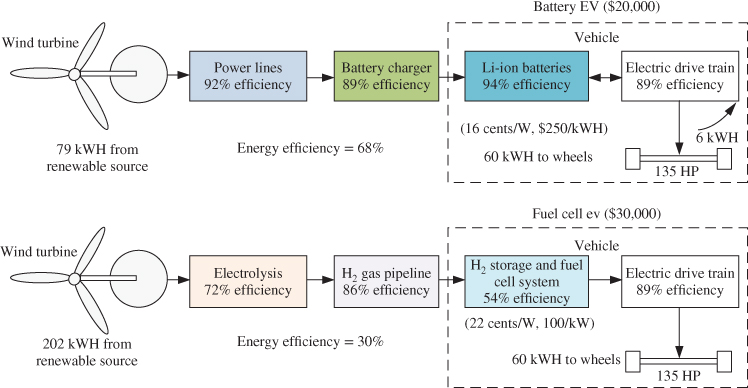
Figure 1.21 Comparison of battery EV with fuel cell-based EV (300 miles range)
1.7 Conclusion and Future Prognosis
This chapter gives a brief but comprehensive review of the world's energy resources and climate change problems due to fossil fuel burning, along with possible solutions or mitigation methods. Then, it discusses the impact of power electronics on energy conservation, renewable energy systems, bulk storage of energy and electric/hybrid vehicles in the present century. Although tidal and geothermal powers may not use power electronics, these are included for the completeness of the discussion on renewable energy systems.
Power electronics has now emerged as a major area in electrical engineering and considering the saturating trends of the technology, the present century will find significant emphasis on its applications. It is now tending to integrate with the “classical” power engineering domain. It appears that the role of power electronics in the future will be as, if not more, important and versatile as computers and information technology today. It also appears that computers, information technology, power electronics and power systems will integrate, creating a complex interdisciplinary technology. This trend is becoming evident in the emergence of smart grid technology.
What are the future trends of power electronics technology? As the technology is maturing, we will find an increasing emphasis on application-oriented R&D in converter system modularization, system modeling, system analysis, computer simulation, design and experimental evaluations. This trend is already evident in recent literature publications. In general, some advances and trends in power electronics can be mentioned as follows. In power semiconductor devices, IGBT has now emerged as the dominant device in medium- to high-power applications, whereas power MOSFET is universal in low-power high-frequency applications. The IGCT is tending to lose competition with IGBT in the high power area. The traditional silicon-based bipolar junction transistors (BJTs) and GTOs are already obsolete and thyristors indicate a trend toward obsolescence in the future. Large bandgap devices (such as SiC and GaN) are expected to bring major evolution in the usage of power electronics, particularly in high power for large drives and utility system applications. SiC-based Schottky diodes and power MOSFET half-bridges (with freewheeling diodes) at higher power are already available on the market. In fact, SiC MOSFETs with voltage ratings up to 6 kV, when available, will make most Si-based power devices obsolete. High-voltage high-power SiC MOSFET (up to 10 kV), IGBT (up to 25 kV), GTO (up to 40 kV), junction barrier Schottky (JBS) diode and P-I-N diode (up to 10 kV) are presently in the R&D stage and their emergence will create a significant impact on high-power applications of power electronics. Currently, the replacement of high-power bulky 60-Hz transformers by solid-state high-frequency-link power transformers with SiC devices is being attempted. The emerging GaN-on-Si power devices have all the advantages of SiC devices, but show significant potential for cost reductions.
Power quality and lagging displacement power factor (DPF) problems are gradually making the classical phase-controlled power electronics, which reigned for so long, obsolete and promoting PWM line-side active converters. Of course, active harmonic filters (AHF) and static var compensators tend to mitigate the problems of classical power electronics with diodes and thyristors. In the author's view, harmonic problems will be nonexistent in future power electronic systems and thus AHF will become obsolete. Among all the classes of converters, the voltage-fed type will become universal, replacing the present current-fed and cycloconverter classes. The Z-source class of inverters, which are recently showing a lot of visibility in the literature, is expected to have a doubtful future. Multilevel voltage-fed converters are showing increasing popularity in high-voltage high-power utility systems and drive applications. CHB topology has the advantages of modularity and fault-tolerant applications. Traditional matrix converters (also known as Venturini converters) using AC switches have been on and off many times since their invention in the 1980s and in the author's view its future promise appears to be bleak. The space vector modulation (SVM) technique is becoming increasingly popular over sinusoidal PWM and currently there is a trend toward SVM algorithm simplification for multilevel converters. The traditional resonant-link-based soft-switched converters for motor drives and other high-power applications have evidently lost all their promise, despite their technology evolution for a prolonged period of time. The future emphasis on converters will be mainly on modularization and system integration – similar to the trend of (very large-scale integration (VLSI) technology of microelectronics. Power electronics will evidently play a very important role in the smart grid, as discussed previously. With the increasing emphasis on distributed renewable energy sources and the installation of bulk energy storage devices, maintenance of system frequency and bus voltages with optimum resource utilization, economic electricity supply to consumers, high system energy efficiency, high system reliability and fault-tolerant operation, extensive system studies will be required.
With regard to electrical machines, although nearly a mature technology, incremental research will continue on performance optimization, precision parameter estimation, fault diagnosis and fault-tolerant control. With increasing energy costs, permanent magnet synchronous motors (PMSMs) (with NdFeB magnet) will find increasing acceptance, although they are more expensive than induction machines. IPMSM is principally more attractive because of its field-weakening capability for extended speed operation and efficiency improvement (by flux programming) under light load operation in a constant torque region. If magnet costs become sufficiently low, PMSMs will dominate over induction motors in general industrial applications. Axial flux PMSMs are expected to find applications in direct drives, particularly in wind generation systems and electric vehicles. Again, for very high-power applications, wound-field synchronous motors (WFSMs) will remain popular. In the author's view, switched reluctance motor (SRM) drives do not show any future promise in the majority of industrial applications and has a trend toward obsolescence. The majority of electrical machines are expected to have converters in the front end in the present trend of decreasing converter cost and modularization, and integrated machine-converter-controller (particularly in lower end of power) remains a definite trend. Again, slip power recovery drives that use DFIG with slip rings and reduced converter ratings for partial range speed control range will tend toward obsolescence. Currently, they are popular in wind generation systems. Among all the drive control techniques, the scalar control techniques (including direct torque control) will tend to become obsolete and vector control will emerge as the universal controller. The cost difference in the complex vector drive and simple scalar control is barely noticeable because only the software is more complex in the former, whereas the control hardware essentially remains the same. MATLAB/Simulink-based simulation, particularly real-time simulation with hardware-in-the-loop (HIL), is recently receiving more emphasis. Although the sensorless vector drive is already commercially available, zero-speed (or zero-frequency) precision speed or position estimation remains a challenge because of the need for machine saliency, complex signal processing with externally injected signal and precision machine parameter estimation problem. This estimation is more complex for induction machines compared to that of PMSM (which has built-in saliency). However, zero-frequency sensorless PMSM drives have recently been used in commercial drives. Online fault diagnosis and the fault-tolerant control of converter-machine systems is an important R&D area, which will have increasing emphasis in the future. With the present trend for digital signal processor (DSP) and field programmable gate array (FPGA) (or application-specific integrated circuit (ASIC)), the single chip control of sensorless vector drive with fault-tolerant control is not far away. As artificial intelligence technology matures, intelligent control and estimation (particularly based on neural networks) will find increasing acceptance in power electronic systems. With the maturing DSP and FPGA technologies, the predictive control of power electronic systems based on plant models and system variables with the well-known developed theory are showing a comeback for enhanced system performance. Finally, R&D in FCs, PV cells, batteries, passive circuit components, high-temperature superconductivity (HTS), DSPs and ASIC chips will significantly impact on power electronics evolution in this century.
References
- 1. Bose, B.K. (2011) Energy scenario and impact of power electronics in 21st. century. Proceedings of Qatar Workshop of Power Electronics for Industrial Applications and Renewable Energy Conversion, held in Doha, Qatar on November 3–4, 2011, pp. 10–22.
- 2. Bose, B.K. (2013) Global energy scenario and impact of power electronics in 21st century. IEEE Transactions on Industrial Electronics, 60, 2638–2651.
- 3. Global Warming http://en.wikipedia.org/wiki/Global_warming (accessed 20 September 2011).
- 4. Bose, B.K. (2010) Global warming. IEEE Industrial Electronics Magazine, 4, 1–17.
- 5. Bose, B.K. (2010) Energy, global warming and power electronics. Proceedings of the 4th National Power Electronics Conference, Roorkee, India, June 11, 2010.
- 6. Roth, J.R. (1995) Long Term Global Energy Issues in Industrial Plasma Engineering, vol. 1, Institute of Physics Publishing, Philadelphia, PA.
- 7. IPCC Summary for Policy Makers (2011) Special Report Renewable Energy Sources, UAE, May 5–8, 2011.
- 8. Simoes, M.G. and Farret, F.A. (2004) Renewable Energy Systems, CRC Press, Boca Raton, FL.
- 9. Farret, F.A. and Simoes, M.G. (2006) Integration of Alternate Sources of Energy, John Wiley/IEEE Press, Piscataway, NJ.
- 10. Jacobson, M.Z. and Delunocchi, M.A. (2009) A path to sustainable energy by 2030. Scientific American, 282, 58–65.
- 11. Ocean Energy Regulatory Development, Policy and Guidelines, http://ocsenergy.anl.gov/guide/wave/index.cfm (accessed 10 July 2011).
- 12. Tidal Power http://en.wikipedia.org/wiki/Tidal_power (accessed 20 September 2011).
- 13. Geothermal Energy http://en.wikipedia.org/wiki/Geothermal_energy (accessed 22 June 2011).
- 14. Grid Energy Storage http://en.wikipedia.org/wiki/Grid_energy_storage (accessed 10 June 2011).
- 15. Vazquez, S., Lukic, S., Galvan, E. et al. (2010) Energy storage systems for transport and grid applications. IEEE Transactions on Industrial Electronics, 57, 3881–3895.
- 16. Bose, B.K. (2006) Power Electronics and Motor Drives – Advances and Trends, Academic Press, Burlington, MA.
- 17. Ipakchi, A. and Albuyeh, F. (2009) Grid of the future. IEEE Power & Energy Magazine, 7 (2), 52–62.
- 18. Bose, B.K. (1988) A high performance inverter-fed drive system of an interior permanent magnet synchronous machine. IEEE Transactions on Industry Applications, 24, 987–997.
- 19. Eaves, S. and Eaves, J. (2003) A cost comparison of fuel-cell and battery electric vehicles. Journal of Power Sources, 24–30.
- 20. Bose, B.K. (2000) Energy, environment and power electronics. IEEE Transactions on Power Electronics, 15 (4), 688–701.
- 21. Wu, B., Lang, Y., Zargari, N., and Kouro, S. (2011) Power Conversion and Control of Wind Energy Systems, John Wiley & Sons, Ltd/IEEE Press, Piscataway, NJ.
- 22. Teodorescu, T., Liserre, M., and Rodriguez, P. (2011) Grid Converters for Photovoltaic and Wind Power Systems, John Wiley & Sons, Ltd/IEEE Press, Piscataway, NJ.
- 23. Bose, B.K. (2009) Power electronics and motor drives—recent progress and perspective, IEEE Transactions on Industrial Electronics, 56 (2), 581–588.