Overvoltages Caused by Direct Lightning Strokes
Tennessee Technological University
7.1 Direct Strokes to Unshielded Lines
7.2 Direct Strokes to Shielded Lines
7.4 Outage Rates by Direct Strokes
Unshielded Lines • Shielded Lines
7.5 Effects of Induction for Direct Strokes
7.6 Ground Impedance and Corona under Lightning
A lightning stroke is defined as a direct stroke if it hits either the tower or the shield wire or the phase conductor. This is illustrated in Figure 7.1. When the insulator string at a tower flashes over by direct hit either to the tower or to the shield wire along the span, it is called a backflash; if the insulator string flashes over by a strike to the phase conductor, it is called a shielding failure for a line shielded by shield wires. Of course, for an unshielded line, insulator flashover is caused by backflash when the stroke hits the tower or by direct contact with the phase conductor. In the analysis of performance and protection of power systems, the most important parameter that must be known is the insulation strength of the system. It is not a unique number. It varies according to the type of the applied voltage, for example, DC, AC, lightning, or switching surges. For the purpose of lightning performance, the insulation strength has been defined in two ways: basic impulse insulation level (BIL) and critical flashover voltage (CFO or V50). BIL has been defined in two ways. The statistical BIL is the crest value of a standard (1.2/50 μs) lightning impulse voltage, which the insulation will withstand with a probability of 90% under specified conditions. The conventional BIL is the crest value of a standard lightning impulse voltage, which the insulation will withstand for a specific number of applications under specified conditions. CFO or V50 is the crest value of a standard lightning impulse voltage, which the insulation will withstand during 50% of the applications. In this chapter, we will use the conventional BIL as the insulation strength under lightning impulse voltages. Analysis of direct strokes to overhead lines can be divided into two classes: unshielded lines and shielded lines. The first discussion involves the unshielded lines.
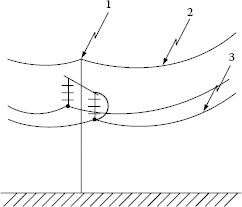
FIGURE 7.1 Illustration of direct lightning strokes to line: (1) backflash caused by direct stroke to tower, (2) backflash caused by direct stroke to shield wire, and (3) insulator flashover by direct stroke to phase conductor (shielding failure).
7.1 Direct Strokes to Unshielded Lines
If lightning hits one of the phase conductors, the return-stroke current splits into two equal halves, each half traveling in either direction of the line. The traveling current waves produce traveling voltage waves, which are given by
(7.1) |
where
I is the return-stroke current
Zo is the surge impedance of the line given by Zo = (L/C)1/2, and L and C are the series inductance and capacitance to ground per meter length of the line
These traveling voltage waves stress the insulator strings from which the line is suspended as these voltages arrive at the succeeding towers. The traveling voltages are attenuated as they travel along the line by ground resistance and mostly by the ensuing corona enveloping the struck line. Therefore, the insulators of the towers adjacent to the struck point are most vulnerable. If the peak value of the voltage, given by Equation 7.1, exceeds the BIL of the insulator, then it might flash over, causing an outage. The minimum return-stroke current that causes an insulator flashover is called the critical current, Ic, of the line for the specified BIL. Thus, following Equation 7.1,
(7.2) |
Lightning may hit one of the towers. The return-stroke current then flows along the struck tower and over the tower-footing resistance before being dissipated in the earth. The estimation of the insulator voltage in that case is not simple, especially because there has been no consensus about the modeling of the tower in estimating the insulator voltage. In the simplest assumption, the tower is neglected. Then, the tower voltage, including the voltage of the cross arm from which the insulator is suspended, is the voltage drop across the tower-footing resistance given by Vtf = IRtf, where Rtf is the tower-footing resistance. Neglecting the power-frequency voltage of the phase conductor, this is then the voltage across the insulator. It should be noted that this voltage will be of opposite polarity to that for stroke to the phase conductor for the same polarity of the return-stroke current.
Neglecting the tower may be justified for short towers. The effect of the tower for transmission lines must be included in the estimation of the insulator voltage. For these cases, the tower has also been represented as an inductance. Then the insulator voltage is given by Vins = Vtf + L(dI/dt), where L is the inductance of the tower.
However, it is known that voltages and currents do travel along the tower. Therefore, the tower should be modeled as a vertical transmission line with a surge impedance, Zt, where the voltage and current waves travel with a velocity, vt. The tower is terminated at the lower end by the tower-footing resistance, Rtf, and at the upper end by the lightning channel that can be assumed to be another transmission line of surge impedance, Zch. Therefore, the traveling voltage and current waves will be repeatedly reflected at either end of the tower while producing voltage at the cross arm, Vca. The insulator from which the phase conductor is suspended will then be stressed at one end by Vca (to ground) and at the other end by the power-frequency phase-to-ground voltage of the phase conductor. Neglecting the power-frequency voltage, the insulator voltage, Vins, will be equal to the cross-arm voltage, Vca. This is schematically shown in Figure 7.2a. The initial voltage traveling down the tower, Vto, is Vto(t) = ZtI(t), where I(t) is the initial tower current that is a function of time, t. The voltage reflection coefficients at the two ends of the tower are given by
(7.3) |
Figure 7.2b shows the lattice diagram of the progress of the multiply reflected voltage waves along the tower. The lattice diagram, first proposed by Bewley (1951), is the space–time diagram that shows the position and direction of motion of every incident and reflected and transmitted wave on the system at every instant of time. In Figure 7.2, if the heights of the tower and the cross arm are ht and hca, respectively, and the velocity of the traveling wave along the tower is vt, then the time of travel from the tower top to its foot is τt = ht/vt, and the time of travel from the cross arm to the tower foot is τca = hca/vt.

FIGURE 7.2 Lightning channel striking tower top: (a) schematic of struck tower; (b) voltage lattice diagram.
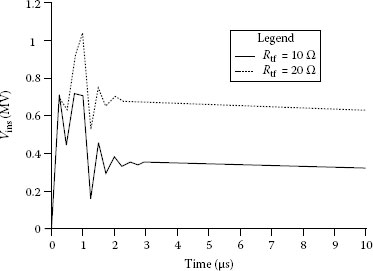
FIGURE 7.3 Profiles of insulator voltage for an unshielded line for a lightning stroke to tower. Tower height = 30 m; cross-arm height = 27 m; phase-conductor height = 25 m; cross-arm width = 2 m; return-stroke current = 1/50 ms 30 kA; Zt = 100 Ω; Zch = 500 Ω.
In Figure 7.2b, the two solid horizontal lines represent the positions of the tower top and the tower foot, respectively. The broken horizontal line represents the cross-arm position. It takes (τt – τca) seconds for the traveling wave to reach the cross arm after lightning hits the tower top at t = 0. This is shown by point 1 in Figure 7.2b. Similarly, the first reflected wave from the tower foot (point 2 in Figure 7.2b) reaches the cross arm at t = (τt + τca). The first reflected wave from the tower top (point 3 in Figure 7.2b) reaches the cross arm at t = (3τt – τca). The downward-moving voltage waves will reach the cross arm at t = (2n – 1) τt – τca, and the upward-moving voltage waves will reach the cross arm at t = (2n – 1) τt + τca, where n = 1, 2, …, n. The cross-arm voltage, Vca(t), is then given by
(7.4) |
The voltage profiles of the insulator voltage, Vins(=Vca), for two values of tower-footing resistances, Rtf, are shown in Figure 7.3. It should be noticed that the Vins is higher for higher Rtf and that it approaches the voltage drop across the tower-footing resistance (IRtf) with time. However, the peak of Vins is significantly higher than the voltage drop across Rtf. Higher peak of Vins will occur for (1) taller tower and (2) shorter front time of the stroke current (Chowdhuri, 2004).
7.2 Direct Strokes to Shielded Lines
One or more conductors are strung above and parallel to the phase conductors of single- and doublecircuit overhead power lines to shield the phase conductors from direct lightning strikes. These shield wires are generally directly attached to the towers so that the return-stroke currents are safely led to ground through the tower-footing resistances. Sometimes, the shield wires are insulated from the towers by short insulators to prevent power-frequency circulating currents from flowing in the closed-circuit loop formed by the shield wires, towers, and the earth return. When lightning strikes the shield wire, the short insulator flashes over, connecting the shield wire directly to the grounded towers.
For a shielded line, lightning may strike either a phase conductor or the shield wire or the tower. If it strikes a phase conductor but the magnitude of the current is below the critical current level, then no outage occurs. However, if the lightning current is higher than the critical current of the line, then it will precipitate an outage, which is called the shielding failure. In fact, sometimes, shielding is so designed that a few outages are allowed, the objective being to reduce excessive cost of shielding. However, the critical current for a shielded line is higher than that for an unshielded line because the presence of the grounded shield wire reduces the effective surge impedance of the line. The effective surge impedance of a line shielded by one shield wire is given by (Chowdhuri, 2004)
(7.5) |
(7.6) |
where
hp and rp are the height and the radius of the phase conductor
hs and rs are the height and the radius of the shield wire
dp′s is the distance from the shield wire to the image of the phase conductor in the ground
dps is the distance from the shield wire to the phase conductor
Z11 is the surge impedance of the phase conductor in the absence of the shield wire, Z22 is the surge impedance of the shield wire, and Z12 is the mutual surge impedance between the phase conductor and the shield wire.
It can be shown that either for strokes to tower or for strokes to shield wire, the insulator voltage will be the same if the attenuation caused by impulse corona on the shield wire is neglected (Chowdhuri, 2004). For a stroke to tower, the return-stroke current will be divided into three parts; two parts going to the shield wire in either direction from the tower and the third part to the tower. Thus, lower voltage will be developed along the tower of a shielded line than that for an unshielded line for the same return-stroke current, because lower current will penetrate the tower. This is another advantage of a shield wire. The computation of the cross-arm voltage, Vca, is similar to that for the unshielded line, except for the following modifications in Equations 7.3 and 7.7:
1. The initial tower voltage is equal to IZeq, instead of IZt as for the unshielded line, where Zeq is the impedance as seen from the striking point, that is,
(7.7) |
where Zs = 60ℓn(2hs/rs) is the surge impedance of the shield wire.
2. The traveling voltage wave moving upward along the tower, after being reflected at the tower foot, encounters three parallel branches of impedances, the lightning-channel surge impedance, and the surge impedances of the two halves of the shield wire on either side of the struck tower. Therefore, Zch in Equation 7.3 should be replaced by 0.5ZsZch/(0.5Zs + Zch).
The insulator voltage, Vins, for a shielded line is not equal to Vca, as for the unshielded line. The shield-wire voltage, which is the same as the tower-top voltage, Vtt, induces a voltage on the phase conductor by electromagnetic coupling. The insulator voltage is, then, the difference between Vca and this coupled voltage:
(7.8) |
where ksp = Z12/Z22. It can be seen that the electromagnetic coupling with the shield wire reduces the insulator voltage. This is another advantage of the shield wire. To compute Vtt, we go back to Figure 7.2. As the cross arm is moved toward the tower top, τca approaches τt, and naturally, at tower top τca = τt. Then, except the wave 1, the pairs of upward-moving and downward-moving voltages (e.g., 2 and 3, and 4 and 5) arrive at the tower top at the same time. Substituting τca = τt in Equation 7.4, and writing at2 = 1 + ar2, we get Vtt:
(7.9) |
From Equation 7.3
(7.10) |
The coefficient, at2, is called the coefficient of voltage transmission.
When lightning strikes the tower, equal voltages (IZeq) travel along the tower as well as along the shield wire in both directions. The voltages on the shield wire are reflected at the subsequent towers and arrive back at the struck tower at different intervals as voltages of opposite polarity (Chowdhuri, 2004). Generally, the reflections from the nearest towers are of any consequence. These reflected voltage waves lower the tower-top voltage. The tower-top voltage remains unaltered until the first reflected waves arrive from the nearest towers. The profiles of the insulator voltage for the same line as in Figure 7.3 but with a shield wire are shown in Figure 7.4. Comparing Figures 7.3 and 7.4, it should be noticed that the insulator voltage is significantly reduced for a shielded line for a stroke to tower. This reduction is possible because (1) a part of the stroke current is diverted to the shield wire, thus reducing the initial tower-top voltage (Vto = ItZt, It < I), and (2) the electromagnetic coupling between the shield wire and the phase conductor induces a voltage on the phase conductor, thus lowering the voltage difference across the insulator (Vins = Vca – kspVtt).
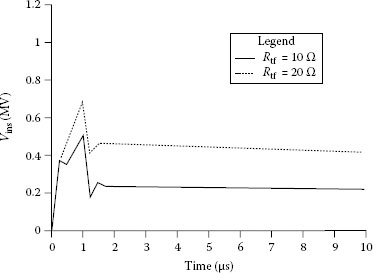
FIGURE 7.4 Profiles of insulator voltage for a shielded line for lightning stroke to tower. Tower height = 30 m; cross-arm height = 27 m; phase-conductor height = 25 m; cross-arm width = 2 m; return-stroke current = 1/50 ms 30 kA; Zt = 100 V; Zch = 500 V.
Striking distance of the lightning stroke plays a crucial role in the design of shielding. Striking distance is defined as the distance through which a descending stepped leader will strike a grounded object. Armstrong and Whitehead (1968) and Brown and Whitehead (1969) proposed a simple relation between the striking distance, rs, and the return-stroke current, I (in kA), of the form
(7.11) |
where a and b are constants. The most frequently used value of a is 8 or 10, and that of b is 0.65. Let us suppose that a stepped leader with prospective return-stroke current of Is is descending near a horizontal conductor, P (Figure 7.5a). Its striking distance, rs, will be given by Equation 7.11. It will hit the surface of the earth when it penetrates a plane which is rs meters above the earth. The horizontal conductor will be struck if the leader touches the surface of an imaginary cylinder of radius, rs, with its center at the center of the conductor. The attractive width of the horizontal conductor will be ab in Figure 7.5a. It is given by
(7.12a) |
and
(7.12b) |
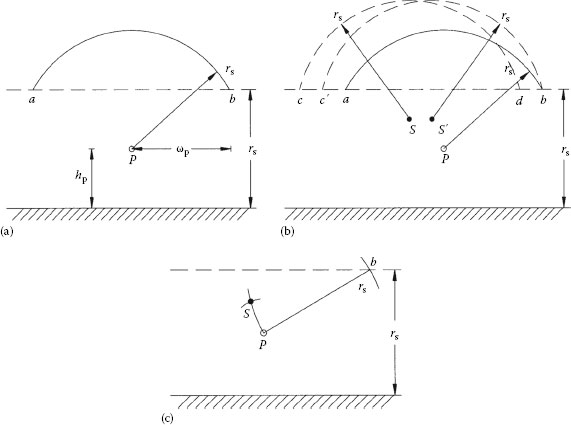
FIGURE 7.5 Principle of shielding: (a) electrogeometric model, (b) shielding principle, and (c) placement of shield wire for perfect shielding.
where hp is the height of the conductor. For a multiconductor line with a separation distance, dp, between the outermost conductors, the attractive width will be 2ωp + dp.
Now, if a second horizontal conductor, S, is placed near P, the attractive width of S will be cd (Figure 7.5b). If S is intended to completely shield P, then the cylinder around S and the rs-plane above the earth’s surface must completely surround the attractive cylinder around P. However, as Figure 7.5b shows, an unprotected width, db, remains. Stepped leaders falling through db will strike P. If S is repositioned to S′ so that the point d coincides with b, then P is completely shielded by S.
The procedure to place the conductor, S, for perfect shielding of P is shown in Figure 7.5c. Knowing the critical current, Ic, from Equation 7.2, the corresponding striking distance, rs, is computed from Equation 7.11. A horizontal straight line is drawn at a distance, rs, above the earth’s surface. An arc of radius, rs, is drawn with P as center, which intersects the rs-line above earth at b. Then, an arc of radius, rs, is drawn with b as center. This arc will go through P. Now, with P as radius another arc is drawn of radius rsp, where rsp is the minimum required distance between the phase conductor and a grounded object. This arc will intersect the first arc at S, which is the position of the shield wire for perfect shielding of P.
Figure 7.6 shows the placement of a single shield wire above a three-phase horizontally configured line for shielding. In Figure 7.6a, the attractive cylinders of all three phase conductors are contained within the attractive cylinder of the shield wire and the rs-plane above the earth. However, in Figure 7.6b where the critical current is lower, the single shield wire at S cannot perfectly shield the two outer phase conductors. Raising the shield wire helps in reducing the unprotected width; but, in this case, it cannot completely eliminate shielding failure. As the shield wire is raised, its attractive width increases until the shield-wire height reaches the rs-plane above the earth, where the attractive width is the largest, equal to the diameter of the rs-cylinder of the shield wire. Raising the shield-wire height further will not help. In this case, either the insulation strength of the line should be increased (i.e., the critical current increased) or two shield wires should be used.
Figure 7.7 shows the use of two shield wires. In Figure 7.7a, all three phase conductors are completely shielded by the two shield wires. However, for smaller Ic (i.e., smaller rs), part of the attractive cylinder of the middle phase conductor is left exposed (Figure 7.7b). This shows that the middle phase conductor may experience shielding failure even when the outer phase conductors are perfectly shielded. In that case, either the insulation strength of the line should be increased or the height of the shield wires raised or both.

FIGURE 7.6 Shielding of three-phase horizontally configured line by single shield wire: (a) perfect shielding and (b) imperfect shielding.

FIGURE 7.7 Shielding of three-phase horizontally configured line by two shield wires: (a) perfect shielding and (b) imperfect shielding.
Successful design of shielding depends on the accurate knowledge of the striking distance. The stepped leader parameters (cloud height, charge distribution along the leader) as well as the heights of the tower and the shield wires play prominent roles in determining the striking distances to the shield (tower and shield wires). The leader parameters are stochastic. However, no statistical data on these parameters, except the polarity, are available now. Extensive discussion on the striking distance can be found in Chowdhuri et al. (2007).
The most significant parameter in estimating the insulator voltage is the return-stroke current, that is, its peak value, waveshape, and statistical distributions of the amplitude and waveshape. The waveshape of the return-stroke current is generally assumed to be double exponential where the current rapidly rises to its peak exponentially and subsequently decays exponentially:
(7.13) |
The parameters, Io, a1, and a2, are determined from the given peak, Ip, the front time, tf, and the time to half value, th, during its subsequent decay. However, the return-stroke current can also be simulated as a linearly rising and linearly falling wave:
(7.14) |
where
(7.15) |
Io, a1, and a2 of the double exponential function in Equation 7.13 are not very easy to evaluate. In contrast, α1 and α2 of the linear function in Equation 7.14 are easy to evaluate as given in Equation 7.15. The results from the two waveshapes are not significantly different, particularly for lightning currents where tf is on the order of a few microseconds and th is several tens of microseconds. As th is very long compared to tf, the influence of th on the insulator voltage is not significant. Therefore, any convenient number can be assumed for th (e.g., 50 ms) without the loss of accuracy.
The statistical variations of the peak return-stroke current, Ip, fit the log-normal distribution (Popolansky, 1972). The probability density function of Ip, p(Ip), can then be expressed as
(7.16) |
where
σℓnlp is the standard deviation of ℓnIp
Ipm is the median value of the return-stroke current, Ip
The cumulative probability, Pc, that the peak current in any lightning flash will exceed Ip kA can be determined by integrating Equation 7.16 as follows:
Substituting,
(7.17) |
(7.18) |
The probability density function, p(tf), of the front time, tf, can be similarly determined by replacing Ipm and σℓnlp by the corresponding tfm and σℓntf in Equations 7.17 and 7.18. Assuming no correlation between Ip and tf, the joint probability density function of Ip and tf is p(Ip, tf) = p(Ip)p(tf). The equation for p(Ip, tf) becomes more complex if there is a correlation between Ip and tf (Chowdhuri, 2004). The joint probability density function is then given by
(7.19) |
where
and ρ = coefficient of correlation. The statistical parameters (Ipm, σℓnIp, tfm, and σℓntf) have been analyzed in Anderson and Eriksson (1980) and Eriksson (2005) and are given in Chowdhuri (2004) and IEEE = PES Task Force 15.09 (2005):
Besides Ip and tf, the ground flash density, ng, is the third significant parameter in estimating the lightning performance of power systems. The ground flash density is defined as the average number of lightning flashes per square kilometer per year in a geographic region. It should be borne in mind that the lightning activity in a particular geographic region varies by a large margin from year to year. Generally, the ground flash density is averaged over 10 years. In the past, the index of lightning severity was the keraunic level, that is, the number of thunder days in a region, because that was the only parameter available. Several empirical equations have been used to relate keraunic level with ng. However, there has been a concerted effort in many parts of the world to measure ng directly, and the measurement accuracy has also been improved in recent years.
7.4 Outage Rates by Direct Strokes
The outage rate is the ultimate gauge of lightning performance of a transmission line. It is defined as the number of outages caused by lightning per 100 km of line length per year. One needs to know the attractive area of the line in order to estimate the outage rate. The line is assumed to be struck by lightning if the stroke falls within the attractive area. The electrical shadow method has been used to estimate the attractive area. According to the electrical shadow method, a line of height, hp meters, will attract lightning from a distance of 2 hp m from either side. Therefore, for a 100 km length, the attractive area will be 0.4 hp km2. This area is then a constant for a specific overhead line of given height and is independent of the severity of the lightning stroke (i.e., Ip). The electrical shadow method has been found to be unsatisfactory in estimating the lightning performance of an overhead power line. Now, the electrogeometric model is used in estimating the attractive area of an overhead line. The attractive area is estimated from the striking distance, which is a function of the return-stroke current, Ip, as given by Equation 7.11. Although it has been suggested that the striking distance should also be a function of other variables (Chowdhuri and Kotapalli, 1989), the striking distance as given by Equation 7.11 is being universally used.
The first step in the estimation of outage rate is the determination of the critical current. If the return-stroke current is less than the critical current, then the insulator will not flash over if the line is hit by the stepped leader. If one of the phase conductors is struck, such as for an unshielded line, then the critical current is given by Equation 7.2. However, for strikes either to the tower or to the shield wire of a shielded line, the critical current is not that simple to compute if the multiple reflections along the tower are considered as in Equation 7.4 or 7.9. For these cases, it is best first to compute the insulator voltage by Equation 7.4 or 7.9 for a return-stroke current of 1 kA, and then estimate the critical current by taking the ratio between the insulation strength and the insulator voltage caused by 1 kA of return-stroke current of the specified front time, tf, bearing in mind that the insulator voltage is a function of tf.
Methods of estimation of the outage rate for unshielded and shielded lines will be somewhat different. Therefore, they are discussed separately.
The vertical towers and the horizontal phase conductors coexist for an overhead power line. In that case, there is a race between the towers and the phase conductors to catch the lightning stroke. Some lightning strokes will hit the towers and some will hit the phase conductors. Figure 7.8 illustrates how to estimate the attractive areas of the towers and the phase conductors.
The tower and the two outermost phase conductors are shown in Figure 7.8. In the cross-sectional view, a horizontal line is drawn at a height rs from the earth’s surface, where rs is the striking distance corresponding to the return-stroke current, Is. A circle (cross-sectional view of a sphere) is drawn with radius, rs, and center at the tip of the tower, cutting the line above the earth at a and b. Two circles (representing cylinders) are drawn with radius, rs, and centers at the outermost phase conductors, cutting the line above the earth again at a and b. The horizontal distance between the tower tip and either a or b is ωt.
The side view of Figure 7.8 shows where the sphere around the tower top penetrates both the rs-plane (a and b) above ground and the cylinders around the outermost phase conductors (c and d). The projection of the sphere around the tower top on the rs-plane is a circle of radius, ωt, given by
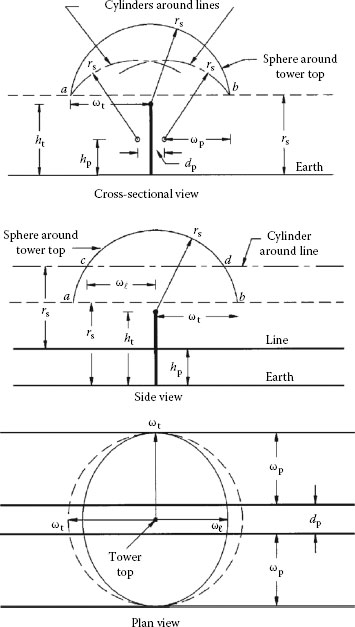
FIGURE 7.8 Attractive areas of tower and horizontal conductors.
(7.20) |
The projection of the sphere on the upper surface of the two cylinders around the outer phase conductors will be an ellipse with its minor axis, 2ωℓ, along a line midway between the two outer phase conductors and parallel to their axes; the major axis of the ellipse will be 2ωt, as shown in the plan view of Figure 7.8. ωℓ is given by
(7.21) |
If a lightning stroke with return-stroke current, Is or greater, falls within the ellipse, then it will hit the tower. It will hit one of the phase conductors if it falls outside the ellipse but within the width (2ωp + dp); it will hit the ground if it falls outside the width (2ωp + dp). Therefore, for each span length, ℓs, the attractive areas for the tower (At) and for the phase conductors (Ap) will be
(7.22a) |
and
(7.22b) |
The previous analysis was performed for the shielding current of the overhead line when the sphere around the tower top and the cylinders around the outer phase conductors intersect the rs-plane above ground at the same points (points a and b in Figure 7.8). In this case, 2ωt = 2ωp + dp. The sphere and the cylinders will intersect the rs-plane at different points for different return-stroke currents; their horizontal segments (widths) can be similarly computed. The equation for ωt is given earlier. The equation for ωp is given in Equation 7.12. Due to conductor sag, the effective height of a conductor is lower than that at the tower. The effective height is generally assumed as
(7.23) |
where hpt is the height of the conductor at tower.
The critical current, icp, for stroke to a phase conductor is computed from Equation 7.2. It should be noted that icp is independent of the front time, tf, of the return-stroke current. The critical current, ict, for stroke to tower is a function of tf. Therefore, starting with a short tf, such as 0.5 ms, the insulator voltage is determined with 1 kA of tower injected current; then, the critical tower current for the selected tf is determined by the ratio of the insulation strength (e.g., BIL) to the insulator voltage determined with 1 kA of tower injected current. The procedure for estimating the outage rate is started with the lower of the two critical currents (icp or ict). If icp is the lower one, which is usually the case, the attractive areas, Ap and At, are computed for that current. If icp < ict, then this will not cause any flashover if it falls within At. In other words, the towers act like partial shields to the phase conductors. However, all strokes with icp and higher currents falling within Ap will cause flashover. The cumulative probability, Pc(icp), for strokes with currents icp and higher is given by Equation 7.18. If there are nsp spans per 100 km of the line, then the number of outages for lightning strokes falling within Ap along the 100 km stretch of the line will be
(7.24) |
where
p(tf) is the probability density function of tf
Δtf is the front step size
The stroke current is increased by a small step (e.g., 500 A), Δi (i = icp + Δi), and the enlarged attractive area, Ap1, is calculated. All strokes with currents i and higher falling within Ap1 will cause outages. However, outage rate for strokes falling within Ap for strokes icp and greater has already been computed in Equation 7.24. Therefore, only the additional outage rate, Δnfp, should be added to Equation 7.24:
(7.25) |
where ΔAp = Ap1 – Ap. The stroke current is increased in steps of Δi and the incremental outages are added until the stroke current is very high (e.g., 200 kA) when the probability of occurrence becomes acceptably low. Then, the front time, tf, is increased by a small step, Δtf, and the computations are repeated until the probability of occurrence of higher tf is low (e.g., tf = 10.5 μs). In the mean time, if the stroke current becomes equal to ict, then the outages due to strokes to the tower should be added to the outages caused by strokes to the phase conductors. The total outage rate is then given by (Chowdhuri et al., 2002)
(7.26a) |
(7.26b) |
and
(7.26c) |
With digital computers, the total outage rates can be computed within a few seconds.
For strokes to the shield wire, the voltage at the adjacent towers will be the same as that for stroke to the tower for the same stroke current. Therefore, there will be only one critical current for strokes to shielded lines, unlike the unshielded lines. The critical current for shielded lines can be computed similar to that for the unshielded lines, except that Equation 7.8 is now used instead of Equation 7.4.
Otherwise, the computation for shielded lines is similar to that for unshielded lines. hp and dp for the phase conductors are replaced by hs and ds, which are the shield-wire height and the separation distance between the shield wires, respectively. For a line with a single shield wire, ds = 0. Generally, shield wires are attached to the tower at its top. However, the effective height of the shield wire is lower than that of the tower due to sag. The effective height of the shield wire, hs, can be computed from Equation 7.23 by replacing hpt by hst, the shield-wire height at tower.
The backflashover rates of a horizontally configured three-phase overhead line with two shield wires are computed. The dimensions of the line are shown in Table 7.1. The backflashover rates with and without shield wires are plotted in Figure 7.9 as function of the insulation withstand voltage. It should be noted that the outage rate of the unshielded line decreases much slower than that for the shielded line. This happens because the phase conductor is struck by lightning more often than the towers, and the critical current for strikes to the phase conductor is significantly smaller than that for strike to a tower.
Tower surge impedance = 100 Ω; tower-footing resistance = 10 Ω; return-stroke surge impedance = 500 Ω; ground flash density = 10/km2/year; correlation coefficient = 0.47.
TABLE 7.1 Dimensions of a Horizontally Configured Distribution Line


FIGURE 7.9 Outage rates of the horizontally configured three-phase overhead line of Table 7.1 (shielded and unshielded) caused by direct strokes to the line.
7.5 Effects of Induction for Direct Strokes
In the analysis of the insulator-string voltage, Vins, it was assumed that Vins has two components: (1) one due to the cross-arm voltage, Vca, caused by the multiply reflected traveling voltage waves along the struck tower and (2) the other due to electromagnetic coupling of the phase conductor to the shield wire for a shielded line. However, two other component voltages contribute to the total voltage across the insulator string (Chowdhuri et al., 2002; Chowdhuri, 2004). The third voltage component is induced by the electromagnetic fields of the charge and current of the return-stroke channel (Figure 7.10). The stroke channel being only a few meters from the phase conductors, the induction effect should not be ignored. The fourth voltage component is induced across the insulator string by the multiply reflected traveling current waves along the struck tower (Figure 7.10). The voltage induced across the insulator string by the rapid change of the tower current can be significant because of the proximity of the tower to the insulators.

FIGURE 7.10 Direct stroke to a tower.

FIGURE 7.11 Outage rates by direct strokes of the horizontally configured three-phase overhead line of Table 7.1 considering two and four voltage components across insulator string. Tower surge impedance = 100 Ω; tower-footing resistance = 10 Ω; velocity of traveling-wave current in tower = 0.8 p.u.; cloud height = 3 km; return-stroke surge impedance = 500 Ω; ground flash density = 10/km2/year; correlation coefficient = 0.47.
The third voltage component can be computed by the analysis shown in Chapter 8, with the difference that, in the present case, the stroke hits the tower top instead of the ground. This difference is manifested in the inducing voltage, Vi, which is given in Equations 8.2 and 8.3. The scalar potential, φ, and the vector potential, A, in Equation 8.3 can be computed from Chapter 8 of Chowdhuri (2004) with the difference that the lower and the upper limits of z′ (height of a specified point along the stepped leader) are the tower height, ht, and the cloud height, hc, for strike to the tower top. Therefore, the voltage induced on the phase conductor for a tower strike is computed for two cloud heights (hc and ht), and then the second induced voltage (for ht) is subtracted from the first induced voltage (due to hc).
The fourth voltage component, that is, the induced voltage due to the traveling current along the tower, can be computed similar to the normal case for stroke to ground, with the following modifications:
1. In the computation of the inducing voltage for a strike to ground, both the electrostatic component of the upper charge column and the magnetic component of the lower current column are considered. For the traveling current waves along the tower, only magnetic component of the electromagnetic field is considered.
2. After each reflection at either end of the struck tower, both the magnitude and the direction of travel change for the traveling current waves. Therefore, new computations must be superimposed on the initial computation after each reflection.
The effects of the third and fourth voltage components on the estimation of outage rates are shown in Figure 7.11 for a horizontally configured three-phase distribution line with two shield wires.
7.6 Ground Impedance and Corona under Lightning
The lightning current flowing through the overhead lines eventually finds its way to ground through the ground electrodes to the soil. The impedance of the ground electrodes can be computed as discussed in Chisholm (2007). The electrical characteristics of the soil in which the ground electrodes are buried play a significant role in the overall grounding impedance. The electrical resistivity of the soil bed varies from day to day, season to season, and year to year, depending upon the amount of rainfall and temperature. The soil is ionized under large lightning current. The ionization becomes more intense with larger currents. The critical electric field for soil ionization varies for the same soil, depending on its compactness, moisture content and temperature, and varying soil electrical conductivity and permittivity (Manna and Chowdhuri, 2007). All these need to be known to estimate the grounding impedance under lightning currents. Many of these parameters are not known. However, research is going on.
Anderson, R.B. and Eriksson, A.J., Lightning parameters for engineering applications, Electra, 69, 65–102, 1980.
Armstrong, H.R. and Whitehead, E.R., Field and analytical studies of transmission line shielding, IEEE Trans. Power Appar. Syst., PAS-87, 270–281, 1968.
Bewley, L.V., Traveling Waves on Transmission Systems, 2nd edn., John Wiley, New York, 1951.
Brown, G.W. and Whitehead, E.R., Field and analytical studies of transmission line shielding: Part II, IEEE Trans. Power Appar. Syst., PAS-88, 617–626, 1969.
Chisholm, W.A., Transmission system transients—Grounding, power systems, Electric Power Engineering Handbook, 2nd edn., L.L. Grigsby, (ed.), CRC Press, Boca Raton, FL, 2007.
Chowdhuri, P., Electromagnetic Transients in Power Systems, 2nd edn., Research Studies Press, Baldock, Hertfordshire, U.K., 2004.
Chowdhuri, P. and Kotapalli, A.K., Significant parameters in estimating the striking distance of lightning strokes to overhead lines, IEEE Trans. Power Delivery, 4, 1970–1981, 1989.
Chowdhuri, P., Li, S., and Yan, P., Rigorous analysis of back-flashover outages caused by direct lightning strokes to overhead power lines, IEE Proc.—Gener. Transm. Distrib., 149, 58–65, 2002.
Chowdhuri, P., Tajali, G.R., and Yuan, X., Analysis of striking distances of lightning strokes to vertical towers, IET Gener. Transm. Distrib., 1, 879–886, 2007.
Ericsson, A.J., Notes on lightning parameters, CIGRE Note 33–86 (WG33-01) IWD, 15 July 1986.
IEEE = PES Task Force 15.09, Parameters of lightning strokes: A review, IEEE Trans. Power Delivery, 20, 346–358, 2005.
Manna, T. K. and Chowdhuri, P., Generalised equation of soil critical electric field Ec based on impulse tests and measured soil electrical parameters, IET Gener. Transm. Distrib., 1, 811–817, 2007.
Popolansky, F., Frequency distribution of amplitudes of lightning currents, Electra, 22, 139–147, 1972.