
Universitat Politecnica de Catalunya
10.2 Propagation of VFT in GIS
Internal Transients • External Transients
10.3 Modeling Guidelines and Simulation
Computation of Internal Transients • Computation of TEV • Testing and Simulation • Statistical Calculation • Validation
10.4 Effects of VFT on Equipment
SF6 Insulation • Transformers • Disconnectors and Breakers • Enclosure and Cable Interfaces • Bushings • Secondary Equipment
Electromagnetic transient phenomena in power systems are caused by switching operations, faults, and other disturbances, such as lightning strokes. They may appear with a wide range of frequencies that vary from DC to several MHz and occur on a time scale that goes from microseconds to several cycles. Due to frequency-dependent behavior of power components and difficulties for developing models accurate enough for a wide frequency range, the frequency ranges are classified into groups, with overlapping between them. An accurate mathematical representation of each power component can generally be developed for a specific frequency range (CIGRE, 1990; IEC, 2006).
Very fast transients (VFT), also known as very fast front transients, belong to the highest frequency range of transients in power systems. According to the classification proposed by the CIGRE Working Group 33-02, VFT may vary from 100 kHz up to 50 MHz (1990). According to IEC 60071-1, the shape of a very fast front overvoltage is “usually unidirectional with time to peak <0.1 μs, total duration <3 ms, and with superimposed oscillations at frequency 30 kHz < f < 100 MHz” (1993). In practice, the term VFT is restricted to transients with frequencies above 1 MHz.
Several causes can originate these transients in power systems: Disconnector operations and faults within gas-insulated substations (GIS), switching of motors and transformers with short connections to the switchgear, and certain lightning conditions (IEC 60071-2, 1996).
This chapter is exclusively dedicated to explaining the origin, and to analyze the propagation and the effects of VFT in GIS. These transients have a rise time in the range of 4–100 ns and are normally followed by oscillations ranging from 1 to 50 MHz. Their magnitude is usually below 2 per unit (pu) of the line-to-neutral voltage crest, although they can also reach values higher than 2.5 pu. These values are generally below the BIL of the GIS and connected equipment of lower voltage classes. VFT in GIS are of greater concern at the highest voltages, for which the ratio of the BIL to the system voltage is lower (Yamagata et al., 1996). External VFT can be dangerous for secondary and adjacent equipment.
A description of GIS layouts and main components is out of the scope of this chapter. Readers are referred to the specialized literature (IEEE WG, 1982, 1989, 1993; IEEE Std, 2011; CIGRE, 2000; Ryan, 2001; Arora et al., 2005; Bolin, 2007; CIGRE, 2009).
VFT within a GIS are usually generated by disconnect switch operations, although other events, such as the closing of a grounding switch or a fault, can also cause VFT.
A large number of pre- or restrikes can occur during a disconnector operation due to the relatively slow speed of the moving contact (Ecklin et al., 1980). Figure 10.1 shows a very simple configuration used to explain the general switching behavior and the pattern of voltages on opening and closing of a disconnector at a capacitive load (Boggs et al., 1982). During an opening operation, sparking occurs as soon as the voltage between the source and the load exceeds the dielectric strength across contacts. After a restrike, a high-frequency current will flow through the spark and equalize the capacitive load voltage to the source voltage. The potential difference across the contacts will fall and the spark will extinguish. The subsequent restrike occurs when the voltage between contacts reaches the new dielectric strength level that is determined by the speed of the moving contact and other disconnector characteristics. The behavior during a closing operation is very similar, and the load-side voltage will follow the supply voltage until the contact is made. For a discussion of the physics involved in the restrikes and prestrikes of a disconnect switch operation; see Boggs et al., 1982.
The scheme shown in Figure 10.2 will be very useful to illustrate the generation of VFT due to a disconnector operation. The breakdown of a disconnector when it is closing originates two surges VL and VS which travel outward in the bus duct and back into the source side, respectively. The magnitude of both traveling surges is given by

FIGURE 10.1 Variation of load- and source-side voltages during disconnector switching: (a) scheme of the circuit, (b) opening operation, and (c) closing operation.
(10.1) |
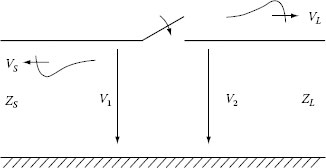
FIGURE 10.2 Generation of VFT.
where ZS and ZL are the surge impedances on the source and on the load side, respectively. V1 is the intercontact spark voltage, while V2 is the trapped charge voltage at the load side.
Steep-fronted traveling surges can also be generated in case of a line-to-ground fault, as the voltage collapse at the fault location occurs in a similar way as in the disconnector gap during striking.
10.2 Propagation of VFT in GIS
VFT in GIS can be divided into internal and external. Internal transients can produce overvoltages between the inner conductor and the enclosure, while external transients can cause stress on secondary and adjacent equipment. A summary about the propagation and main characteristics of both types of phenomena follows.
Breakdown phenomena across the contacts of a disconnector during a switch operation or a line-to-ground fault generate very short rise time traveling waves which propagate in either direction from the breakdown location. As a result of the fast rise time of the wave front, the propagation throughout a substation must be analyzed by representing GIS sections as low-loss distributed parameter transmission lines, each section being characterized by a surge impedance and a transit time. Traveling waves are reflected and refracted at every point where they encounter a change in the surge impedance. The generated transients depend on the GIS configuration and on the superposition of the surges reflected and refracted on line discontinuities such as breakers, “T” junctions, or bushings. As a consequence of multiple reflections and refractions, traveling voltages can increase above the original values and very high frequency oscillations occur.
The internal damping of the VFT influencing the highest frequency components is determined by the spark resistance. Skin effects due to the aluminum enclosure can be generally neglected. The main portion of the damping of the VFT occurs by outcoupling at the transition to the overhead line. Due to the traveling wave behavior of the VFT, the overvoltages caused by disconnector switches show a spatial distribution. Normally, the highest overvoltage stress is reached at the open end of the load side.
Overvoltages are dependent on the voltage drop at the disconnector just before striking, and on the trapped charge that remains on the load side of the disconnector. For a normal disconnector with a slow speed, the maximum trapped charge reaches 0.5 pu resulting in a most unfavorable voltage collapse of 1.5 pu. For these cases, the resulting overvoltages are in the range of 1.7 pu and reach 2 pu for very specific cases. For a high-speed disconnector, the maximum trapped charge could be 1 pu and the highest overvoltages reach values up to 2.5 pu. Although values larger than 3 pu have been reported, they have been derived by calculation using unrealistic simplified simulation models. The main frequencies depend on the length of the GIS sections affected by the disconnector operation and are usually in the range of 1–50 MHz, although much higher frequencies have been reported (Rao et al., 2005).
The following examples will be useful to illustrate the influence of some parameters on the frequency and magnitude of VFT in GIS. Figure 10.3 shows two very simple cases: A single bus duct and a “T” junction in which GIS components are modeled as lossless distributed parameter transmission lines. The source side is represented as a step-shaped source in series with a resistance, which is a simplified modeling of an infinite length bus duct. The surge impedance of all bus sections is 50 Ω. For the simplest configuration, the reflections of the traveling waves at both terminals of the duct will produce, when the source resistance is neglected, a pulse-shaped transient of constant magnitude—2 pu—and constant frequency at the open terminal. The frequency of this pulse can be calculated from the following expression:
(10.2) |
where τ is the transit time of the line (i.e., the bus duct). If the propagation velocity is close to that of light, the frequency, in MHz, of the voltage generated at the open terminal will be
(10.3) |
where d is the duct length, in meters. When a more realistic representation of the source is used (e.g., R = 40 Ω), the maximum overvoltage at the open terminal will depend on the voltage at the disconnector just before striking, and on the trapped charge which remains on the load side.
Overvoltages can reach higher values in more complex GIS configurations. The simulations performed for the “T” configuration shown in Figure 10.3 gave in all cases higher values than in the previous case, being node 4 the location where the highest overvoltages were originated.
Internally generated VFT propagate throughout the GIS and reach bushings where they cause transient enclosure voltages (TEV) and traveling waves that propagate along the overhead transmission line. An explanation about the generation of external transients and some comments on their main characteristics follow.
10.2.2.1 Transient Enclosure Voltages
TEV, also known as transient ground potential rises (TGPR), are short-duration high-voltage transients that appear on the enclosure of the GIS through the coupling of internal transients to enclosure at enclosure discontinuities. The simplified circuit shown in Figure 10.4 is used to explain the generation of TEV (Meppelink et al., 1989). At the GIS—air interface, three transmission lines can be distinguished: The coaxial GIS transmission line, the transmission line formed by the bushing conductor and the overhead line, and the GIS enclosure-to-ground transmission line. When an internal wave propagates to the gas-to-air bushing, a portion of the transient is coupled onto the overhead transmission line, and a portion is coupled onto the GIS enclosure-to-ground transmission line. The wave that propagates along the enclosure-to-ground transmission line is the TEV. The usual location for these voltages is the transition GIS-overhead line at an air bushing, although they can also emerge at visual inspection ports, insulated spacers for CTs, or insulated flanges at GIS/cables interfaces.

FIGURE 10.3 VFT overvoltages in GIS: (a) scheme of the network; (b) R = 0, V1 = 1 pu, V2 = 0; (c) R = 40 Ω, V1 = 1 pu, V2 = −1 pu; and (d) R = 40 Ω, V1 = 0.9 pu, V2 = −0.5 pu.

FIGURE 10.4 Generation of TEV: (a) GIS–air transition and (b) single-line diagram.
TEV waveforms have at least two components; the first one has a short initial rise time and is followed by high-frequency oscillations, in the range of 5–10 MHz, determined by the lengths of various sections of the GIS. The second component is of lower frequency, hundreds of kHz, and is often associated with the discharge of capacitive devices with the earthing system. Both components are damped quickly as a result of the lossy nature of the enclosure-to-ground plane transmission mode. TEV generally persists for a few microseconds. The magnitude varies along the enclosure; it can be in the range of 0.1–0.3 pu of the system voltage, and reaches the highest magnitude near the GIS–air interface. Mitigation methods include short length leads, low impedance grounding, and the installation of metal–oxide arresters across insulating spacers.
10.2.2.2 Transients on Overhead Connections
A portion of the VFT traveling wave incident at a gas–air transition is coupled onto the overhead connection and propagates to other components. This propagation is lossy and results in some increase of the waveform rise time. In general, external waveforms have two different characteristics: The overall waveshape, which is dictated by lumped circuit parameters such as the capacitance of voltage transformers or line and earthing inductance, with a rise time in the range of a few hundred nanoseconds, and a fast front portion, which is dictated by transmission line effects, with a rise time in the range of 20 ns. A fast rise time of the initial portion is possible as capacitive components, such as bushings, can be seen as physically long and cannot be treated as lumped elements; the magnitude is generally lower than that of internal VFT and it is usually reduced by discontinuities in the transmission path, with a voltage rate-of-rise in the range of 10–30 kV/μs.
10.2.2.3 Transient Electromagnetic Fields
VFT caused by switching operations and faults can produce high-frequency electromagnetic interference (EMI), which can couple into lower voltage control circuits and electronic equipment, and cause some stress. Transient electromagnetic fields (EMF) leak out into the environment through discontinuities such as gas-to-air bushing, gas-to-cable termination, nonmetallic viewing ports, or insulated flanges, and get coupled to the control equipment or data cables present in the GIS. They produce transient currents and voltages on the shield of cables and equipment. In addition, there can be conducted mechanisms that couple VFT currents to the control wiring, so a portion of the bus transient current may appear at the terminals of the relay or data-acquisition systems connected to them (Rao et al., 2005). All of these coupling modes add different waveshapes, frequency content, and relative phase shift, and result in waveshapes different from those due to any one of the coupling mechanisms acting alone.
EMI issues in GIS have been investigated in a number of studies. Measurements and model predictions for transient cable and wire currents and voltages caused by switching operations in substations were presented by Thomas et al. (1994) and Wiggins et al. (1994). More recently, Rao et al. (2005) estimated VFT currents at various locations in a GIS for different switching operations, considering the configuration of the substation and the characteristics of the components. In further studies, they analyzed the induced currents and voltages in control cables (Rao et al., 2007a), and the shielding effectiveness of bushing and bus section by computing the transient EM field emission levels from the gas-to-air bushing through the composite insulator housing and from the gas-insulated bus duct through the non-metallic flange of the support insulator (Rao et al., 2007b, 2008). The EMF radiated as a consequence of switching operations in a GIS were also studied and measured by Nishiwaki et al. (1995) to analyze the malfunction of power electronic equipment, and by Hoshino et al. (2001) to discriminate the radiation pattern created from partial discharges from that produced when switching GIS equipment.
10.3 Modeling Guidelines and Simulation
Due to the origin and the traveling nature of VFT, modeling of GIS components makes use of electrical equivalent circuits composed of lumped elements and distributed parameter lines. At very high frequencies, the skin losses can produce an important attenuation; however, these losses are usually neglected, which produces conservative results. Only the dielectric losses in some components (e.g., capacitively graded bushing) need be taken into account. The calculation of internal transients may be performed using distributed parameter models for which only an internal mode (conductor-enclosure) is taken into account, and assuming that the external enclosure is perfectly grounded. If TEV is a concern, then a second mode (enclosure-ground) is to be considered.
The next two sections present modeling guidelines to represent GIS equipment in computation of internal and external transients (Matsumura and Nitta, 1981; Dick et al., 1982; Fujimoto et al., 1982, 1986; Ogawa et al., 1986; Witzmann, 1987; CIGRE WG, 1988a; IEEE TF, 1996). They make use of singlephase models and very simple representations. Depending on the substation layout and the study to be performed, three-phase models for inner conductors (Miri and Binder, 1995; Miri and Stojkovic, 2001) or the outer enclosures (Dick et al., 1982) should be considered. More advanced guidelines have been analyzed and proposed by Haznadar et al. (1992).
10.3.1 Computation of Internal Transients
A short explanation about the representation of the most important GIS components follows.
10.3.1.1 Bus Ducts
A bus duct can be represented as a lossless transmission line. The surge impedance and the travel time are calculated from the physical dimensions of the duct. The inductance and the capacitance per unit length of a horizontal single-phase coaxial cylinder configuration, as that shown in Figure 10.5, are given by the following expressions:
(10.4) |
(10.5) |

FIGURE 10.5 Coaxial bus duct cross section.
from where the following form for the surge impedance is derived:
(10.6) |
A different approach should be used for vertically oriented bus sections (Miri and Binder, 1995). As for the propagation velocity, empirical corrections are usually needed to adjust its value. Experimental results show that the propagation velocity in GIS ducts is close to 0.95–0.96 of the speed of light (Fujimoto et al., 1984).
Other equipment, such as elbows, can also be modeled as lossless transmission lines.
10.3.1.2 Surge Arresters
Experimental results have shown that if switching operations in GIS do not produce voltages high enough to cause metal–oxide surge arrester to conduct, then the arrester can be modeled as a capacitance-to-ground. However, when the arrester conducts, the model should take into account the steep front wave effect, since the voltage developed across the arrester for a given discharge current increases as the time to crest of the current increases, but reaches crest prior to the crest of the current (CIGRE, 1990). A detailed model must represent each internal shield and block individually, and include the travel times along shield sections, as well as capacitances between these sections, capacitances between blocks and shields, and the blocks themselves.
10.3.1.3 Circuit Breakers
A closed breaker can be represented as a lossless transmission line whose electrical length is equal to the physical length, with the propagation velocity reduced to 0.95–0.96 of the speed of light. The representation of an open circuit breaker is more complicated due to internal irregularities. In addition, circuit breakers with several chambers contain grading capacitors, which are not arranged symmetrically. The electrical length must be increased above the physical length due to the effect of a longer path through the grading capacitors, while the speed of propagation must be decreased due to the effects of the higher dielectric constant of these capacitors.
10.3.1.4 Spark Dynamics
The behavior of the spark in disconnector operations can be represented by a dynamically variable resistance with a controllable collapse time. Several models have been proposed to reproduce the arc behavior, being the Toepler’s spark law the most popular one. According to Toepler, the instantaneous value of the spark resistance is inversely proportional to the charge conducted through the spark channel
(10.7) |
where
ℓ is the length of the discharge gap
i is the discharge current
k is the Toepler’s constant
For air insulation, the constant k is assumed to be between 0.004 and 0.005 V · s−1 · m−1. Some works have shown that this constant depends on several factors (e.g., the SF6 concentration, the pressure, or the inhomogeneity of the electrical field) whose influence can be significant (Osmokrovic et al., 1992; Singha and Joy Thomas, 2003). The variation with respect to the gas pressure and the SF6 concentration shows an increasing trend, being the breakdown voltage a major controlling parameter.
Other models used for representing the spark gap may be based on the classic dynamic arc representation (CIGRE, 1993; Miri and Stojkovic, 2001; Martinez-Velasco and Popov, 2009).
In general, this representation does not affect the magnitude of the maximum VFT overvoltages, but it can introduce a significant damping on internal transients (Yanabu et al., 1990).
10.3.1.5 Gas-to-air Bushings
A bushing gradually changes the surge impedance from that of the GIS to that of the line. A simplified model may consist of several transmission lines in series with a lumped resistor representing losses; the surge impedance of each line section increases as the location goes up the bushing. If the bushing is distant from the point of interest, the resistor can be neglected and a single line section can be used. A detailed model must consider the coupling between the conductor and shielding electrodes, and include the representation of the grounding system connected to the bushing (Fujimoto and Boggs, 1988; Ardito et al., 1992).
10.3.1.6 Power Transformers
At very high frequencies, a winding of a transformer may be represented as a capacitive network consisting of series capacitances between turns and coils, and shunt capacitances between turns and coils to the grounded core and transformer tank; the saturation of the magnetic core can be neglected, as well as leakage impedances (Chowdhuri, 2005). Such representation can reproduce the highly nonuniform voltage distribution developed along a transformer winding under steeped front voltages.
When analyzing the interaction of a transformer with the GIS and voltage transfer is not a concern, an accurate representation can be obtained by developing a circuit that matches the frequency response of the transformer at its terminals (Gustavsen, 2004). When voltage transfer has to be calculated, a black box model can be also derived from the frequency response of the transformer at its terminals (Morched et al., 1993; Gustavsen, 2004).
Several approaches have been developed to estimate the voltage distribution along transformer windings under VFT; they are based on the use of detailed lumped- or distributed-parameter models (Shibuya et al., 2001; Popov et al., 2003, 2007; Liang et al., 2006; Hosseini et al., 2008; Shintemirov et al., 2009). Fujita et al. (2007) have found that a shell-type transformer can be simply represented by a capacitance even when resonances occur in the winding. Details on the computation of transformer parameters for application of the various models have been presented by Degeneff (2007), Kulkarni and Khaparde (2004), and de León et al. (2009).
10.3.1.7 Three-Phase Models
The aforementioned models are based on a single-phase representation for all GIS components. However, in some GIS, usually at subtransmission levels, the three phases can be enclosed in a single encapsulation. In that case, the representation of some GIS components (e.g., ducts, elbows, T-junctions) has to include the three phases (Miri and Stojkovic, 2001). Models for three-phase ducts can be derived by using the supporting routine CABLE CONSTANT available in some transients tools (Dommel, 1996).
Tests performed with three-phase GIS switchgear have shown that the amplitude of phase-to-phase voltage transients may be higher than that between phase-to-ground, and the phase-to-phase capacitive coupling of the busbar system can raise the trapped charge left at the load side of the installation after disconnection to values above 1 pu (Smeets et al., 2000).
Table 10.1 shows a summary of modeling guidelines for representing GIS equipment in the calculation of internal VFT when single-phase models can be applied.
TABLE 10.1 Modeling Guidelines for Simulation of VFT in GIS
Component |
Representation for VFT |
Bus duct |
Distributed-parameter transmission line |
Spacer |
Lumped capacitance to ground |
Elbow |
Distributed-parameter transmission line with capacitance to ground at the terminal |
Surge arrester |
A model including the protective characteristics in parallel with arrester capacitance and in series with distributed parameters lines that represent arrester leads |
A capacitance to ground, when arrester does not conduct |
|
Circuit breaker |
Capacitive ladder network, when opened |
Lumped capacitance, when closed |
|
Nonlinear resistance, when sparking |
|
Disconnector |
Distributed-parameter transmission line, when opened |
Lumped capacitance, when closed |
|
Nonlinear resistance, when sparking |
|
Bushing |
Gas filled type: Distributed-parameter transmission line with capacitance to ground at the terminals Capacitive type: Several transmission lines in series with a lumped resistor representing losses |
Power transformer |
A circuit synthesized from its frequency response, when seen from its terminals (it can be simplified as a capacitance to ground) |
Black box model derived from its frequency response, when voltage transfer is of concern Complex lumped/distributed-parameter circuit, including turn-to-turn parameters, when voltage distribution in windings is of concern |
|
Current transformer |
Distributed-parameter transmission line with capacitance to ground at the terminal |
Line/cable termination |
Resistance matching the surge impedance of the line/cable |
At very high frequencies, currents are constrained to flow along the surface of the conductors and do not penetrate through them. The inside and the outside of a GIS enclosure are distinct, so that transients generated within the substation do not appear on the outside surface of the enclosure until discontinuities in the sheath are encountered. These discontinuities occur at gas-to-air terminations, GIS–cable transitions, or external core current transformers. The modeling of the GIS for computation of TEV must include the effects of the enclosure, the representation of ground straps, and the earthing grid.
10.3.2.1 Enclosures
A GIS–air termination can be modeled as a junction of three transmission lines, each with its own surge impedance (Figure 10.4). This equivalent network can be analyzed using lossless transmission line models to determine reflected and transmitted waves. The surge impedance of the enclosure-to-ground transmission line (Figure 10.4) is derived from the following forms:
(10.8) |
(10.9) |
(10.10) |
The basic mechanism of TEV is defined by the refraction of waves from the internal coaxial bus duct to the enclosure sheath-to-ground system. Figure 10.6 shows the scattering coefficients involved in an air–SF6 transition, and the equivalent circuit to be used for calculating these coefficients. The coefficients Sji represent the refraction of waves from line i into line j.
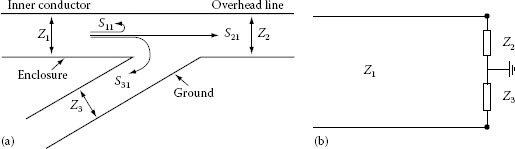
FIGURE 10.6 GIS–air transition. Scattering coefficients: (a) schematic diagram and (b) equivalent circuit.
The coefficient S11, which is also the reflection coefficient at the transition, is given by
(10.11) |
The refraction coefficient at the transition is then
(10.12) |
The magnitude of the transmitted wave onto the outside of the enclosure sheath is given by following scattering coefficient:
(10.13) |
The negative sign means that there is an inversion of the waveform with respect to the internal transient.
10.3.2.2 Ground Straps
TEV propagates back from the gas-to-air termination into the substation on the transmission line defined by the enclosure and the ground plane. The first discontinuity in the propagation is generally a ground strap. For TEV rise times, most ground straps are too long and too inductive for effective grounding. Ground leads may have a significant effect on the magnitude and waveshape of TEV. This effect can be explained by considering two mechanisms (Fujimoto et al., 1982).
First, the ground lead may be seen as a vertical transmission line whose surge impedance varies with height; when the transient reaches the ground strap, a reflected wave is originated that reduces the magnitude of the transmitted wave, with the reduction expressed by the coefficient
(10.14) |
where Zg is the surge impedance of the ground strap. As Zg is usually much larger than Z3, the attenuation produced by the ground strap will usually be small.
Second, when the portion of the wave that propagates down the ground strap meets the low impedance of the ground grid, a reflected wave is produced that propagates back to the enclosure where it will tend to reduce the original wave.
The representation of a ground lead as a constant surge impedance is not strictly correct. It has a continuously varying surge impedance, so that a continuous reflection occurs as a wave propagates down the lead. The ground strap can be divided into sections, each one represented by a surge impedance calculated from the following expression:
(10.15) |
where
r is the lead radius
h is the average height of the section (Fujimoto et al., 1982)
A constant inductor model may be adequate for straps with travel time less than the surge rise time, while a nonuniform impedance model may be necessary for very long straps.
10.3.2.3 Earthing Grid
The representation of the earthing grid at TEV frequencies is a very complex task. Furthermore, this grid may not be designed to carry very high frequency currents, as no standards for very high frequency earthing systems are currently available. A simplified modeling may be used by representing the earthing grid as a low-value constant resistance.
Advanced models for GIS components in computation of TEV might consider a frequency-dependent impedance for ground straps, a frequency-dependent model for the enclosure-to-ground line (which could take into account earth losses), and the propagation of phase-to-phase modes on the three enclosures (Fujimoto et al., 1982).
The development of GIS started in the 1960s and was basically made during the 1970s. A complete bibliography that covered early works on gaseous insulation for high-voltage equipment was presented in 1982 (IEEE Subcommittee, 1982). This list of references was later expanded (IEEE Subcommittee, 1989, 1993); see also (IEEE Std, 1993).
A significant number of works published during the 1980s were aimed at analyzing and understanding the origin and propagation of VFT in GIS, both internally and externally (Matsumura and Nitta, 1981; Narimatsu et al., 1981; Boggs et al., 1982; Dick et al., 1982; Ford and Geddes, 1982; Fujimoto et al., 1982; Blahous and Gysel, 1983; Nishiwaki et al., 1983; Gorablenkow et al., 1984; Kynast and Luehrmann; 1984; Murase et al., 1985; Fujimoto et al., 1986; Ogawa et al., 1986; Yoshida et al., 1986; Boersma, 1987; CIGRE, 1988b, 1998; Fujimoto and Boggs, 1988; Meppelink et al., 1989), as well as to develop techniques for mitigating effects caused by VFT (Ishikawa et al., 1981; Harrington and El-Faham, 1985; Lalot et al., 1986; Ozawa et al., 1986; Fujimoto et al., 1988b). Many of those works included both testing and simulations, so the approaches proposed for representing the GIS equipment could be validated. Guidelines for simulation of VFT in GIS were proposed in different papers (Witzmann, 1987; CIGRE, 1988a).
Some subsequent works were motivated by the development of GIS equipment operating at higher voltages (Toda et al., 1992; Yamagata et al., 1996, 1999), although testing and simulation works were continuously performed (Okabe et al., 1991; Lui and Hiley, 1994; Vinod Kumar et al., 2001), and more advanced and sophisticated models were proposed (Haznadar et al., 1992; Ardito et al., 1992; Osmokrovic et al., 1992; IEEE TF, 1996; Singha and Joy Thomas, 2003), covering both single- and three-phase models (Miri and Binder, 1995; Miri and Stojkovic, 2001).
The impact of EMF currents caused by switching operations within a GIS has been another field of research. Since the transient voltages in control circuits depend on the nature of the radiated EM fields and protecting these circuits against coupled transients is important for a reliable GIS operation, the transient EMI environment needs to be fully characterized and compared with equipment susceptibility levels for damage assessment. Rao et al. (2005) estimated the VFT currents that appear at various locations in a GIS for different switching operations, and considering different configurations (i.e., different duct lengths, terminal component capacitances, and duct section branches). The goal was to obtain the most relevant characteristics of the VFT currents (i.e., amplitude, attenuation of the amplitude with distance and time, dominant frequency components, and variation in the frequency content with distance) to assess the impact that the radiated EM fields caused by these currents could have on control circuits.
Some of the main characteristics of VFT caused by switching operations, as well as their propagation within and outside the GIS, have been discussed in the previous sections. They can be summarized as follows:
• The amplitude of the voltages depends on the voltage difference between the contacts prior to breakdown and the surge impedances of the bus ducts.
• Waveforms at a particular GIS location have identical waveshapes but their magnitude depend on the trapped charge at the load side, being the voltages at a particular location related by the following relationship (Lui and Hiley, 1994):
(10.16) |
where v(qi) is the voltage with trapped charge qi.
• The resulting surges propagate with very little attenuation, and overvoltages may occur as a result of reflection and refraction at discontinuities in surge impedance within the substation.
• VFT overvoltages are characterized by very short rise times (5–20 ns), short durations (a few microseconds), high rates of change of voltage (as high as several megavolts per microsecond), relatively low magnitudes (1.5–2.5 pu), and a high frequency of occurrence (some tens to hundreds of individual transients of varying amplitude for each operation).
• VFT overvoltages are a function of time and of location, and depend on the operational configuration of the GIS.
• The pattern of variation of VFT overvoltage peak along the nodes of the GIS caused by a disconnector switch operation is different from that caused by a circuit breaker operation (Vinod Kumar et al., 2001): (a) The circuit breaker operation results in the highest VFT overvoltage level; (b) peak magnitudes of VFT are higher close to the switching point in the case of disconnector operations, but they are higher at the junction of the GIS with overhead line in the case of circuit breaker operation. In any case, the steepest front time and the highest frequency of VFT overvoltages occur close to the switching point.
Lee et al. (2011) analyzed the transfer of VFT overvoltages from the EHV side of a GIS to the MV switchgear. The study is based on a real substation and was motivated by the insulation breakdown caused to the MV switchgear by some switch operation at the EHV side. The insulation failure provoked the blackout of a nuclear power plant. The simulations proved that VFT overvoltages higher than seven times the rated line-to-ground peak voltage can be transferred into the MV system. They also concluded that phase coupling in three-phase gas-insulated line and common bus duct cannot be ignored as they lead to much more dispersed spread of peak voltages under a different operation angle, and single-phase simulation could result in underestimation of the VFT overvoltage in the MV system.
Several gas mixtures with different compositions of SF6 have been considered as an alternative to pure SF6 in GIS equipment. Singha and Joy Thomas (2001) carried out simulations and experimental measurements of VFT overvoltage characteristics with SF6-N2 mixtures at different gap spacings and gas pressures. They reported a time to breakdown between 4 and 20 ns, depending on the field inhomogeneity, while the transient peaks occurred at about 200 ns after the gap had broken down. Results did show that the VFT overvoltage magnitude in N2, SF6, and its mixture increase with increasing concentration of SF6 in N2. On the other hand, the overvoltage factors increase with pressure, although the way in which factors vary depends on the gap. The variations in the overvoltage factor are directly related to the breakdown process. Changes in the VFT overvoltage rise time were not observed with short gaps for which the formative time lags do not play any important role in the discharge growth. A decrease of 10%–20% of VFT overvoltage magnitudes can be achieved with SF6–N2 mixtures, although a compromise has to be made with the operational pressure and the dimensions of the GIS apparatus and in this respect such a mixture ratio may prove insufficient.
10.3.4 Statistical Calculation
The largest VFT stresses under normal operating conditions originate from disconnector operations. The level reached by overvoltages is random by nature. The maximum overvoltage produced by a disconnector breakdown depends on the geometry of the GIS, the measuring point, the voltage prior to the transient at the load side (trapped charge), and the intercontact voltage at the time of the breakdown, as shown in Section 10.2.1.
Several works have been performed to determine the statistical distribution of VFT overvoltages in a GIS (Boggs et al., 1982, 1984; Fujimoto et al., 1988a; Yanabu et al., 1990). A very simple expression can be used to calculate the transient overvoltages as a function of time t and position s (Boggs et al., 1984; Fujimoto et al., 1988a):
(10.17) |
where
K(t, s) is the normalized response of the GIS
Vb is the intercontact spark voltage
Vq is the voltage prior to the transient at the point of interest
As Vb and Vq are random variables, V(t, s) is also random. This equation can be used to estimate worst-case values (Fujimoto et al., 1988a).
The performance of a disconnector during an opening operation can be characterized by the pattern of arcing on a capacitive load (Figure 10.1). A difference in breakdown voltages for the two polarities indicates a dielectric asymmetry. When the asymmetry is large compared to the statistical variance in breakdown voltage, a systematic pattern is originated near the end of the arcing sequence (Boggs et al., 1984). The final trapped charge voltage has a distribution which is very dependent on the asymmetry in the intercontact breakdown voltage.
The dielectric asymmetry of a disconnector is usually a function of contact separation. A disconnector may show a different performance at different operating voltages. A consequence of this performance is that very different stresses will be originated as a result of different operational characteristics.
From the results presented in the literature, the following conclusions may be derived (Boggs et al., 1982, 1984; Fujimoto et al., 1988a; Yanabu et al., 1990):
• The value of the trapped charge is mainly dependent on the disconnect switch characteristics: The faster the switch, the greater the mean value that the trapped charge voltage can reach.
• For slow switches, the probability of a re-/prestrike with the greatest breakdown voltage, in the range 1.8–2 pu, is very small; however, due to the large number of re-/prestrikes that are produced with one operation, this probability should not always be neglected.
• The asymmetry of the intercontact breakdown voltage can also affect the trapped charge distribution; in general, both the magnitude and the range of values are reduced if there is a difference in the breakdown voltage of the gap for positive and negative values.
The results presented in Figures 10.7 and 10.8 illustrate the accuracy which can be obtained by means of a digital simulation. Figure 10.7 shows a good match between a direct measurement in an actual GIS and a computer result. The simulation was performed including the effects of spacers, flanges, elbows, and other hardware, but neglecting propagation losses (Witzmann, 1987). Figure 10.8 shows that important differences could occur when comparing a measurement and a digital simulation result, although a detailed representation of the GIS was considered. The differences were due to use of low damping equivalent circuits and to limitation of measuring instruments that did not capture very high frequencies (IEEE TF, 1996).
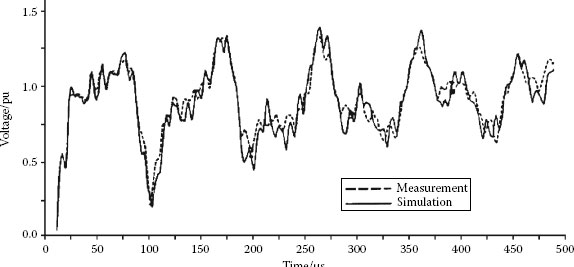
FIGURE 10.7 Comparison of simulation and measurement of disconnect switch–induced overvoltages in a 420 kV GIS. (Copyright 1999 IEEE.)
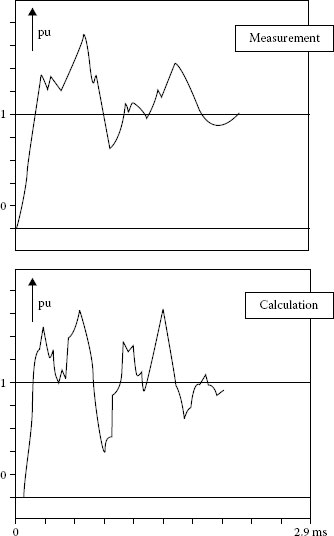
FIGURE 10.8 Measurement and simulation of overvoltages in a 420 kV GIS at closing a switch. (Copyright 1999 IEEE.)
Simulation results were also validated in many other works. Some of these works were aimed at developing models that could be useful for understanding the generation and propagation of VFT waves (Matsumura and Nitta, 1981; Dick et al., 1982; Murase et al., 1985; Ogawa et al., 1986; Fujimoto and Boggs, 1988; Yanabu et al, 1990; Okabe et al., 1991; Haznadar et al., 1992; Ardito et al., 1992; Miri and Stojkovic, 2001). In other works, the comparison of measurements and simulation results was aimed at testing some mitigation solutions (Narimatsu et al., 1981; Ozawa et al., 1986; Yoshida et al., 1986) or checking the features of a new design (Lopez-Roldan et al., 2001). Most of these works were useful for developing and confirming modeling guidelines.
10.4 Effects of VFT on Equipment
The level reached by VFT overvoltages originated by disconnector switching or line-to-ground faults inside a GIS is in general below the BIL of substation and external equipment (Boersma, 1987). However, aging of the insulation of external equipment due to frequent VFT must be considered. TEV is a low-energy phenomenon and it is not considered dangerous to humans; the main concern is in the danger of the surprise–shock effect. External transients can cause interference with or even damage to the substation control, protection, and other secondary equipment (Boersma, 1987; Meppelink et al., 1989). The main effects caused by VFT to equipment and the techniques that can be used to mitigate these effects are summarized next (CIGRE, 1988b).
Breakdown caused by VFT overvoltages is improbable in a well-designed GIS insulation system during normal operations. The breakdown probability increases with the frequency of the oscillations. In addition, breakdown values can be reduced by insulation irregularities such as edges and fissures. However, at ultrahigh voltage systems (e.g., more than 1000 kV), for which the ratio of BIL to the system voltage is lower, breakdown is more likely to be caused. At these levels, VFT overvoltages can be reduced by using resistor-fitted disconnectors (Yamagata et al., 1996).
Li and Wu (2007) propose the use of ferromagnetic rings to limit the stresses caused by VFT overvoltages. The rings can be mounted on the conductors linked to the disconnector from both sides to effectively limit both the steepness and the amplitudes of overvoltages. Using a frequency-domain approach, the authors analyze the high-frequency suppressing characteristics of different types of ferromagnetic materials and present guidelines for the selection of ferromagnetic rings.
Due to steep-fronted wave impulses, direct connected transformers can experience an extremely nonlinear voltage distribution along the high-voltage winding, connected to the oil–SF6 bushings, and high resonance voltages due to transient oscillations generated within the GIS. Transformers can generally withstand these stresses; however, in critical cases, it may be necessary to install varistors to protect tap changers.
10.4.3 Disconnectors and Breakers
The insulation system of breakers and switches is not endangered by VFT overvoltages generated in adjacent GIS equipment. Ground faults induced by VFT overvoltages have been observed in disconnectors’ operations, as residual leader branches can be activated by enhanced field gradient to ground. These faults can be avoided by a proper disconnector design.
10.4.4 Enclosure and Cable Interfaces
TEV can cause sparking across insulated flanges and to insulated busbars of CTs, and can puncture insulation that is intended to limit the spread of circulating currents within the enclosure. TEV can be minimized with a proper design and arrangement of substation masts, keeping ground leads as short and straight as possible in order to minimize the inductance, increasing the number of connections to ground, introducing shielding to prevent internally generated VFT from reaching the outside of the enclosure, and installing voltage limiting varistors where spacers must be employed.
Special measures for the protection of GIS–cable interfaces may be required when VFT originated by line-to-ground faults within the GIS are the triggering mechanism, since the power frequency follow-through current may damage the interface flange. Interface protection should prevent the formation of sparks and control the flow of the fault current, being the reduction of stray inductance the main goal (Fujimoto et al., 1988b). Spark gaps around the insulating flange are not a suitable solution; an increase of the flange insulation level and the use of MOVs are preferable.
Very few problems have been reported with capacitively graded bushings. High impedances in the connection of the last graded layer to the enclosure should be avoided.
TEV may interfere with secondary equipment or damage sensitive circuits by raising the housing potential if they are directly connected, or via cable shields to GIS enclosure by emitting free radiation which may induce currents and voltages in adjacent equipment. Correct cable connection procedures may minimize interference. The coupling of radiated energy may be reduced by mounting control cables closely along the enclosure supports and other grounded structures, grounding cable shields at both ends by leads as short as possible, or using optical coupling services. Voltage-limiting devices may have to be installed.
Ardito, A., Iorio, R., Santagostino, G., and Porrino, A., Accurate modeling of capacitively graded bushings for calculation of fast transient overvoltages in GIS, IEEE Trans. Power Delivery, 7, 1316–1327, 1992.
Arora, A., Becker, G., Boettger, L., Bolin, P., Hopkins, M., and Koch, H., Panel session on gas insulated switchgear and transmission lines, in Proc. IEEE PES General Meeting, San Francisco, CA, 2005.
Blahous, T. and Gysel, T., Mathematical investigation of the transient overvoltages during disconnector switching in GIS, IEEE Trans. Power Appar. Syst., 102, 3088–3097, 1983.
Boersma, R., Transient ground potential rises in gas-insulated substations with respect to earthing systems, Electra, 110, 47–54, 1987.
Boggs, S.A., Chu, F.Y., Fujimoto, N., Krenicky, A., Plessl, A., and Schlicht, D., Disconnect switch induced transients and trapped charge in gas-insulated substations, IEEE Trans. Power Appar. Syst., 101, 3593–3602, 1982.
Boggs, S.A., Fujimoto, N., Collod, M., and Thuries, E., The modeling of statistical operating parameters and the computation of operation-induced surge waveforms for GIS disconnectors, CIGRE Session, Paper No. 13–15, Paris, France, 1984.
Bolin, P., Gas-insulated substations, in Electric Power Substations Engineering, McDonald, J.D., Ed., CRC Press, 2nd edn., Boca Raton, FL, 2007, chap. 2.
Chowdhuri, P., Electromagnetic Transients in Power Systems, RSP-John Wiley, New York, 2nd edn., 2005, chap. 12.
CIGRE Joint WG 33/23-12, Insulation co-ordination of GIS: Return of experience, on site tests and diagnostic techniques, Electra, 176, 66–97, 1998.
CIGRE WG 33/13-09, Very fast transient phenomena associated with gas insulated substations, CIGRE Session, Paper 33-13, Paris, France, 1988a.
CIGRE WG 33/13-09, Monograph on GIS Very Fast Transient, CIGRE, 1988b.
CIGRE WG 33.02, Guidelines for representation of networks elements when calculating transients, CIGRE Brochure, 1990.
CIGRE WG 13.01, Applications of black box modelling to circuit breakers, Electra, 149, 40–71, 1993.
CIGRE WG 23.02, Report on the Second International Survey on High Voltage Gas Insulated Substations (GIS) Service Experience, CIGRE Brochure 150, 2000.
CIGRE WG B3.17, GIS State of the Art 2008, CIGRE Brochure 381, 2009.
Degeneff, R.C., Transient-voltage response, in Electric Power Transformer Engineering, Harlow, J.H., Ed., CRC Press, 2nd edn., Boca Raton, FL, 2007, chap. 20.
de León, F., Gómez, P., Martinez-Velasco, J.A., and Rioual, M., Transformers, in Power System Transients. Parameter Determination, Martinez-Velasco, J.A., Ed., CRC Press, Boca Raton, FL, 2009, chap. 4.
Dick, E.P., Fujimoto, N., Ford, G.L., and Harvey, S., Transient ground potential rise in gas-insulated substations—Problem identification and mitigation, IEEE Trans. Power Appar. Syst., 101, 3610–3619, 1982.
Dommel, H.W., EMTP Theory Book, Bonneville Power Administration, Portland, OR, 1996.
Ecklin, A., Schlicht, D., and Plessl, A., Overvoltages in GIS caused by the operation of isolators, in Surges in High-Voltage Networks, Ragaller, K., Ed., Plenum Press, New York, 1980, chap. 6.
Ford, G.L. and Geddes, L.A., Transient ground potential rise in gas insulated substations—Assessment of shock hazard, IEEE Trans. Power Appar. Syst., 101, 3620–3629, 1982.
Fujimoto, N. and Boggs, S.A., Characteristics of GIS disconnector-induced short risetime transients incident on externally connected power system components, IEEE Trans. Power Delivery, 3, 961–970, 1988.
Fujimoto, N., Chu, F.Y., Harvey, S.M., Ford, G.L., Boggs, S.A., Tahiliani, V.H., and Collod, M., Developments in improved reliability for gas-insulated substations, CIGRE Session, Paper No. 23-11, Paris, France, 1988a.
Fujimoto, N., Croall, S.J., and Foty, S.M., Techniques for the protection of gas-insulated substation to cable interfaces, IEEE Trans. Power Delivery, 3, 1650–1655, 1988b.
Fujimoto, N., Dick, E.P., Boggs, S.A., and Ford, G.L., Transient ground potential rise in gas-insulated substations—Experimental studies, IEEE Trans. Power Appar. Syst., 101, 3603–3609, 1982.
Fujimoto, N., Stuckless, H.A., and Boggs, S.A., Calculation of disconnector induced overvoltages in gas-insulated substations, in Gaseous Dielectrics IV, Christophorou, L.G. and Pace, M.O., Eds., Pergamon Press, Oxford, U.K., 1984.
Fujita, S., Shibuya, Y., and Ishii, M., Influence of VFT on shell-type transformer, IEEE Trans. Power Delivery, 22, 217–222, 2007.
Gorablenkow, J.M., Kynast, E.E., and Luehrmann, H.M., Switching of capacitive currents of disconnectors in gas-insulated substations, IEEE Trans. Power Appar. Syst., 103, 1363–1370, 1984.
Gustavsen, B., Wide band modeling of power transformers, IEEE Trans. Power Delivery, 19, 414–422, 2004.
Harrington, R.J. and El-Faham, M.M., Proposed methods to reduce transient sheath voltage rise in gas insulated substations, IEEE Trans. Power Appar. Syst., 104, 1199–1206, 1985.
Haznadar, Z., Carsimamovic, S., and Mahmutcehajic, R., More accurate modeling of gas insulated substation components in digital simulations of very fast electromagnetic transients, IEEE Trans. Power Delivery, 7, 434–441, 1992.
Hoshino, T., Kato, K., Hayakawa, N., and Okubo, H., Frequency characteristics of electromagnetic wave radiated from GIS apertures, IEEE Trans. Power Delivery, 16, 552–557, 2001.
Hosseini, S.M.H., Vakilian, M., and Gharehpetian, G.B., Comparison of transformer detailed models for fast and very fast transient studies, IEEE Trans. Power Delivery, 23, 733–741, 2008.
IEC 60071-1, Insulation Co-ordination—Part 1: Definitions, Principles and Rules, Ed. 8.0, 2006.
IEC 60071-2, Insulation Co-ordination—Part 2: Application Guide, Ed. 3.0, 1996.
IEEE Std C37.122-2010, IEEE Standard for High Voltage Gas-Insulated Substations Rated Above 52 kV. January 2011.
IEEE TF on Very Fast Transients (Povh, D., Chairman), Modelling and analysis guidelines for very fast transients, IEEE Trans. Power Delivery, 11, 2028–2035, 1996.
IEEE WG K9 of the Gas-Insulated Substations Subcommittee (IEEE Substation Committee), Bibliography of gas-insulated substations, IEEE Trans. Power Appar. Syst., 101, 4289–4315, 1982.
IEEE WG K9 of the Gas-Insulated Substations Subcommittee (IEEE Substation Committee), Addendum I to bibliography of gas-insulated substations, IEEE Trans. Power Delivery, 4, 1003–1020, 1989.
IEEE WG K9 of the Gas-Insulated Substations Subcommittee (IEEE Substation Committee), Addendum II to bibliography of gas-insulated substations, IEEE Trans. Power Delivery, 8, 73–82, 1993.
Ishikawa, M., Oh-hashi, N., Ogawa, Y., Ikeda, M., Miyamoto, H., and Shinagawa, J., An approach to the suppression of sheath surge induced by switching surges in a GIS/power cable connection system, IEEE Trans. Power Appar. Syst., 100, 528–538, 1981.
Kulkarni, S.V. and Khaparde, S.A., Transformer Engineering. Design and Practice, Marcel Dekker, New York, 2004, chap. 7. Surge Phenomena in Transformers, pp. 277–325.
Kynast, E.E. and Luehrmann, H.M., Switching of disconnectors in GIS. Laboratory and field tests, IEEE Trans. Power Appar. Syst., 104, 3143–3150, 1984.
Lalot, J., Sabot, A., Kieffer, J., and Rowe, S.W., Preventing earth faulting during switching of disconnectors in GIS including voltage transformers, IEEE Trans. Power Delivery, 1, 203–211, 1986.
Lee, C.H., Hsu, S.C., Hsi, P.H., and Chen, S.L., Transferring of VFTO from an EHV to MV system as observed in Taiwan’s no. 3 nuclear power plant, IEEE Trans. Power Delivery, 26, 1008–1016, 2011.
Li, Q. and Wu, M., Simulation method for the applications of ferromagnetic materials in suppressing high-frequency transients within GIS, IEEE Trans. Power Delivery, 22, 1628–1632, 2007.
Liang, G., Sun, H., Zhang, X., and Cui, X., Modeling of transformer windings under very fast transient overvoltages, IEEE Trans. Electromagn. Compat., 48, 621–627, 2006.
Lopez-Roldan, J., Irwin, T., Nurse, S., Ebden, C., and Hansson, J., Design, simulation and testing of an EHV metal-enclosed disconnector, IEEE Trans. Power Delivery, 16, 558–563, 2001.
Lui, C.Y. and Hiley, J., Computational study of very fast transients in GIS with special reference to effects of trapped charge and risetime on overvoltage amplitude, IEE Proc.-Gener. Transm. Distrib., 141, 485–490, 1994.
Martinez-Velasco, J.A. and Popov, M., Circuit breakers, in Power System Transients. Parameter Determination, Martinez-Velasco, J.A., Ed., CRC Press, Boca Raton, FL, 2009, chap. 7.
Matsumura, S. and Nitta, T., Surge propagation in gas insulated substation, IEEE Trans. Power Appar. Syst., 100, 3047–3054, 1981.
Meppelink, J., Diederich, K., Feser, K., and Pfaff, W., Very fast transients in GIS, IEEE Trans. Power Delivery, 4, 223–233, 1989.
Miri, A.M. and Binder, C., Investigation of transient phenomena in inner- and outer systems of GIS due to disconnector operation, in Proc. Int. Conf. Power Systems Transients, Lisbon, Portugal, 1995.
Miri, A.M. and Stojkovic, Z., Transient electromagnetic phenomena in the secondary circuits of voltage- and current transformers in GIS (measurements and calculations), IEEE Trans. Power Delivery, 16, 571–575, 2001.
Morched, A., Marti, L., and Ottevangers, J., A high frequency transformer model for the EMTP, IEEE Trans. Power Delivery, 8, 1615–1626, 1993.
Murase, H., Ohshima, I., Aoyagi, H., and Miwa, I., Measurement of transient voltages induced by disconnect switch operation, IEEE Trans. Power Appar. Syst., 104, 157–165, 1985.
Narimatsu, S., Yamaguchi, K., Nakano, S., and Maruyama, S., Interrupting performance of capacitive current by disconnecting switch for gas insulated switchgear, IEEE Trans. Power Appar. Syst., 100, 2726–2732, 1981.
Nishiwaki, S., Kanno, Y., Sato, S., Haginomori, E., Yamashita, S., and Yanabu, S., Ground fault by restriking surge of SF6 gas-insulated disconnecting switch and its synthetic tests, IEEE Trans. Power Appar. Syst., 102, 219–227, 1983.
Nishiwaki, S., Nojima, K., Tatara, S., Kosakada, M., Tanabe, N., and Yanabu, S., Electromagnetic interference with electronic apparatus by switching surges in GIS - Cable system, IEEE Trans. Power Delivery, 10, 739–746, 1995.
Ogawa, S., Haginomori, E., Nishiwaki, S., Yoshida, T., and Terasaka, K., Estimation of restriking transient overvoltage on disconnecting switch for GIS, IEEE Trans. Power Delivery, 1, 95–102, 1986.
Okabe, S., Kan, M., and Kouno, T., Analysis of surges measured at 550 kV substations, IEEE Trans. Power Delivery, 6, 1462–1468, 1991.
Osmokrovic, P., Krstic, S., Ljevak, M., and Novakovic, D., Influence of GIS parameters on the Toepler constant, IEEE Trans. Electr. Insul., 27, 214–220, 1992.
Ozawa, J., Yamagiwa, T., Hosokawa, M., Takeuchi, S., and Kozawa, H., Suppression of fast transient overvoltage during gas disconnector switching in GIS, IEEE Trans. Power Delivery, 1, 194–201, 1986.
Popov, M., van der Sluis, L., Paap, G.C., and De Herdt, H., Computation of very fast transient overvoltages in transformer windings, IEEE Trans. Power Delivery, 18, 1268, 2003.
Popov, M., van der Sluis, L., Smeets, R.P.P., and Lopez-Roldan, J., Analysis of very fast transients in layer-type transformer windings, IEEE Trans. Power Delivery, 22, 1268–1274, 2007.
Rao, M.M., Thomas, M.J., and Singh, B.P., Frequency characteristics of very fast transient currents in a 245-kV GIS, IEEE Trans. Power Delivery, 20, 2450–2457, 2005.
Rao, M.M., Thomas, M.J., and Singh, B.P., Transients induced on control cables and secondary circuit of instrument transformers in a GIS during switching operations, IEEE Trans. Power Delivery, 22, 1505–1513, 2007a.
Rao, M.M., Thomas, M.J., and Singh, B.P., Electromagnetic field emission from gas-to-air bushing in a GIS during switching operations, IEEE Trans. Electromagn. Compat., 49, 313–321, 2007b.
Rao, M.M., Thomas, M.J., and Singh, B.P., Shielding effectiveness of the gas-insulated bus duct for transient EM fields generated in a GIS during switching operations, IEEE Trans. Power Delivery, 23, 1946–1953, 2008.
Ryan, H.M., Application of gaseous insulants, in High Voltage Engineering and Testing, Ryan H.M., Ed., 2nd edn., The Institution of Electrical Engineers, London, U.K., 2001, chap. 3.
Shibuya, Y., Fujita, S., and Tamaki, E., Analysis of very fast transients in transformers, IEE Proc.-Gener. Transm. Distrib., 148, 377–383, 2001.
Shintemirov, A., Tang, W.H., and Wu, Q.H., A hybrid winding model of disc-type power transformers for frequency response analysis, IEEE Trans. Power Delivery, 24, 730–739, 2009.
Singha, S. and Joy Thomas, M., Very fast transient overvoltages in GIS with compressed SF6-N2 gas mixtures, IEEE Trans. Dielectr. Electr. Insul., 8, 658–664, 2001.
Singha, S. and Joy Thomas, M., Toepler’s spark law in a GIS with compressed SF6-N2 mixture, IEEE Trans. Dielectr. Electr. Insul., 10, 498–505, 2003.
Smeets, R.P.P., van der Linden, W.A., Achterkamp, M., Damstra, G.C., and de Meulemeester, E.M., Disconnector switching in GIS: Three-phase testing and phenomena, IEEE Trans. Power Delivery, 15, 122–127, 2000.
Thomas, D.E., Wiggins, C.M., Salas, T.M., Nickel, F.S., and Wright, S.E., Induced transients in substation cables: Measurements and models, IEEE Trans. Power Delivery, 9, 1861–1868, 1994.
Toda, H., Ozaki, Y., Miwa, I., Nishiwaki, S., Muruyama, Y., and Yanabu, S., Development of 800 kV gas-insulated switchgear, IEEE Trans. Power Delivery, 7, 316–323, 1992.
Vinod Kumar, V., Joy Thomas, M., and Naidu, M.S., Influence of switching conditions on the VFTO magnitudes in a GIS, IEEE Trans. Power Delivery, 16, 539–544, 2001.
Wiggins, C.M., Thomas, D.E., Nickel, F.S., Wright, S.E., and Salas, T.M., Transient electromagnetic interference in substations, IEEE Trans. Power Delivery, 9, 1869–1884, 1994.
Witzmann, R., Fast transients in gas insulated substations. Modelling of different GIS components, in Proc. 5th Int. Symp. HV Engineering, Braunschweig, Germany, 1987.
Yamagata, Y., Nakada, Y., Nojirna, K., Kosakada, M., Ozawa, J., and Ishigaki, I., Very fast transients in 1000 kV gas insulated switchgear, in Proc. IEEE Transm. Distrib. Conf., New Orleans, LA, 1999.
Yamagata, Y., Tanaka, K., Nishiwaki, S., Takahashi, N., Kokumai, T., Miwa, I., Komukai, T., and Imai, K., Suppression of VFT in 1100 kV GIS by adopting resistor-fitted disconnector, IEEE Trans. Power Delivery 11, 872–880, 1996.
Yanabu, S., Murase, H., Aoyagi, H., Okubo, H., and Kawaguchi, Y., Estimation of fast transient overvoltage in gas-insulated substation, IEEE Trans. Power Delivery, 5, 1875–1882, 1990.
Yoshida, T., Sakakibara, T., Terasaka, K., and Miwa, I., Distribution of induced grounding current in large-capacity GIS using multipoint grounding system, IEEE Trans. Power Delivery, 1, 120–127, 1986.