
Our customer for this chapter is a mid-sized professional services company, with several hundred consultants who work on projects at various large corporate clients. Most of the work they do is on a time and materials basis, with every consultant keeping careful track of the hours he or she has spent working on a project and submitting detailed weekly timesheets.
The customer’s timesheet system was developed in-house several years ago, and the primary issue with the system is that it has no flexible reporting features. To work around this problem, they have developed some ad-hoc solutions to connect to the application’s database and query the information. The business operations team is using several complex Excel spreadsheets that run queries against the database and supplements this information with manually captured information such as forecasts. Some of the project managers have also built queries to manage the hours that consultants are billing against their largest projects.
This has led to the following problems:
-
Lack of project information is leading to customer dissatisfaction. Because project managers don’t have a clear indication of how many hours consultants are billing until the invoice is ready to submit to the client, in many cases projects have been over budget because the project has not been closely managed.
-
With no standardized key business metrics and consistent categories, different teams are unable to agree on the current state. (Every meeting starts with the question “Where did you get that number from?.”)
-
The custom-built solutions need a lot of manual care and feeding especially around month ends, and this is mostly a burden on administrative staff that should be focusing on things such as sending out the bills on time.
We will consolidate the data from the timesheet system and other sources into a new SQL Server data warehouse, and use Reporting Services to deliver predesigned reports. Users can access the reports from the intranet either on-demand using a Web browser or subscribe to the reports so that relevant reports are e-mailed to them automatically when the data is ready.
The high-level business requirements to support the objectives are as follows:
-
Managing projects. Each project that this company undertakes has a budget that is agreed up front with the customer. Project managers need up-to-date weekly reports so that they can ensure that the project is delivered within budget, which will increase customer satisfaction and lead to the most profitable type of work, namely contract extensions and repeat business. Also, project managers must ensure that they are on target to hit the planned budget by the end of the project, to ensure that the services business meets its forecasted revenue.
-
Managing utilization. All consultants have target utilization levels that they must meet for the business to succeed. Consultants and their managers need to see up-to-date information on their utilization levels so that they can take action early enough to hit their goals.
-
Managing the business. The business operations team needs access to strategic business measures so that they can report monthly information to management. They urgently require information on billed revenue versus planned revenue, utilization, average billing rates (ABR), sales pipeline, and backlog, with a need for more measures in following phases of the project.
The solution has two main components: the data warehouse database and the reporting server to publish reports. We will be loading the data from the timesheet system on a periodic basis using Integration Services, and the data warehouse will also include information from other sources such as forecasting spreadsheets. The reporting server will run Reporting Services, which is essentially an ASP.NET application and web service.
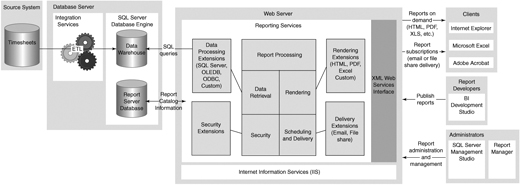
Unlike older client/server reporting environments that require a client application to be installed on every machine, Reporting Services is a server-based reporting solution, as shown in Figure 6-1. One way to understand this approach is by comparison with ordinary Web development. For regular Web applications, HTML and ASP files are created using a designer and then published to a Web server, which then executes any server instructions in the files and serves up the resulting information to client machines’ Web browsers. Similarly for Reporting Services, reports are designed using a graphical designer such as the report designer in BI Development Studio, and then published to the reporting server. When a request for a report is received by Reporting Services, the reporting server then retrieves any data required and renders the results for display on the client.
Users can access reports using a Web browser and can also export reports into other Office applications such as Excel to work with the numbers, or export to printable formats such as PDF. Although Reporting Services is designed so that reports can be integrated into other applications such as intranet portals (see the sidebar “Integrating Reports into Other Web Sites or Applications”), we will be using the Report Manager Web-based application that ships with SQL Server. It provides all the features we need, such as browsing a list of reports and securing reports for specific audiences.
Building standardized reports against a properly architected data warehouse has many advantages and is usually the best solution for the long-term information requirements of a client. The solution can be extended in future iterations to include information from more data sources in the data warehouse or to provide information in more flexible ways for users or applications that require it.
Typically for this kind of solution, we would suggest building an Analysis Services database and then writing reports against the cubes as described in Chapter 9, “Scorecards.” However, because this customer doesn’t have any experience with building or managing Analysis Services databases, we focus on providing some high business-value reports against the relational data warehouse and leave the more flexible Analysis Services approach for a follow-up phase.
One option that is often popular with clients is to build reports directly against the existing application database, under the mistaken assumption that by skipping the step of building the data warehouse they could drastically reduce the cost for the project. Unfortunately, it’s never that simple—one issue is that the time to develop even the initial set of reports would be increased quite considerably because the report developer would need to deal with the complexities of the normalized OLTP schema, which would increase the cost of the report development section of the project. This cost increase would also be ongoing, because every report developed in the future would face the same issue. Any changes to the underlying source system may affect the reports rather than just affecting a clearly defined interface between the source system and the data warehouse.
Also, the information required to make sensible decisions about a business is rarely contained within a single application; in this case, forecasting numbers and sales targets are located in various spreadsheets and can’t be included. And most important of all, report queries typically reference large amounts of data, and because OLTP databases are typically optimized for single-row writes and not multi-row reads (as discussed in early chapters), the performance impact on the timesheet system is likely to be too great. (Although it’s difficult to give good impact estimates for this kind of question when pressed, the best answer is usually the standard BI consultant’s response: “It depends.”)
The solution will deliver the following benefits to the client:
-
Increase customer satisfaction, because of better project management leading to more projects that are delivered within budget
-
Decrease administrative costs by automating time-consuming manual business operations reporting
-
Increase revenue by enabling consultants and their managers to plan to meet their utilization targets
As described in previous chapters, we will approach the data modeling for this project by first looking for dimensions. There is nothing really unusual about the Time dimension for the services business, so we will be using the standard structure and start by asking some questions about the business.
The obvious place to start for this model is with the people doing the work—consultants and project managers. In the professional services business, the reality is a little more complex (different types of consultants, engagement managers as well as project managers, people managers, sales executives, administrative staff), but these are just extensions to the simpler model we are looking at.
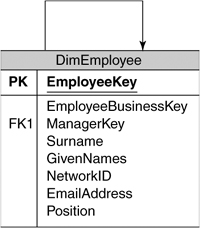
We could take the approach of having separate Project Manager and Consultant dimensions, but because people can change positions over time, it seems more natural to model this as an Employee dimension, with each employee having a position such as consultant. On a related note, because consultants can change to project managers over time, we need to be careful here that we don’t lose the capability to analyze history by overwriting an employee’s position—this is a complex topic usually handed by a technique called slowly changing dimensions (SCDs), which is so common that we have written a whole chapter on it—see Chapter 8, “Managing Changing Data.”
The other attributes for the Employee dimension are the usual ones such as Name (see Figure 6-2), but we also want to include the employee’s network user ID so that report content can be tailored to the individual user (described in “Giving Users What They Want” in the “Technical Solution” section). We can also include their e-mail address so that reports can be e-mailed to them. The other interesting aspect is the Reports To relationship—employees have managers who are also employees. This is an example of a self-referencing dimension (called a Parent/Child dimension in Analysis Services).
TIP:
Avoid Object-Oriented Designs in a Data Warehouse
Those of us with a strong object-oriented design (OOD) background may be tempted to model the Employee structure using an inheritance-like structure rather than a star or snowflake design; that is, with an Employee base table and two specialized Project Manager and Consultant tables. Although there are occasions when this type of design is appropriate (usually in OLTP systems where it matches up well with the application code), this approach is usually not appropriate for a DW because of the complex ETL that results, as well as the performance impact.
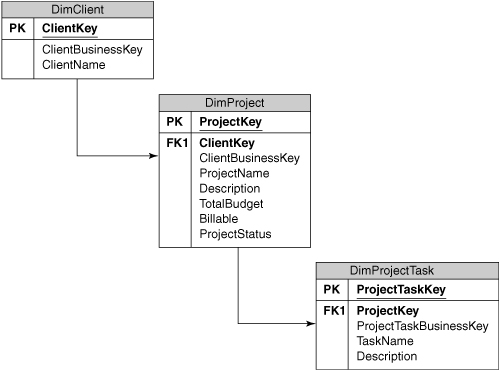
We know that there is ultimately a client paying the bills, so this is an obvious candidate dimension, but because there may be multiple projects for a client each with its own attributes such as start dates, project manager, and budget, we will also include a separate Project dimension, as shown in Figure 6-3. We will also keep a list of the major Project Tasks, which is useful for project analysis to understand which areas of a project are going over budget.
One area of complexity is billing rates. Consultants will have different standard billing rates depending on their position, and may even be allocated to projects at different positions than their employee record suggests (such as assigning a senior consultant to a project at a lower consultant-level rate). The current rate information needs to be stored in the timesheet system, but it’s debatable whether this information makes it into the data warehouse in that format. What we are really interested in is how much money we actually charged the customer for the work and the average billing rates over time, not what the current standard rates are. One exception to this is when services businesses are interested in finding out which employees are not billing at their standard rates—this could be modeled by either adding a standard hourly and overtime rate to the Employee table based on their position, or by creating a separate Resource table that links a specific employee to a specific project along with the agreed rates.
The professional services business is built on a simple principle—hours billed means money earned. The central fact table to measure the business’ performance has a record with the hours billed and the revenue earned for every piece of work that a consultant performs on a project, with a key of Time, Employee, and Project Task, as shown in Figure 6-4.
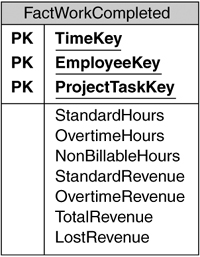
Because hours can be translated directly to revenue by applying the appropriate rate, OLTP systems would usually only store the hours and calculate the revenue on demand; in a data warehouse, however, this would miss the opportunity to have well-performing fully additive measures that are stored directly in the database. We can also extend the columns to enable interesting analysis on all kinds of measures, such as overtime revenue versus standard revenue, or billable hours versus nonbillable (such as administrative time that consultants spend on tasks like filling in timesheets).
The business requirements for this solution make frequent reference to utilization, which shows how much billable time an employee has spent as a percentage of the total time available for the month. In practice, the “available time” is often not as simple as multiplying the working days for the month by eight hours—what about vacation, for example? If the employee’s vacation is not included in the total available time for the year, a consultant can achieve 100 percent utilization for the month just by taking a month off. On the other hand, if vacation is included, an incentive exists for employees to manage their vacation time so that they don’t lower their utilization for an important period such as the last month before year-end. A simple approach may be to use 52 standard 40-hour weeks for all the available time and adjust the consultants’ percentage utilization targets to match.
Also, utilization is a percentage, so we won’t store this in the fact table because it is not additive. Because this business only looks at utilization at a month level, the total hours available are stored on each Month record, and utilization can be computed easily by summing the billable hours from the fact table and dividing by the total for the selected periods.
Although the Work Completed fact table is crucial for understanding the business, trying to manage using only measures of the past is like trying to navigate using your rear-view mirror: At some point, forward-looking measures will be required. In the services business, these measures are typically called something like delivery backlog and sales pipeline.
The delivery backlog is the work that has been sold but that hasn’t been delivered yet, and gives us measures of how busy our consultants will be in the near future, as well as how much money we will be making. The sales pipeline is information on potential future sales. Because we can’t be sure that these sales will actually get signed (and become part of the backlog), there is a probability percentage assigned to each possible sale, which is increased according to business rules as the sales process progresses and is used to adjust the expected revenue measure.
Both of the preceding are “moving targets” in the sense that the business will need to see how the numbers progress over time. (“What was our sales pipeline at the end of this month compared with the same period last year?”) The fact tables shown in Figure 6-5 are both snapshots, where we load all the records at the end of a period, which represents the current view. We can see historical views by selecting prior periods, but because these are snapshots, we cannot add the numbers across time periods. (For example, there is no sense in looking at the total of sales pipeline for January, February, and March because we will triple-count any potential sale that was in all three periods.) This is a clear example of a fact table with “semi-additive” measures, which add up across any dimension except Time in this case.

Now that we know what kind of information we are using, we can move on to building the solution.
We are focusing on developing the reporting piece for this solution, so we have already implemented the data model and loaded the data warehouse database (ProfessionalServicesDB) following the guidelines and best practices we presented in previous chapters (if only it was that easy in the real world!).
We start by using the BI Development Studio to create a new Report Project. The project will be created in a folder on your development machine and will contain a set of Report Definition Language (RDL) files, which will eventually be published to the reporting server.
The BI Development Studio includes a Report Wizard to walk you through the steps for defining a report, which consist of the following:
-
Selecting a data source.
-
Defining the query that will be executed.
-
Selecting the layout, fields, and groups.
-
Choosing a style for the report.
The resulting RDL report design files are based on XML and are usually edited using the graphical report designer. This designer enables you to graphically define the query and then drag-and-drop fields onto a design surface to build the report. Because you are working locally with the report files and have not yet published them to a report server, the designer also includes a Preview pane where you can run the report and view the results directly in the development studio.
QUICK START: Designing a Report
Now that you have some background on the BI Development Studio, we can walk through the steps to develop the first report for the customer’s solution, which is a Project List. We will be using the Report Project Wizard, which walks you through the steps to create a project, data source, and a single simple report:
-
Open the Business Intelligence Development Studio.
-
Select New Project from the File menu, and choose Report Server Project Wizard from the Business Intelligence Projects subfolder.
-
Name the project ProfServicesReports and click OK. Click Next to skip the first page.
-
On the Select the Data Source page, click the Edit button to specify the connection information.
-
Type the name of your database server (or localhost if you are working on a single machine), select Use Windows Authentication, and select the ProfessionalServicesDW database from the list of database names. Then click OK.
-
Check the “Make this a shared data source” check box, and then click Next.
-
For the Query string on the Design the Query page, type
SELECT * FROM Project. Click Next. -
On the Select the Report Type page, choose Tabular and then click Next.
-
Select all the fields on the Design the Table page and click the Details button to add them to the report. Click Next.
-
Select Slate on the Choose the Table Style page and click Next.
-
The Choose the Deployment Location page allows you to specify the location of your Reporting Services server where the reports will eventually be published. If you are working on a single machine, you can leave the default settings; otherwise, you need to modify the report server URL. For example, if your server is named MyServer, type http://MyServer/ReportServer. Click Next.
-
On the final page, type Project List as the name of the report and click Finish (see Figure 6-6).

The wizard creates the report project files, including the shared data source and Project List report, and opens the report in the report designer. You can adjust the design of the report on the Layout tab, modify the query on the Data tab, or use the Preview tab to see the report with data.
TIP:
Use Shared Data Sources
Every report needs a data source that defines the database connection information, including the name of the database server and the credentials that will be used to connect. Although you can define this information separately for each report, a much better option is to use a shared data source. Doing so enables you to define the database connections to be used for the entire project, which will be referenced by the individual reports. The advantage of this approach is that you can change the connection information for all the reports in a single location, which proves useful, for example, when you move from development to production servers.
Many reports need some form of calculation logic, such as subtotals or percentages. You have two choices about where to perform these calculations: either as part of the SQL query or stored procedure that provides the source data for the report or using Reporting Services expressions.
Expressions are based on VB.NET syntax, so some knowledge of this language is always helpful, but not mandatory. One of the most common uses for expressions in reports is to add information such as page numbers or execution time to reports. To add a page number to the bottom of report, turn on the page footer by selecting Page Footer from the Report menu, and drag and drop a text box control from the toolbox into the section. Right-click the text box and choose Expression to show the expression editor.
In addition to being able to display the current values of fields or parameters, some global variables are available, including the page number and total pages in the report. If you select PageNumber from the Globals section in the expression editor, you will see that it adds the expression =Globals!PageNumber. You could also use string concatenation and multiple variables in an expression. For example, to display “Page 3 of 10” at the bottom of the report, use the following expression:
="Page " + Globals!PageNumber.ToString() + " of " +
Globals!TotalPages.ToString()
Notice that because we are concatenating strings and numbers, we had to convert the page numbers to strings using the ToString() syntax.
When you have finished developing the report in this section, you can publish the project by selecting Deploy Solution from the Build menu. The report will be available to users when we have configured the security in a later section.
When you deploy a solution from Visual Studio, the reports and data sources are published to the server that you initially specified in the Report Project Wizard. You can change this server using the project properties dialog (select Properties from the Project menu), which allows you to specify the URL for your report server and also the name of the folder to publish the files into. Because you may be deploying to a server that has different source databases than your development environment, you can also choose not to overwrite any data sources that have already been set up on the server by making sure the OverwriteDataSources setting is false.
As mentioned in the “High-Level Architecture” section, end users will be using the Report Manager Web-based tool to access reports. Now that we have published the reports, it would be a good idea to get familiar with this tool.
To use Report Manager, open a Web browser and navigate to http://MyServer/Reports, where MyServer is the name of your report server. Reports on the server are grouped into folders, such as a ProfServicesReports folder for the project that you just deployed. Click this folder to view the list of reports and data sources. To run a report, click the link and it will be executed and displayed in the browser, as shown in Figure 6-7.
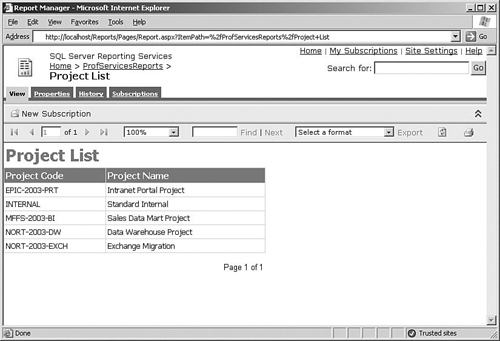
The report displays in HTML format initially, but users can select another format and click Export to view the report in Excel, Acrobat (PDF), CSV (comma-delimited), or even XML. Users can also print the report using the Print button on the toolbar, which uses an ActiveX control downloaded to the computer when the user first selects this option. All printing happens on the client machine itself because there is no facility to print directly from the server.
Now that we have completed a simple report and seen how the user will ultimately access the reports, we can move on to developing some of the more complex reports for the solution. The report that we have looked at so far has just presented a list of information to the user, but most reports are usually targeted to the individual user’s needs.
The most common approach to handling this is to add parameters to the report. When users run the report, they are prompted to specify some values for the parameters, which are then used to limit the data that is displayed.
QUICK START: Adding Parameters to a Report
Project managers who will use our solution need a report that shows a summary of all the projects they are responsible for, so we will build a new parameterized Project Summary report. The report will be based on an SQL query that includes a parameter, @PMKey. We will then add an additional data set to the report that lists all the project managers so that we can present a list to the user:
-
Open the BI Development Studio, and then open the ProfServicesReports project that you created in the previous Quick Start.
-
Right-click the Reports folder in the Solution Explorer on the right side and select Add New Report.
-
Follow through the wizard as before, but for the query specify
SELECT * FROM ProjectSummary WHERE ProjectManagerKey = @PMKey. -
If you preview the report now, you will notice that you are prompted to enter a numeric value for PMKey. Enter a value such as 9 to view the data.
-
To present a list of project managers instead of requiring the user to type a value, we need to specify a new query for a list of project managers. Select the Data tab and choose <New Dataset> from the Dataset list.
-
Name the query ProjectManagersList, and for the query specify
SELECT * FROM DimEmployee. Click OK. Run the query using the ! button to see the results. -
On the Report menu, select Report Parameters.
-
Change the prompt from PMKey to Project Manager, as shown in Figure 6-8.
-
Under Available values, select From query, and then select the Project Managers dataset from the list.
-
For the Value field, select EmployeeKey—this will be used to supply a numeric value to the @PMKey SQL parameter.
-
For the Label field, select FullName—this will be used to build the list for the user. Click OK, and then preview the report to see the results.

Another approach to tailoring report content is to use the user’s network ID to retrieve data specific to the user. For example, the Project Summary report could retrieve the network ID of the user who is running the report using the User!UserID expression as the default value of a parameter, and then display the relevant information. For this to work correctly, you need to have a column in the Employee table that maps an employee’s record in the database to the employee’s network ID, such as MYDOMAIN/JSMITH, where MYDOMAIN is the name of your domain.
With the huge amount of information available in most companies today, most reporting solutions need to include ways of summarizing information and allowing the user to learn more information as required. The reports in our Professional Services solution achieve this by presenting summarized information and using other report formats or providing drilldown to show more detailed information.
One of the most common ways of presenting summary information is to add groups and subtotals to a report, as shown in Figure 6-9. Detailed report data can be grouped by fields in the report, such as client name or month, or by more complex expressions that you define. For calculating subtotals, Reporting Services expressions can include functions such as Sum, Avg, Min, or Max, which can be used with numeric fields and added to the grouped row. You can also include more complex calculations such as running totals or row numbers using the RunningValue and RowNumber functions.
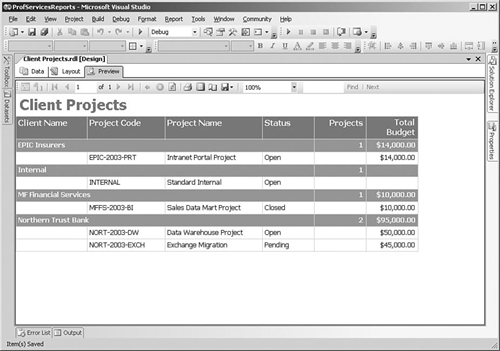
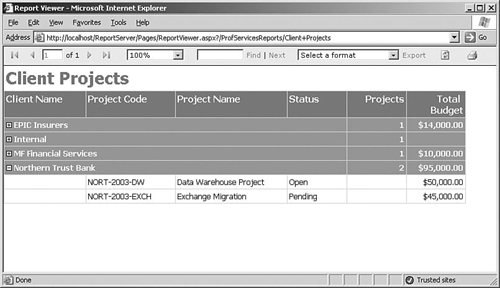
For example, because our solution includes some clients with many projects, we will design a Client Projects report that shows a list of projects by client, along with a subtotal of the current project budgets. The report expression to calculate the sum of projects for a client would be =Sum(Fields!TotalBudget.Value).
Groups are really easy to achieve in Reporting Services: If you are using the wizard to create a report, you can specify that the Client Name field is a separate Group rather than in the Details with everything else. If you miss this step in the Report Wizard, you can create a group within a table by selecting the Detail row in a report table, right-clicking and choosing Insert Group. You can then drop the columns that you want into the new group header—the designer is smart enough to specify a sum expression if you drop numeric fields such as the project budget into a Group section.
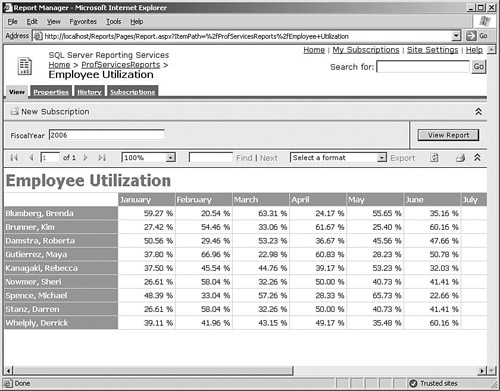
The reports that we have looked at so far have all been based on table layouts, each with a fixed set of columns. Many of the reports in our solution are time based and show performance over time, so it would be useful to be able to show one or more columns for each month in a report. Reporting Services supports this kind of reporting using a report item called a Matrix, which can include column groups as well as just row groups.
We can use a Matrix report to build the Employee Utilization report that shows utilization percentages over the months of a fiscal year, as shown in Figure 6-10. Managers can use this to track the performance of the consultants that report to them. Matrix reports can be created either by selecting the Matrix report type in the Report Wizard or by opening a report and dragging a Matrix on to the report, and then dropping appropriate fields into the Rows, Columns, and Data areas.
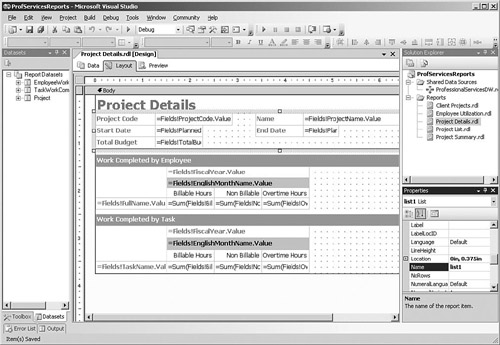
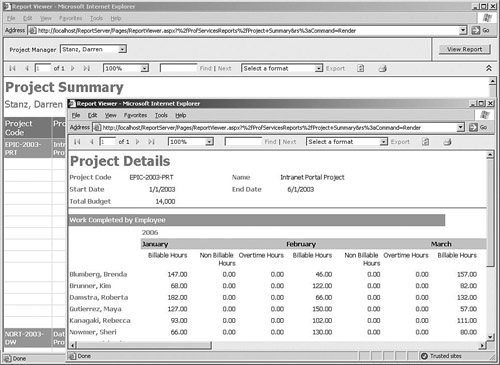
Reports also often need to include information that is not arranged in either tables or matrices. The List report item is used for reports that have flexible layouts, such as order reports that have a free-format header section containing customer information, then a table containing all the order details. The Project Details report is an example of this kind of report; the project information fields such as name, start date, and total budget are at the top of the page along with captions, and there are also two matrices containing work completed by employee and task, as shown in Figure 6-11. To create this type of report, drop a List item onto the report, and then drop fields and text boxes in the List area.
Finally, reports can also include Chart report items, which support a wide range of common chart types such as pie, bar, and line. The chart also supports multiple series, so you can build some fairly sophisticated charts.
To avoid swamping users with long, multi-page reports, we can also design reports so that they present a short summary of the information to the user when they initially view the report, and then they can click links in the report to drill down to see more information. The Client Projects grouped report that we built previously would end up displaying a large amount of information. So instead of just showing a list of projects with subtotals, we could initially just show a list of clients along with a total of their current project budgets, and then allow the user to click the client name to see the breakout of individual projects, as shown in Figure 6-12.
To implement this, first we need to define a group on Client Name, which will be the summary level for our report. To specify that the details of each client’s projects are hidden at first and then displayed when the user clicks a client name, select the Details row in the table and then look in the Properties window for the Visibility section. Specify a Hidden value of True to hide the details section initially, and then for ToggleItem, select the field that you want the user to click (in this case, the Client Name field). This idea is applied all over the place in Reporting Services and is a powerful way to show the user what they want.
Another approach to dealing with presenting large amounts of information is to show the user a summary report that contains hyperlinks that launch a separate report with the detailed information—this approach is known as drillthrough. For example, project managers who are using the Project Summary report that we built earlier will need to be able to run a Project Details report that prompts for a specific project and shows detailed information such as the hours that consultants have billed to the project, remaining budget, and tasks completed, as shown in Figure 6-13.
To set up the hyperlink, open the Project Summary report that we built in the previous Quick Start and right-click the Project Code field to open the Properties dialog, and go to the Navigation tab. If you select the Jump to Report radio button, you will be able to select the Project Details report and also specify that the Project Key field value should be used for the ProjectKey parameter for this report.
The users of the professional services reporting solution can be categorized into three groups—consultants, project managers, and business operations staff. Each of these groups needs different information, and we would like to prevent some users from seeing certain information. For example, consultants should be able to see their own utilization and billing performance, but not the performance of their colleagues. Managers, on the other hand, should be able to see the utilization of all consultants that report to them.
Restricting access to information is a common requirement in most reporting solutions, and Reporting Services has a flexible model to support it. In addition to controlling who can access a report, Reporting Services also allows administrators to control who can perform tasks such as uploading new reports. Permissions can be granted at a folder level rather than just individual reports, for example, so that you can allow users in a specified Windows group to access all reports in a folder.
For our solution, we start by creating three Windows groups and adding the Windows accounts of the users to the appropriate groups. Most users can see all the reports, so with Report Manager, we will open the Properties for the report folder and add all three groups with the Browser role. This will set the default security for all reports in the folder, and then we can override the security settings for specific reports, such as removing the Consultants group from the Business Operations reports.
One specific requirement for our solution is that consultants can only see their own utilization report. We could just build two separate reports, one report that only managers could see that contains a parameter to allow any consultant to be selected, and another report that uses the User!UserID expression to only display the user’s own utilization. However, Reporting Services includes a feature called Linked Reports that we can use for this requirement without having to build and maintain two separate reports. These have a link to an existing underlying report, but can hide parameters and supply specific parameter values, as well as have a different set of security permissions than the original report.
We can start by creating a Utilization by Consultant report with a parameter that presents a list of consultants but defaults to the current user’s record. In Report Manager on the Properties tab for this report, click the Create a Linked Report button. You can change the name to something like My Utilization and click OK, and the new linked report will display. You can then change the parameters for the linked report by unselecting the Prompt User check box so that the user is not prompted to select a consultant for the My Utilization linked report.
Finally, secure the reports by only permitting members of the Manager role to view the Utilization by Consultant report but allowing all three groups to view the My Utilization report. Managers will then be able to choose any consultant for the report using the parameter, but everyone else will only be able to see his or her own utilization.
Now that we have secured the reports for our solution, we can move on to the topic that generally has the most effect on performance and scalability for reporting: controlling how and when the source databases are accessed.
At some point before a report can be displayed for a user, Reporting Services connects to the data source and executes the queries required for the report. When you create a new data source, Windows integrated security is used by default, which means that the credentials of the user running the report are used to access the database. However, if the source database is on a separate server, Kerberos will need to be enabled to allow the user’s credentials to be passed from the reporting server to the database server. (Talk to your friendly network administrator for more information on this topic.) Unlike client/server applications, Web applications usually avoid this approach of using the user’s credentials to access the database, because this means that connection pooling is ineffective and expensive database connections cannot be reused.
The most common approach is to use Windows security to restrict users’ permission to access the reports, as described in the previous section, and then use specific credentials to allow the reporting server to access databases. These credentials are stored securely on the reporting server (meaning they are encrypted and can only be read by the Reporting Services service) and consist of either a Windows username and password or a SQL Server username/password. We will be using a specially created Windows account for our reporting solution that has the minimum possible permissions required to access the database. You must avoid using powerful accounts such as administrator-level Windows accounts or the SQL Server sa account for this purpose.
If users always require the most up-to-date information, report queries need to be executed every time a user views a report. This can place a huge burden on database servers and is not usually a recipe for scalability. Most reports don’t require data to be quite so current, especially when those reports are built on a data warehouse that is only updated periodically. You can get a lot of performance improvement by turning on report caching using the Report Manager execution properties for the report. This caches a format-neutral combination of the data and report layout, so the same cached data can be used whether the user requests the report in HTML or any other format.
The cached information can be set to expire either after a specified number of minutes or by using a schedule (for example, to expire caches every night). If a report uses parameters, a separate cache is created for every combination of parameter values that is used. One problem with the caching approach is that the first user who requests the report must wait while the data is fetched, whereas all subsequent users who request the same report and parameter values get the benefit of caching.
To avoid this problem, Reporting Services enables you to control when the queries are executed using snapshots, which are executed at a specific time and cache the resulting data. These settings are also controlled using execution properties in Report Manager. This is useful in data warehouse scenarios because we can schedule the report snapshots to be created after the nightly batch processing. Multiple snapshots can also be stored so that a history is created, and the user can easily see how the report looked at some time in the past.
A few caveats apply to snapshots, however. Because the report is not executed by a user, any parameters defined for the report will use the default values. Also, for both cached and snapshot reports, credentials to access the database must be stored with the data source. You can work around the default parameter issue by defining separate linked reports for every parameter combination that you want to cache, but, of course, this approach is limited to specific types of reports.
Most users really like the idea of having some reports e-mailed to them on a regular basis, especially now that so many people manage their whole life through their inbox. Reporting Services allows users to set up their own subscriptions using Report Manager and also enables administrators to set up a data-driven subscription that sends reports to a whole list of users, with the parameters set up so that relevant information is e-mailed.
QUICK START: Subscribing to a Report
The Project Summary report that we created earlier is a great candidate for a subscription because the content is tailored to a specific project manager. Before we can set up a subscription to the report, we need to change the data source so that the credentials used to access the database are stored:
-
In Report Manager, select the data source.
-
Under the Connect Using section, select the Credentials stored securely in the report server radio button.
-
Specify a Windows username and password that has access to the database. You could also use a SQL Server login instead.
-
If you specified a Windows account in Step 3, check the Use as Windows credentials check box.
-
Click Apply, and then open the Project Summary report.
-
If you have followed the preceding steps to store the credentials, you should now see a New Subscription button for the report. Click this button.
-
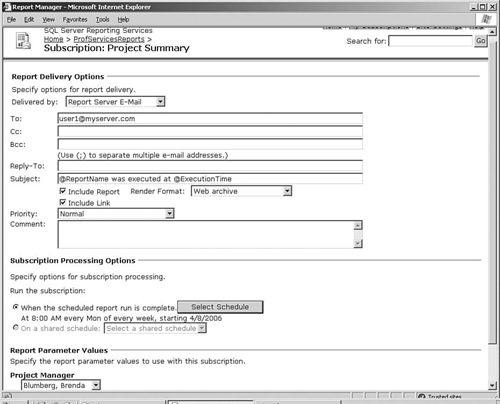
Specify the e-mail address to send the report to in the To section, as shown in Figure 6-14. (Note that if you don’t see Report Server E-Mail as an option in the Delivered By section, you probably did not set an SMTP server when you installed Reporting Services. To fix this, search Books Online for the “Configuring a Report Server for E-Mail Delivery” section.)
-
Set the render format that you would like to receive as an attachment to the e-mail, such as PDF or Web Archive.
-
Set up a schedule to e-mail the subscription, such as 8 a.m. every Monday.
-
Select a value for the Project Manager parameter.
-
Click OK.
TIP:
Testing Subscriptions
Unless you want to wait until next Monday to see whether the subscription works the way you want it to, it helps to know something about how Reporting Services handles scheduling. A SQL Server Agent job is created for the subscription, named with a GUID that is used by Reporting Services to keep track of the job. Right-click the job in SQL Server Management Studio and choose Start Job, which will trigger the start of the subscription processing. In Report Manager, you can go to the Subscriptions tab for the report and refresh the view a few times to see how it proceeds.
In our solution, we probably don’t want to make each project manager set up his own subscription, so we can use a data-driven subscription for this report. This is created using the New Data-driven Subscription button on the Subscriptions tab for the report. We have already defined an EmailAddress column in the Employees table in the data warehouse, which will come in handy now because the Data-Driven Subscription Wizard allows you to specify a query that is executed to produce a list of e-mail addresses to send the report to. Also, for the Project Manager parameter, you can use the EmployeeKey column in the same table, so that each project manager receives a tailored report. We can use the same approach to e-mail consultants their personal utilization report every month.
We can also make the business operations team blissfully happy using a subscription with the File Share delivery extension. Nothing makes a financial person happier than a nice, up-to-date Excel spreadsheet that appears in his or her network folder every week. This type of subscription can be set up in the same way as the e-mail subscription above, so you can use a data-driven subscription that executes a query to determine information such as a list of network locations to write reports to. This is also commonly used for financial reports that show a current position, because you can set up the subscription to use a different filename for each file that uses the current date. Over time, this will produce an archive of files that show the changing positions.
So far, we have been using the Web-based Report Manager tool both for viewing reports and for management purposes such as setting up report properties and security. Report Manager is a convenient management tool if you are managing one report server at a time over a Web connection, but otherwise you can use SQL Server Management Studio to connect to report servers and manage all aspects of your BI solutions (including database, Analysis Services, Integration Services, and Reporting Services) from within one tool.
As described in the “High-Level Architecture” section, we will be using separate report and database servers. Deploying Reporting Services is similar to deploying many ASP.NET applications. You need to configure the server as an application server and enable IIS and ASP.NET.
The database server has no special requirements; the ReportServer and ReportServerTempDB databases are created when you set up Reporting Services. To deploy the reports and data sources that you have created, you can use the BI Development Studio as we have already described. If you want to create a repeatable, easy-to-deploy package containing all the reports and data sources to be deployed to production, however, unfortunately it is not going to be as easy as the Analysis Services or Integration Services deployment wizards.
Currently, no tool enables you to package up a report solution for deployment. If you can’t use BI Development Studio because you want something that an operations team can use, you will have to get them to either deploy the report files one at a time using Report Manager or SQL Server Management Studio. Alternatively, you can write a custom script to deploy the solution following the techniques in the PublishSampleReports.rss script that ships as a sample with Reporting Services. You can execute scripts using the rs command-line utility, for example:
rs -i PublishSampleReports.rss -s
http://myserver/reportserver -v parentFolder="Professional
Services Reports"
After the initial euphoria from a user community accustomed to struggling to get information has worn off, it is likely that they will quickly come up with requests for changes in the form of new reports that present the information in different ways, or request new measures to understand different areas of the business.
Using the Visual Studio report designer, you can easily add new reports or modify existing ones, and then publish them to the server. Because the operations staff may have modified the data source connection information, the OverwriteDataSources project setting is useful as it allows developers to redeploy report projects without overwriting data sources.
In a production system, however, the usual approach is for the developers to publish their changes to a test server, which are then deployed to the production reporting server, as described in the “Deployment” section.
Publishing a set of standard reports usually has the most benefit to an organization when the solution is initially deployed. In the long run, requests for minor changes, which will inevitably accumulate from the user community, can quickly drive the cost of the solution up beyond the point where any real return on investment is possible. The most practical answer to this problem is to introduce some form of “self-service” reporting and analysis after the initial standardizing of reports. This could take the form of building Analysis Services cubes to enable users to use tools such as Excel to analyze their information or using the end-user reporting features of Report Builder.
Mission critical is a term usually associated with line-of-business systems such as payroll and ERP. When users become accustomed to easy access to information through a reporting solution, however, there will be a lot of pressure on operations teams to ensure that the system is reliable. In addition to the usual operations tasks associated with servers and databases, a few additional areas are required for reporting solutions.
This is a common issue that operations staff must address. Reports could start taking a long time to complete for various reasons, such as an increased load on the source database server or an increase in the amount of data for a report. The best approach is to set sensible timeouts on the server or specific reports so that Reporting Services can automatically cancel any reports that are taking too long to complete.
Alternatively, administrators can see which jobs are running and cancel them if necessary using the Manage Jobs section under Site Settings in Report Manager, or the Jobs folder in SQL Server Management Studio. However, reports are usually waiting for the data source to return data, so a common approach is to cancel the long-running query on the database server.
Backing up a Reporting Services solution covers several areas. First, all the catalog information such as reports, security settings, and snapshots are stored in the ReportServer SQL Server database. This database needs to be backed up using standard SQL Server backups, along with the ReportServerTempDB database. Second, because all configuration information such as database connection strings is stored in an encrypted format in the ReportServer database, you need to back up the encryption keys for your server using the rskeymgmt utility.
Finally, the report projects and solution files that you used to develop the reports also need to be backed up. The best approach for this is to use a source control solution such as Visual Studio Team System’s version control or SourceSafe.
In this solution for professional services, we focused mainly on solving the most important business need, which was tracking the resource utilization. Other areas that we would need to add in future iterations would probably include tracking customer satisfaction, which is one of the most important metrics because it is a great predictor of likely future revenue. The business operations side of professional services also needs information on cost factors such as travel and expenses to be able to manage the business successfully. These measures would all prove useful for analytical purposes, too (for example, tracking trends and breaking down costs), so an Analysis Services cube is another likely addition to the solution.
In our solution, we managed to implement all the required calculations using a combination of SQL and Reporting Services expressions. Some reports will need more than that; for example, your reports may require complex mathematical or financial calculations. You can achieve this in Reporting Services by adding a reference to a .NET assembly containing your code, and then call this assembly from report expressions. Also, if you need to reuse the same code fragment a few times in a report, you can add custom VB.NET functions to the report that can be called from expressions. See “Using Custom Assemblies with Reports” in Books Online for more information.
Many of the users of the information in the data warehouse will be “power users” who would benefit from the capability to create their own queries and reports. Report Builder is a simple, Microsoft Office-like report design tool that allows users to connect to a user-friendly view of the data called a report model. You can design a report model in BI Development Studio using the Report Model project type, using either the relational data warehouse or an Analysis Services database as the source.
One possible approach for the professional services solution is to create an Analysis Services database that could be accessed by the user’s client tool of choice, and then create a report model from this Analysis Services database for those users who want to use Report Builder to create custom reports. You can easily generate a report model by creating a new reporting folder using Report Manager or SQL Server Management Studio, adding a data source that points to the Analysis Services cube, and then clicking the Generate Model button or context menu item on the data source. This creates a new report model in that reporting folder, and users can immediately launch Report Builder using the button on the Report Manager toolbar.
One area that will be important in many solutions is localization, or providing the same report in multiple languages. This area involves a few complexities, such as whether just report captions need to be language specific, or data such as product names also needs to be localized. One simple solution to this problem is just to rewrite the report for different languages and provide the correct reports to different audiences. This may not work well where you have a large number of reports that often need to be modified, because you will be maintaining more than one copy.
When a user views a report, the browser passes the user’s preferred language to the server; this can be accessed in a report expression using the User!Language syntax. You can localize data and captions by using this language as a parameter to either SQL queries or a .NET assembly referenced in the report. Another powerful technique often used to localize .NET applications is using resource files. Because Reporting Services will correctly set the language of the thread used to process a report, you can build .NET assemblies that use the ResourceManager class to return the appropriate string for a specified key. See the MSDN documentation on localizing applications for more information.