
Chapter 2
Getting Started
Unless the distant goals of meaning, greatness and destiny are addressed we cannot make an intelligent decision about what to do tomorrow morning—much less set strategy for a company.
—Peter Koestenbaum
The foundation of every company is composed of three fundamental elements: (1) vision, (2) brand, and (3) culture (VBC). Without clarity and consensus on VBC, there is no basis on which to make strategic plans or decisions, much less apply analytics. If you don’t know your company’s VBC, the obvious analytic question is: Analyze for what purpose?
Peter Koestenbaum, philosopher, educator, and executive coach, went further in talking about the essentials of an organization. VBC are operational examples of Koestenbaum’s distant goals. Some companies simply go from problem to problem without being clear about their vision, brand, or culture. Those firms gain minimal market share and suffer from mediocre earnings. They are what Tom Peters once called “the living dead.”1 In time they will be bought or driven out.
If you are thinking of analyzing and improving any human capital issue, you would be well served to have clarity on your company’s VBC. If you cannot readily see the impact of VBC on a company, consider the example of four well-known retailers and how they are different: Neiman Marcus, Macy’s, Walmart and Costco.
GO-TO-MARKET MODELS
If you study the market position of these four retailers along five basic strategies, you can see the differences. Consider how they go to market in terms of prices, quality, service, operations, and innovation. This becomes abundantly clear when you do a competitive analysis, as displayed in Exhibit 2.1. Look at the three levels under each of those variables.
Exhibit 2.1 Go-to-Market Models
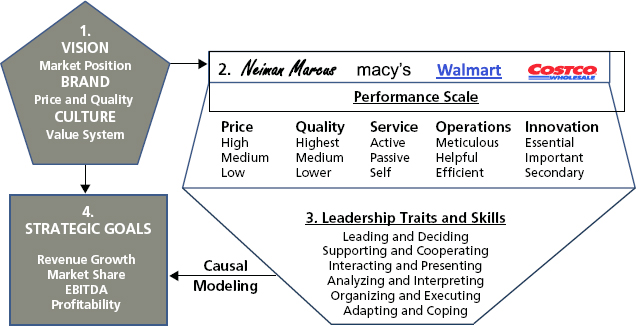
Wouldn’t you agree that Neiman Marcus positions itself at the top level across the five variables? You might also agree that Macy’s takes the second level. Walmart and Costco are primarily along the bottom level with some minor exceptions. Those differentiating positions did not just appear by themselves. They are being driven by their respective VBCs.
The VBCs set the strategy for the market positions, which then require certain required leadership traits and skills. Clearly, leading in a company like Neiman Marcus is different from leading at Walmart. The end goal is the same: to improve operations and customer service. But in order to be successful, the type of leadership must reflect the type of customers and the type of employees attracted to different retailers. This is an important point for people who are developing leadership systems. Buying off-the-shelf packages and installing them without regard to the VBCs and go-to-market strategies is frankly a waste of time and money.
Analytics comes into play when you attempt to link your leadership model to the organization’s strategic goals. Exhibit 2.1 implies that leadership traits and skills are derived from the go-to-market model of the company. Causal modeling connects the appropriate leadership skills with the goals around issues such as revenue, market share, profitability, and earnings before interest, taxes, depreciation, and amortization. It will show you how different traits and skills need to be developed and supported given the specific and unique financial goals of the company.
ASSESSMENT
Organizations often engage assessment vendors to identify the desired leadership factors. This is where some assessors stop. They show you the problem but do not offer specific solutions.
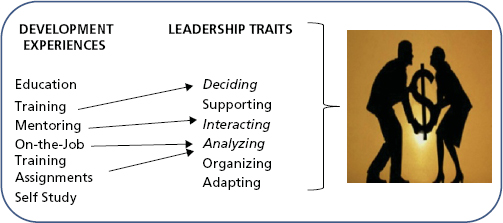
That is only the lesser half of the problem. More important, the company has to develop the desired leadership factors through various methods. Exhibit 2.2 is an example of how various developmental methods could be applied to a given set of leadership skill needs.
Exhibit 2.2 Leadership Development
DEVELOPMENTAL EXPERIENCES
In your development tool kit, you have a number of methods for helping people learn and grow. Developmental tools are the resources you apply to the individual skill and knowledge gaps that assessments have exposed. On the left side of Exhibit 2.2 are various developmental experiences. To the right you see the assessment scores. Italics signify skill deficiencies. The arrows depict the application of various experiences to assessment results.
For example, if there are deficiencies around decision making, you might give those people a model to study or a course to attend. Interaction deficiencies might be dealt with through mentoring. Analysis and creativity could be improved through some focused on-the-job training and through special assignments. The point is to match your development resources with the assessed deficiencies. One-type-fits-all leadership models are a terrible misuse of time and resources.
Current research is showing that quite often development blankets are thrown over everyone, regardless of their various levels of need. Conversely, analytic work, such as the Nick Bontis model in Chapter 1, has shown that the strongest correlate of effective training is the recipients’ feeling of their need to know. Absent that, the training investment is almost totally wasted, as is the productivity lost when people leave their jobs to attend the class.
FINANCIAL CONNECTIONS
Exhibit 2.3 is a human capital income statement (HCI$) developed by Jeff Higgins at Human Capital Management Institute. This is a sample of the broad monetizing of leadership. The Talent Management Impact side connects with the financial metrics on the Workforce Productivity Impact side. The HCI$ is receiving significant support from the financial community through publications and presentations by CFO magazine. We’ve highlighted just one section that shows relationships between leadership and revenue, profits, human capital productivity, and total cost of workforce (TCOW). This system will show how your leadership programs are positively affecting business outcomes.
Exhibit 2.3 Human Capital Income Statement (HCI$)
Source: Used with permission. Jeff Higgins, CEO, Human Capital Management Institute.

The typical client’s initial reaction to the HCI$ is: “We could never collect that data.” The second is: “We wouldn’t know what to do with it if we had it.” It reminds us of the story of an elderly lady who went to a doctor to cure her backache. After a thorough examination, he told her she had two herniated disks. His prescription alternative was to have surgery, to which she said emphatically, “NO.” “Okay,” he replied, “you can have an epidural shot.” Again she said, “NO.” He sat back, took a deep breath, and asked, “Well then, why are you here?” When people don’t want a solution, why do they ask for one?
In the case just mentioned, someone within the group invariably challenges the first objection by pointing out that actually their human resources (HR) services already produce most of the raw data, but they simply have not organized them this way. Even if some is initially missing, you can go a long way toward monetizing development programs with this model. We handle the second concern through a couple of days of training. It is not rocket science. The base is accounting logic. This leading-edge model just requires a commitment to monetize the human capital side. If you do a very good job of front-end analysis, you may be able to carry the process through to causal relationships, which is the ultimate objective.
SAMPLE CASE
We’ve been engaged with another major retailer that is attempting a radical transformation of its VBCs. Top management believes it is necessary in order to meet what it sees as changing customer expectations. This is a change in the fundamentals of the company. Management has decided what has to change and in what new direction it wants to take the company. This is now leading to a change process that includes a communications program for employees. This program is essential if the company wants the people to engage and become a part of the transformation rather than a hindrance. Transformations of a large company can take three years or more. Predictive analysis can greatly improve the efficiency of the change initiatives, because it identifies the most effective paths to change.
FOCUSING ON THE PURPOSE
Your organization may not be planning a system-wide transformation. Assume for the sake of example that you want to tackle that attrition issue we mentioned in Chapter 1. The question is: For what purpose? It is obvious that reducing unwanted attrition is a good idea. But there is more to it than that. We started by using Branham’s seven reasons for employee disengagement. Let’s assume that we were able to answer at least some of the seven reasons:
- What is the total attrition rate?
- Which types of people are leaving?
- When in their career are they leaving?
- Why are they leaving?
Once we have the answers, what else do we need to know? Of course, we want to uncover the effects of attrition. We need to know how we can influence attrition and for what purpose? It is not just to cut the percentage loss down. In short, what is the business value of knowing? Herein lies the purpose of analytics: generating knowledge to add value. Knowing that some percentage or ratio has changed does not necessarily add value. Reducing the attrition rate by 2% or increasing the engagement score by 4% means nothing until we apply those improvements to improving operations, reducing costs, or increasing revenue.
We cannot emphasize strongly enough how important front-end questioning is. Chapter 1 made that pointedly clear, we hope. Unless you are certain about the nature of the issue you want to tackle, the odds of your contributing value are extremely low. We recommend that you spend much of your time at the beginning of any project cutting through obfuscations, bias, ignorance, recalcitrance, and all those other wonderful human traits to locate verifiable, testable connections. The payoff will be well worth your time.
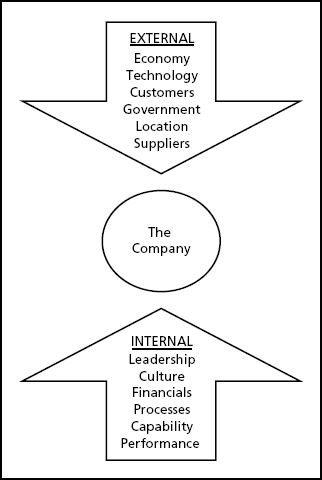
Quite often important organizational issues are complicated and multifaceted. There is more going on than one can see on the surface. This is why analytics is important: It can unravel the hidden connections. People, processes, resources, customer demands, new laws and regulations, even weather and geography can be part of the cause. When problems are simple, usually they can be solved within the unit by supervisors or managers. It is only when problems have multiple causes that analytics come into the picture. Once more from the top: Spend time on questioning before you ever start firing solutions at the issue. What are the principal drivers internally and externally in your company? (See Exhibit 2.4.)
Exhibit 2.4 Force Analysis
PRESENT-DAY NEEDS
Where is your organization today on the analytics path? The path proceeds along several stepping-stones from simple and familiar to complex and, for most people, alien and untried. In Chapter 1 we described the process of analytics from the simple to the complex, from anecdotes to optimization, to wit:
- Anecdotal accounts and reminiscences
- Dashboards and scorecards
- Comparisons and benchmarks
- Coincidences and correlations
- Causational data
- Predictive analyses
- Optimization
Things to think about before you start are:
- Where is your organization today along this path?
- More importantly, where do you want to go?
- How fast can you afford to travel?
- Do you have the resources at hand to start or continue the trip?
- If not, what will it take to obtain them?
These may seem daunting at present, but you will have a lot of company if you start. According to an Institute for Corporate Productivity (i4cp) 2012 survey, 81% of companies queried claimed that analytics will be important activities for them within five years.2 This book will support you along the path and provide the how-to if you are willing to attempt the trip.
HOW HUMAN CAPITAL ANALYTICS IS BEING USED
There are several uses for analytics from simple gathering of facts to effective adaptations to market changes. Davenport, Harris, and Shapiro listed six ways that human capital analytics are currently being applied.3
- Selecting and monitoring key indicators of organizational health
- Identifying which units or individuals need attention
- Determining which actions have the greatest impact on the bottom line
- Forecasting workforce levels
- Learning why people choose to stay or leave the organization
- How to adapt the workforce to changes in the business environment
The bottom line is that management needs tools and analytic skills to solve new, complex business problems more rapidly than in the past. The intensity of competition is increasing. The need to react quickly is imperative. Human capital analytics supplies the demand for better investment decisions.
TURNING DATA INTO INFORMATION
Practitioners claim that their biggest challenge is gathering the data necessary to do analysis. Closely following that is how to turn their human capital data into practical, actionable information and eventually intelligence. The primary reason for these hurdles is that probably 75% of HR departments don’t even have truly useful, basic metrics regarding their operation. Since they don’t have a history of data collection, standard definitions and ongoing monitoring, it is a giant leap to analytics. However, we have a solution for that. It is called learning as you go. In Chapters 4 through 6, you will learn about metrics and statistical applications. Between here and there, we will show you how to build an infrastructure into which the numbers can be placed. So, let’s start.
THREE VALUE PATHS
Analytics can be applied to any of three value objectives. They are:
- Solve a problem. Pick some low-hanging fruit to improve some aspect of operations. Getting a quick hit can be useful for several reasons.
- You are adding some degree of value.
- You are building credibility.
- It is giving you a first step along the path to greater value, such as identifying high-performance variables that set up a training program curriculum.
- Form an analytics unit. You, or top management, may decide that the organization could benefit from the intelligence that an analytics function could generate. You could research how and learn from this book what to do to organize a predictive analytics function. You can learn what skills and characteristics are useful for staffing an analytics function by talking to others who have gone before or by reading on in this tome.
- Develop an analytics culture. Transforming an organization’s decision-making culture is not an easy task. To be truthful, it may not be possible in your present state. You would need the full support of the C-level team members who practice analytics among themselves, as well as insist that subordinates do likewise. We suggest that, initially, you focus on the first two value paths described above rather than take on this challenge. In time, given the support required and the evidence of value added from your work, you might be able to begin a shift toward an analytics culture.
SOLVING A PROBLEM
The first and most conventional option is simply to solve a given problem. The solution is usually the result of someone in the upper echelons asking or demanding a solution to something that bothers him or her. As we mentioned, the most common topic is attrition. Workforce planning follows close behind. Recently we asked an audience how many people had applied predictive analytics to attrition problems. About 20% raised their hands. Then we asked how many had applied predictive analytics to other topics. Only a few hands went up, and most of those later stated that they were working on some aspect of planning. The reason for this concentration is that attrition and planning are much easier to attack than something as complex as the performance management system.
ESSENTIAL STEP
No matter which path you take, even the easiest, it is very important to enlist support before you start a project. There are many ways to spend your time and resources, and you don’t want to waste them attempting something that will not be supported. Your direct boss may have no objection to spending resources on analytics. However, due to lack of organizational power or expertise, he or she might not be your prime advocate. You may need to find strong support from an executive outside of your organization. If questions or objections arise, you want to have a person with power on your side. Having support can be very useful when reporting later to a senior group and you run into skepticism and resistance. When an executive from within the peer group supports you, it no longer is an HR project; instead, it is an organizational problem you plan to solve. We’ll address this in more detail in Chapter 3.
PRIME QUESTION
Probably the first question you want to ask yourself or your group is: What is the most important organizational problem/opportunity that we currently are capable of attacking? Sometimes analysts go after issues that are of interest to them but find later that no one else cares. We all have favorite topics that stimulate us intellectually or vex us more than others. But it can be that in the eyes of management, those topics are not as interesting or as important as something else.
So, put yourself in the place of someone you want to impress or with whom you want to improve your relationship. What interests them and, as important, do other senior people agree with them? How do you learn the answer to those questions? People talk or write about issues that are most important to them. Who is your target person/group? What do you see or hear them discussing? Do they seem to be very concerned about costs, customers, revenue growth, market share, process efficiency, or acquiring and retaining certain types of talent? Can you find out what is driving that? Problems don’t just happen. Something causes them. You need to know or to find out through analysis what the causes are. In the end, you may not have the power to solve the problem, but through analysis, you may be able to prove to them the root cause of their discomfort. Then, through prescriptive analysis, you might be able to show them the path to the solution.
CASE IN POINT
Here is an example of how to get to the root cause of an organizational problem that had to do with talent but was not an HR problem. We were called in to help a large technology organization learn why it was consistently unable to deliver major products on time and on budget. Through surveying and interviewing, it became clear that sourcing and developing program managers were at the heart of the dilemma. We hypothesized that effective program management correlated with time to market. Although the company’s records were incomplete at best, we were able to apply statistical modeling to identify three key variables that connected with project success. The data showed links among leadership, integrity, and decisiveness, and effective project management. The problem was not HR’s inability to provide the needed talent. There was a historic organizational policy regarding where and how the company would source talent. Clearly, this policy was not producing the skills needed. Once management had unequivocal data at hand, it had no recourse other than to free HR to do its job properly.
Sometimes you set out to solve a problem and your analysis takes you in another direction. That is a major side benefit of analytics. It identifies hidden organizational problems that can otherwise plague an enterprise and suboptimize attempts to improve performance. It is more than aspirin that temporarily reduces the fever.
PREPARING FOR AN ANALYTICS UNIT
The formation of analytics units today is driven about 65% of the time by senior management and 35% of the time by the chief human resources officer (CHRO). The basis for this statement is simple observation. While many CHROs are jumping into this new swimming pool, in many other cases they are being pushed into it by someone at the top of the organization. It doesn’t matter where the impetus comes from, but it does have an effect on the allocation of resources.
If the idea comes from within HR, the CHRO has to come up with the resources. When it comes from the top, a commitment of resources normally comes with it. Assuming that there is a budget to support the design of the unit, the build-out is rather straightforward.
Let’s take the easy one first. That would be when top management decides it needs an analytic unit. In that case, you don’t have to sell the concept. But you do have to deliver what management has in mind. One of the best examples of this is the case from a major financial institution wherein the C level was dissatisfied with the reports of the HR function. HR had a so-called analytics unit of about 15 people. In practice, it was more of a reactive report-generating function that scrambled to respond to line manager needs for data. In addition, HR focused on reported things such as:
- Number of employees
- Number of people hired
- Number of people trained
- Turnover rates
- Compensation and benefits costs
- HR department expenses
- HR department staff
Management’s complaint was that this was not actionable data except for the consideration of possibly cutting back on the HR department’s staff and budget.
The solution was to bring in a financial person from one of the divisions and give her the mandate to study important talent-based operating issues. Within a year, the unit was reduced from 15 to 10 people, and everyone was put through statistical analysis training at SAS. During that reorganization, it was recognized that some people did not have the aptitude for this new work, and they were reassigned elsewhere in the company.
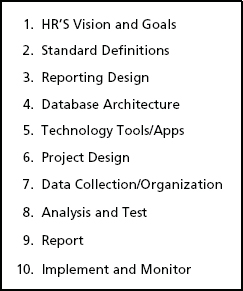
The plan for the reorganization included ten steps as shown in Exhibit 2.5.
Exhibit 2.5 Analytics Unit Development
TEN STEPS FOR AN ANALYTICS UNIT
Here are ten steps taken to reorganize the analytics unit within an HR department to make its output more useful to business leaders:
- Although management had provided a mandate, the details of organization were left up to the new director of analytics. As a former operating and financial person, she came at the job from a company rather than an HR department perspective. Reflecting on management’s mandate, she formulated a vision for the new analytics unit and set some short- and long-term goals.
- She realized that to promote clarity and consistency, the unit and the company needed to operate from a set of standard terms and metrics. It took several months internally and externally to reach a quasi-consensus on terminology.
- The company had been using an unexamined set of regular reports for many years. The rationale for their format and content needed updating. Again, this took a good bit of negotiating. Whether formats and reporting schedules are useful or not, people become accustomed to them. In time, a testable set of reports was designed and cleared with their readers.
- Once it became clear what data would be needed, the HR database architecture had to be established. Clearly, if operating issues were going to be addressed, the analytics unit would have to access data from finance, marketing, and other functions. Systems analysts and coders were put to work to develop a flexible, mutually beneficial architecture.
- Future manipulation of operating and talent data depended on some new technology tools and applications. Money had to be committed to acquire the analytic tools. This was part of the operating budget that the director developed and passed by top management.
- After this new infrastructure was put in place, the unit was able to swing into full production. Agreement was reached with the C level as to what and when the regular reports would start to emerge. Remember that quite new information was going to appear. This demanded more than a little design work. Along with regular reports, new analytics projects were launched.
- At this point, the unit was in nearly full operation, albeit still working out the new processes and products. Trial and error gradually settled on a new organizational format and data collection methodology.
- The first products appeared and underwent analysis and tests, both internally and with the external users.
- At this point, a new and unanticipated problem appeared. Line managers had been accustomed to simply putting in requests for reports and waiting for delivery. The new director wanted to change the analytics unit from a continually reporting mill to an operational intelligence resource. This took a lot of selling. A year later, some stubborn managers still were not convinced that times had changed. The analytics unit offered continuous analytics and report training to the line managers so that they could become independent. At last check, this too was still a tough sell to some stubborn users.
- Two years after inception, the analytics unit was fully functioning and is currently providing the C level with actionable operating data. The unit is investigating the utility and efficiency of various systems, such as sourcing strategies, performance management, and leadership development. In addition, it continues to monitor ongoing reporting for improvement opportunities and the value of new report formats and data.
STRUCTURE AND TEAM BUILDING
The structure of the analytic team needs to fit with the culture and structure of your organization. It is important to position the function within the organization in a way that allows you to hire, train, grow, and retain the talent you need. There are several ways to structure and position a function. It can be centralized, decentralized, or some variation thereof that suits the vision, brand, and culture of the organization.
But before you fret about structure, you need to concentrate on the people and the activities. Without the right people, structure will not matter. The number one issue is getting the kind of people who not only can handle statistics but also have the interest and intuitive skills to go beyond the analysis. It is very important that the task excite them. You need people who can look at data and see patterns. Not many can do that.
DEVELOPING AN ANALYTICS CULTURE
If you want a career project, developing an analytics culture undoubtedly is it. Established routines and cultural mores are embedded in concrete. I (Jac) remember a conversation in 1980 with Bob Galvin, son of the founder of Motorola and then the largest stockholder as well as current chief executive officer and chairman of the board.
Galvin was one of the finest gentlemen and best executives it was ever my privilege to know. Despite all his power and the respect he garnered from his employees, he told me that changing the culture of the company was the most difficult challenge he had ever faced. He said it had already taken him nearly six years to move the company from paternalism to participation. One must understand that within corporate cultures, there are deeply entrenched power bases, unquestioned systems and processes, taboos, and rituals often going back decades. Cultural change is a true test for transformation.
Very few organizations make decisions based on thoroughly considered objective deliberations and unbiased facts. Books have been written about corporate cultures and how rigid they usually become. If you want to tackle this challenge, call us, and we will spend a good portion of the rest of our time introducing predictive analytics into your corporate culture.