
Chapter 1
Where’s the Value?
Our only security is our ability to change.
—John Lilly
In a famous 1984 TV commercial, 82-year-old actress Clara Peller looks at a huge hamburger bun overwhelming a tiny meat patty and mutters the now-iconic phrase in her raspy voice, “Where’s the beef?” It is the same question asked today by nonstatisticians. In our new world of Big Data and outrageously fast computers, many of us feel overwhelmed. When the numerati speak effusively about the power of analytics, laypeople roll their eyes. Without a graduate degree in statistical analysis, and especially in predictive analytics, the average person feels woefully ignorant, powerless, blind, and lost. Paradoxically, analytics is logical and understandable. It is simply a method for letting computers apply their power of manipulation to expose valuable insights. This book will take you step by step from the desire to analyze data to a comprehensible, actionable result and on to a view of the future of human resource analytics. In the end, you will find the beef.
SOME BASICS
There are at least two ways of solving problems. The most common one is simply to attack it head on and hope for the best. This is similar to dealing with a pesky mosquito. You feel it on your arm and you swat it. This is a simple, highly effective reaction. The only apparent consequence is perhaps a little blood spot. But if there is more than one mosquito, you have to do it over and over. More important, mosquitoes often carry diseases, such as West Nile virus and malaria. More than 600,000 people die every year from malaria. If you were going to be in an area where mosquitoes are a menace, you would want to do something more than swat them when they land on you, right? This brings us to the second method for solving problems: analysis and prevention. If mosquitoes are more than a nuisance, you would prepare for them by protecting yourself with repellent and covering most exposed skin, wouldn’t you?
So it is with organizational management. If your modus operandi is to continually swat problems as they appear, you waste time and resources by repeatedly dealing with the same problem. You seldom make progress. There is another alternative that will avoid costly, redundant investment of scarce resources. The better way is to invest a little time in analyzing the problem before you act. If you gather data on what has happened (descriptive analysis), analyze it in terms of why it happened and what will likely continue if untreated (predictive analysis), and then design a treatment for fixing it, most likely you will eliminate a recurrence of the problem (prescriptive analysis). This is the efficient way to manage. It also frees you to concentrate on being effective—that is, doing something that advances the organization. With this approach, you will have time to focus on building a better future rather than endlessly repeating the past.
WHAT IS ANALYTICS?
Arguably the most practical tool and greatest potential for organizational management is the emergence of predictive analytics. Analytics is a meeting of art and science. The arts teach us how to look at the world. The sciences teach us how to do something. When you say “analytics,” people immediately think of statistics. That is incorrect. Statistics play a major role, but only after we understand something about the interactions, the relationships, of the problem’s elements. Analytics is first a mental framework, a logistical progression, and second a set of statistical operations.
Human resources (HR) or human capital analytics is primarily a communications device. It brings together data from disparate sources, such as surveys, records, and operations, to paint a cohesive, actionable picture of current conditions and likely futures. This is an evidence-based approach to making better decisions. This popular term is simply the gathering of primarily objective facts and secondarily related subjective data. Analytics is divided into three levels:
- Descriptive. Traditional HR metrics are largely efficiency metrics (turnover rate, time to fill, cost of hire, number hired and trained, etc.). The primary focus here is on cost reduction and process improvement. Descriptive HR analytics reveal and describe relationships and current and historical data patterns. This is the foundation of your analytics effort. It includes, for example, dashboards and scorecards; workforce segmentation; data mining for basic patterns; and periodic reports.
- Predictive. Predictive analysis covers a variety of techniques (statistics, modeling, data mining) that use current and historical facts to make predictions about the future. It’s about probabilities and potential impact. It involves, for example, models used for increasing the probability of selecting the right people to hire, train, and promote.
- Prescriptive. Prescriptive analytics goes beyond predictions and outlines decision options and workforce optimization. It is used to analyze complex data to predict outcomes, provide decision options, and show alternative business impacts. It involves, for example, models used for understanding how alternative learning investments impact the bottom line (rare in HR).
The process starts with the simple reporting of HR metrics and goes all the way up to prescriptive modeling of business practices. Although financial capital (cash) and economic capital (intangible assets) are the lifeblood of a business, it is human capital (people) that apply cash and leverage intangible assets to drive business performance. As you move from descriptive to prescriptive, the value add grows exponentially.
The fundamental management question is: How do we manage talent more effectively? Human behavior is much more complex and less predictable than tangible assets. This volatility and capriciousness has diverted many managers to focus on more stable assets. Yet physical assets like equipment are inert and inherently incapable of adding value. Only when a human being works with the tools does value flow. In the market of the twenty-first century, people simply cannot be relegated to anecdotal methodologies. Thomas Edison borrowed a phrase from Sir Joshua Reynolds that put the problem rather directly:
TWO VALUES
The purpose of analytics is to find the best path through a mass of data to uncover hidden value. Value comes in two forms: financial and economic. There is a distinct difference between these forms initially, yet they eventually coalesce. Economic data includes practical, noncash significant items or processes affecting material resources. Examples include market reputation, customer satisfaction, best companies to work for, and community relations. These are often referred to as off–balance sheet assets. Each of them eventually should turn into financial value as stockholders invest in company stock, customers purchase products or services, high-performing personnel seek employment with the organization, and favorable community support ensues. Financial value examples are cash and other liquid resources such as stock and bonds. These are recorded on the income statement and balance sheet, the building blocks of accounting.
ANALYTIC CAPABILITIES
Data can be viewed two ways: structured and unstructured. Structured data is similar to financial data, and unstructured data typically is economic or less tangible data. Analytics and data intersect, as seen in Exhibit 1.1. Since the arrival of the industrial revolution 200 years ago, we have focused on structured data: costs, process time cycles, and quantities. Yet, according to IBM, at least 80% of the data currently being produced is unstructured, nonnumeric images, text, and audio. As social networking continues its explosive growth, the percentage of unstructured data will necessarily expand. In practice, structured and unstructured data can be merged into a mixture, amalgam, or fusion. In short, it will be what some now call hybrid data. While hybrid data will be essential for future analysis, it will also make the process much more complicated.
Exhibit 1.1 Analytic Paths
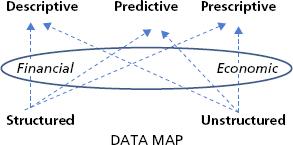
This is precisely why analysis is essential. When a situation is a complex mixture of objective facts and subjective beliefs, there is no way other than through logical inquiry and statistical treatment for us to comprehend what is not readily apparent.
Excuse the effort for making this point again, but analysis has its genesis in descriptive data that tells us what has happened up to the present. But prediction and prescription are concerned with what can or preferably could happen and how to make it happen. All three levels are necessary. Throughout the twentieth century, we took descriptive data and mentally extrapolated it into the future through presumed trends. This was somewhat acceptable when the market was stable. However, today and tomorrow the market is anything but stable. Therefore, prediction is vitally necessary for any company that desires to sustain or grow market share and profitability in the new millennium. Not-for-profit organizations need it even more, because so much of their “business” involves subjective data such as a humanistic mission and the satisfaction of its constituency.
In the HR or human capital realm, change is just as constant as it is in financial, production, or marketing arenas. Labor availability and costs, skill development, leadership, engagement, and retention issues constantly evolve as business needs and market dynamics change. Last year’s recruitment program can be rendered ineffective overnight by market dynamics, competitors’ actions, new technology, and capricious customers. In the first decade of the twenty-first century, the dot-com crash and the liquidity crisis totally disrupted the labor model. Yesterday’s skill requirements are made obsolete by continuing advances in technology as well as new customer demands or changes in government regulations. As the economy improves, acquisition and retention of mission-critical skills become a problem. These and other human capital management dynamics demand that we apply analytics to reconfigure our labor scenario and predict our next best move. If we wait to see what the competition is doing, we lose competitive advantage and market share. Our motto is:
ANALYTIC VALUE CHAIN
Economic and financial values are the rewards gained from a series of linked activities. In practice, the activities are like alternating current. They flow back and forth between strategic plans and operational executions. The elements are seen in Exhibit 1.2. Strategic chain management starts with top executives building their strategic business plan by asking this basic question: How do we make money? The answer is generically applicable to all profit-making enterprises, yet unique in practice to each company. For not-for-profits, the question is: How do we service our constituents? Companies that are successful over time prosper by assessing the market before investing resources. That includes customers, competitors, technology, governmental policies, the economy and labor market, and other macro forces that collectively reveal problems as well as opportunities.
Exhibit 1.2 How Your Company Makes Money
© J. Fitz-enz, 2012
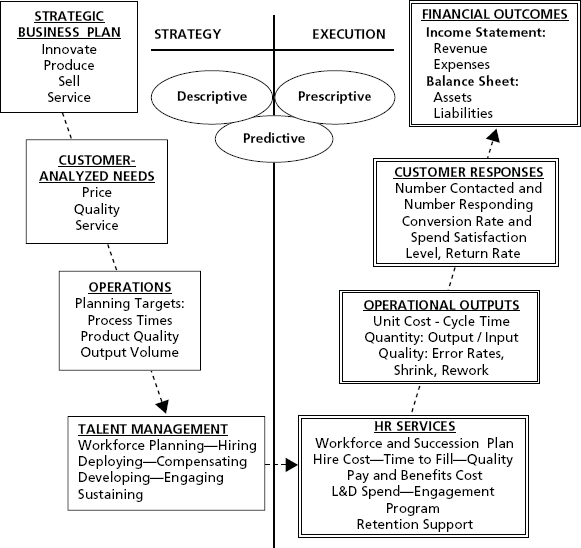
Management also looks inward at the enterprise’s capabilities. These include the enterprise’s vision, leadership, brand, culture, financial strength, and employee capabilities. From this dual assessment, plans are made to produce, sell, and service the company’s offerings. This scenario leads to presumed and/or tested customer responses. The next step down the chain is operations, where line managers plan, design, and manage production systems that presumably will serve and support those customer responses. Operations, in turn, are dependent on human talent.
Now the value chain transforms from the planning side to the execution side. The plan is useless without people capable of executing it. This is what is normally referred to as leverage. At this base point, human capital analytics is applied to uncover the most effective way to manage the workforce to optimize performance and retain talent. The HR function is responsible to play a supporting role with operating managers in hiring, deploying, paying, developing, engaging, and sustaining a strong workforce. HR designs the people systems to facilitate operations. The workforce is the active ingredient driving operations, turning out products that will excite customers, who in turn will increase spending with the company and ultimately generate economic and financial values.
An enterprise suboptimizes itself if management jumps into the chain at midpoints without due consideration of the preceding natural connections. Often the connections are ignored by investors, who acquire a company with the primary objective of quickly turning it around and selling it at a nice profit. This has become such a common practice that we have coined a word for it: flipping. While flippers often achieve their short-term financial goal, they also leave a vulnerable company whose inherent problems have not been fully solved. The initial financial performance is sometimes not sustainable because there is an immature, incomplete strategy, management team, or operating system left in place. Simply selling assets and laying off employees usually does not solve underlying weaknesses. The investors might have applied analytics to a small number of quick fix issues and stopped there. As a result, the obvious blemishes are treated, but the central flaws remain hidden. This is analogous to giving athletes painkillers to get them back in the game while ignoring their wrenched knee, cracked ribs, or signs of concussion. The team might win the immediate game, but lose the players needed to sustain a winning streak.
Fundamentally, analytics is a management tool that can be used to identify opportunities, solve current problems, and predict future returns on investments. Like any instrument, it can be used incorrectly, but that does not mean it is a bad tool. In a recent conversation with the chief HR officer of a Fortune 100 company, he kept avoiding how analytics could be used to improve a performance management system by recounting errors of the past. If someone doesn’t want to solve a problem, no tool can be held responsible. As we have so often observed in talking to managers who really didn’t want to change something, the problem is not the process or tool. It is the person behind it. As Pogo Possum said, “We have met the enemy, and he is us.”1
ANALYTIC MODEL
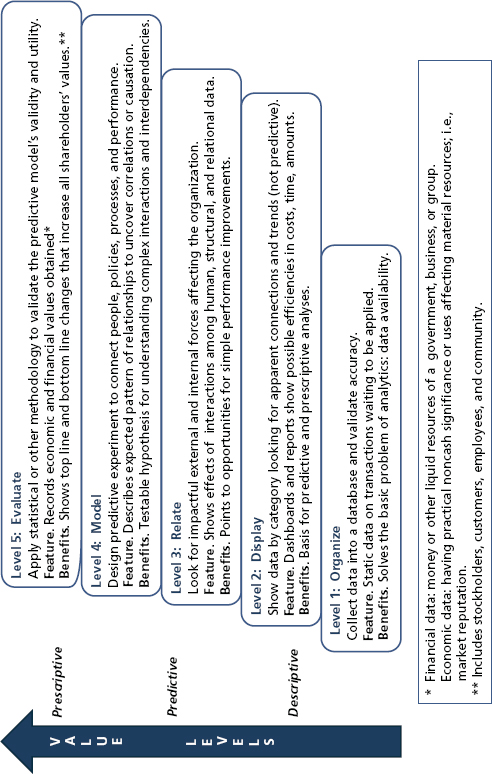
There is a structure to analytics that is more than simply running a statistical analysis. That would be akin to starting your car and driving off without a travel plan in mind. The chances of arriving at your preferred destination would be slim. The first step in analyzing any problem is to ask questions. This was mentioned in Exhibit 1.2. Now we are about to dig deeper as we turn the corner in Exhibit 1.3 and consider a specific analytic opportunity. It is important to ask questions that proceed logically from your current state to your preferred destination—namely identifying the true problem and uncovering the essential conditions surrounding and driving it. Good questioning clears the field, so to speak. It rejects beliefs stemming from obsolete experiences, irrelevancies, and biases. On the positive side, it gradually brings a group together around what is essential and structures a clear goal for the project. Sometimes the solution develops from the questions, and there is no need to go through a statistical exercise.
Exhibit 1.3 Data Analysis Levels
© J. Fitz-enz, 2012
We like to refer to Socrates’ debate with Thrasymachus, described in Plato’s Republic, as an example of enlightened questioning. They start discussing the nature of justice and who is to define it. Thrasymachus forcefully states that justice is nothing more than whatever is advantageous to the stronger, and it is the powerful that define it.2 Rather than confront him, Socrates proceeds with a line of logical, relevant questions. As Thrasymachus answers one after another, he comes to Socrates’ view that justice is defined by the rulers who, rather than being self-centered, have the best interests of their subjects in mind. I have seen this questioning technique work when unimportant issues are pushed aside and, for the first time, the group clearly understands the problem or opportunity and comes to a reasonable solution.
Organizing
The second part of analytics, the one most often thought about, is predictive modeling using statistical procedures. This routine is laid out in a five-step process shown in Exhibit 1.3. The steps start with collecting and organizing human capital data, which is often a major problem. Most corporate databases were designed principally for accounting. Later, applications were developed for research and development, production, and sales/marketing/advertising functions. The HR department worked principally with employee records in the beginning. The first HR information systems hit the market around 1970. In time, applicant tracking systems and compensation and benefits programs came along, and eventually training and development applications, but seldom were these isolated programs connected. Most of the packages were record keepers only that counted volume and costs. Almost none had any predictive capabilities. That is why today it is so expensive and time consuming to install a new program.
As a case in point, we talked with a Fortune 20 client who is struggling with a project designed to provide actionable management data. The problem is the database was never designed for analytics. The company has spent almost two years trying to work with a product of the major vendor that supposedly can provide such data. Now the company is at a point where it needs to go back to internal clients and renegotiate a limited Version 1.0 product.
Displaying
After collecting basic data, many companies have developed dashboards that format data for various internal customers. The dashboards are capable of reporting degrees of performance that are color coded red, yellow, and green. This is an extension of descriptive data. It shows the current state and trends up to this point. Like accounting, it is the basis for reporting the past. It does not speak to the future except through vague, unsubstantiated inferences. The trends are not extendable because underlying conditions and future assumptions are not included. The primary value of dashboards is that perceptive and creative users can see possibilities for attempting hoped for improvements.
Relating
At the relating level, the focus turns outward from the data that has been tracked to its relationship to other data or phenomena. The most common practice today is to benchmark your data to that of other companies. The caution with benchmarking is to be certain that the companies to which you compare yourself are truly similar to you. This is not easy unless you are in direct contact with them and can compare item definitions. The old chicken-and-egg question is appropriate here. If one company is showing superior results in employee development, are the results due to quality hires, commitment to development, or extraordinary financial investment? The only way to answer that is by speaking directly to the benchmarked firm. Survey data that compares outcomes across many companies can be meaningless and often can lead to false assumptions.
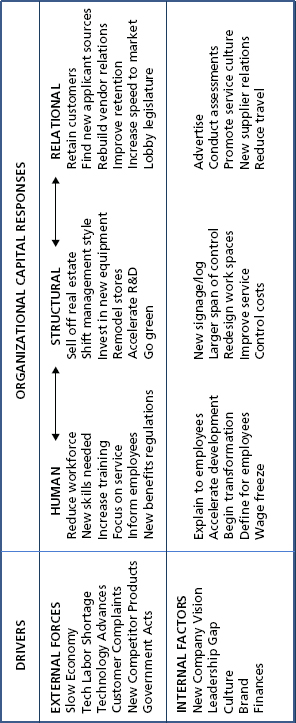
Another factor in data analysis is the recognition that there are three forms of capital within an organization: human, structural, and relational. Human capital is obviously the employees. Structural capital includes the things owned, such as facilities, equipment, software programs, patents, and copyrights. Relational capital is the personal connections between people within the company and between company personnel and external entities. Those can be local community leaders or governmental personnel. Samples of these are shown in Exhibit 1.4. In practice, a change in one of the capital asset categories often affects something in the other categories. It is these connections that make questioning at the macro and micro levels so important.
Exhibit 1.4 Capital Interactions
Modeling
At this point you are clearly moving from the descriptive to the predictive level. The descriptive-level data has revealed what has happened to this point. But since we need to manage for tomorrow, now we have to build a model of what we want to change. Let’s say that there is an agreement that you need to develop, and you need to do it as quickly as possible. You may have invested in a formal leadership assessment program by engaging one of the several assessment vendors. This gives you a clear idea of the current capabilities of your potential leaders. Now the question becomes: Potential to lead what? You don’t want to make the mistake of many firms that do not study what the future market will demand. Peter Drucker put it succinctly when we heard him ask, “Leadership for what purpose?” This is the beginning of building a leadership model for the future. It is an example of the confluence of human, structural, and relational capital. Once you have defined a possible leadership model, you are ready to test it through analytics. Your initial questions from Exhibit 1.2 should have helped you define the model for tomorrow’s leadership.
Evaluating
Prediction gave you your desired model or outcome for the future. Now what is the best way to attain it? You need a prescription. Predictive and prescriptive analytics interact just as a doctor’s diagnosis and prescription. The doctor tells you that if you take this medicine or follow a certain regimen, you will be cured. That is her prediction. When you read the prescription, it tells you what is necessary to validate the prediction. You see what the medicine is and under what conditions you should apply it. In business, the model you developed will probably connect people, policies, products, and processes to achieve some improvement in performance. The model predicted certain patterns or relationships that interact to obtain the desired outcome. When you complete the experiment, you can monitor or measure the amount or degree of change attained. In addition, the model gives you a new routine that should sustain or continue to improve outcomes. Chapter 5 shows several analytic procedures that you can apply and evaluate.
TYPICAL APPLICATION
One of the most common uses of analytics is the study of turnover or attrition. The reason is that analytically, it is an easy application, and most of the information needed is already in the HR database. The employee records contain raw data on date of hire, performance reviews, any status changes (e.g., promotions, salary increases, or various jobs held), and date of departure. There is a rich research database on turnover that yields theories on reasons for staying and leaving. However, as yet, very few attempts have been made to connect turnover or retention changes with business outcomes.
The usual way to start an analysis is by looking for patterns within job groups. You may be interested in a technical or professional group, people with long tenure, or even operators if the market is tight for jobs such as assemblers, warehouse pickers, or truck drivers. Data is sorted by any of the following:
- Reason
- Tenure
- Position
- Supervisor
An example of turnover linked to performance and applicant source is shown in Chapter 3.
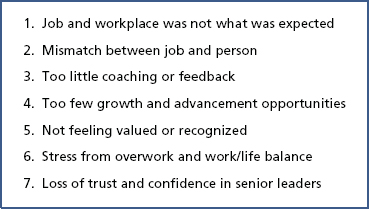
Leigh Branham has made a career out of retention research. He has uncovered 67 reasons why employees disengage, as he calls it.3 Some reasons cannot be prevented due to personal decisions, such as going back to school or the family moving. Yet from the total list, Branham classifies 57 as preventable reasons. Within that group, he states that employees begin to disengage when one of four fundamental human needs are not being met. These are needs for trust, hope, sense of worth, or feeling competent. Branham continued his analysis until he uncovered seven reasons that were identifiable and separable from one another. These are shown in Exhibit 1.5.
Exhibit 1.5 Preventable Reasons Why Employees Disengage
You might launch your analysis by selecting a job group or groups and looking at the reasons employees claimed to have left, assuming you had a valid exit interview process. Then you could apply statistical analysis to uncover combinations of reason and tenure or reason and position. Let’s assume your analysis revealed a connection between tenure and position. You might find, as we have, that in some cases, a manager can stay too long in one job. This can correlate with high employee disengagement or other operating problems, such as reduction of quality, productivity, or service within the unit. You can begin to realize that there are many possible links across an organization for any phenomenon, whether it is attrition, performance, sales revenue, customer retention, or even market share. Organizations are highly complex. The only way to begin to truly know what is happening (descriptive analytics), why it is happening and where it is likely to lead (predictive analytics), and what to do about it (prescriptive analytics) is to use objective analysis in lieu of biased, out-of-date speculation.
TRAINING VALUE MEASUREMENT MODEL
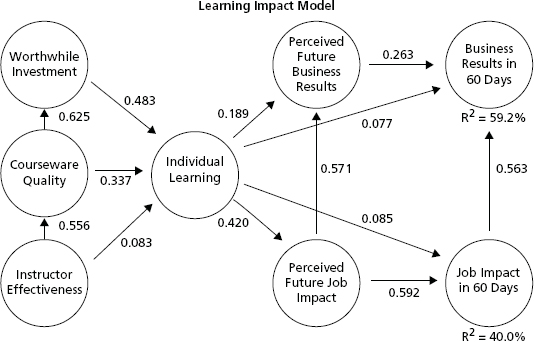
The goal of analytics is to reveal how talent changes affect business results. Training is ahead in this quest, since increasingly its return on investment has been demonstrated. By logical extension, it is assumed that skill-based training yields measureable results. Yet, in practice, this is not always the case. Training outcomes are a function of the material, the trainer, and the student’s perception of the value of the experience.
Exhibit 1.6 is an example from research conducted by Nick Bontis. Applying statistical analysis, he was able to show that trainees’ perception of the applicability of the material to their job was the strongest influence on the applied value of the experience. You can see this by following the model from worthwhile investment (as judged by the trainee) to individual learning to perceived future job impact.
Exhibit 1.6 Finding Training Value
Source: Dr. Nick Bontis, Institute for Intellectual Capital Research, [email protected], www.NickBontis.com. Used with permission.
INSIDE THE DATA
We want to close this introductory chapter with two fundamental points about data: the need for standard definitions and the importance of intangibles.
Standards
In Chapter 5 we deal in depth with data standards, but let us set the stage here. Accounting has developed standard definitions for financial data out of necessity. It would not be possible to prepare and report internal or external financial changes without standard definitions. The Financial Accounting Standards Board (FASB) has been recognized by everyone in the business world for decades. Then, with the rise of globalization, the International Accounting Standards Committee (IASC) and FASB worked together to establish International Financial Reporting Standards (IFRS). There is only one market now, and it is the world. The goal is that eventually all nations will use a single accounting and reporting system. This will greatly improve international accounting and investor confidence.
HR has not had a standard set of definitions, even though from 1985 through 2000, the Saratoga Institute published annual data on over 50 metrics for about 500 companies. In 2011, KnowledgeAdvisors launched a project to generate standards that eventually led to the establishment of the Center for Talent Reporting (CTR; www.centerfortalentreporting.org). As of this date, no professional association, such as the Society for Human Resources Management, has officially endorsed these standards. That notwithstanding, the formulas from CTR are rapidly becoming the de facto standard.
Intangibles
As industry in America has shifted from manufacturing toward services, intangible metrics have come to the fore. At this point in time, intangible data outweighs tangible data on corporate balance sheets by a 5-to-1 ratio. Baruch Lev provided a definition of intangibles in his 2001 book of that title:4
When we met with Lev in his office at New York University, he acknowledged that terms such as intellectual capital and knowledge assets are increasingly found in management publications. Typical examples of intangibles around HR and human capital publications are:
- Leadership
- Readiness
- Engagement
- Culture
- Commitment
- Loyalty
- Employer brand
Since the mid-1980s, the HR function has reported costs of services such as hiring and training. Also, it has reported the number of people hired and trained, salary action and record-keeping volume, budget expenditures, and other internal processes. What it needs to do more is focus on the intangibles. Top management cannot make business decisions based on HR process volumes except to cut staff when business slows. The number hired, paid, or trained is a record of expenditures, not value added. Changes in leadership capability, critical position readiness, engagement, and culture are valuable leading indicators. When reporting volumes or changes in direction of turnover, engagement scores, or readiness levels, the important point is not the number but the predictability of those phenomena. When we explore analytic methods in Chapter 6, you will see how this can be accomplished.