
Chapter 7
Predicting the Future of Human Capital Analytics
Big data will alter the landscape across every industry. It is a new way of thinking.
—ICGX Advertisement for Big Data
This chapter adds to Chapter 6, providing additional examples of statistical methods. The goal is not to scare away people who don’t have knowledge of statistics. It aims to show the power of this powerful analytics tool and examples of how it can (and we believe will) be used in human resources (HR) management. Once you understand when it is useful to conduct a statistical analysis, you can hire from the outside or borrow the talent from within your company.
The road toward mastering analytics is a long one, and the destination is not the end goal. Being able to survive and thrive along the journey while bringing your team and organization along with you—that’s the interim goal. The end goal is to optimize the value that you can add to your organization. We hope that this book has provided insights that will make your trek a little smoother.
This chapter focuses on the future. We aim to provide insights about what you can expect to face—and prepare for—in regard to human capital analytics in the near future.
WHAT DOES THE FUTURE LOOK LIKE?
In order to look toward the future, it is valuable to look toward four other fields of study for insights that will enhance human capital data. They are:
- Finance: Business standards and valuation of organizations
- Mathematics: Chaos theory
- Information Technology: Big Data
- Automated Processes: Decision support
Finance: Business Standards and Valuation of Organizations
As discussed in previous chapters, organizations can use the Talent Development Reporting Principles (TDRP) framework to gather and report standard measures about HR that business leaders can easily understand and use for decision making. In the near future, more organizations will begin to adopt this framework to help make sense of HR in measureable ways. The framework is simple in concept and broad enough to apply across industries. Moreover, it is a standardized approach that allows for benchmarking and comparison.
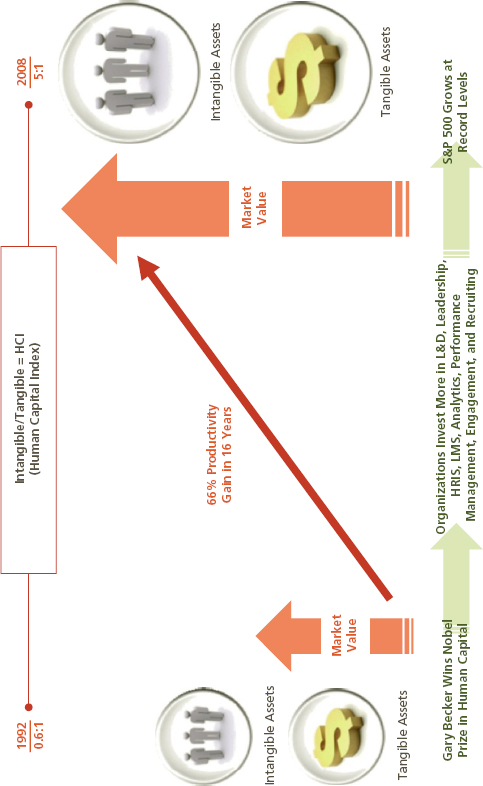
For more than a decade, finance and accounting specialists on Wall Street have been pushing for a way to quantify the value of intangibles. Traditional valuation focuses on the bricks and mortar of a company to determine its value. The tangible aspects of a business—buildings, equipment, products, inventory, and pipeline—were given the most weight when determining the value of a company. As the first world has shifted toward a knowledge-based economy, the intangible aspects of a business now represent from 60 to 80 percent of the value of some enterprises. Patents, research and development, brand, and employees are the intangibles that are propelling progress and creating competitive advantage. For accountants, inventory is easy to count and value. It is not so easy to assess the value of intellectual property, especially when it is trapped within the brain trust of the workforce. Organizations like the Human Capital Management Institute are striving to create a taxonomy of human capital measures that aid accountants in determining the financial value of intangibles. In 1992 Gary Becker won the Nobel Prize for Economics for applying macroeconomics to human behavior like discrimination, educational pursuits and family interactions. At the time, the stock markets valued tangible assets. Exhibit 7.1 shows how company valuation is now more heavily influenced by human capital. The TDRP framework is one possible method to assess the intangible value of human capital. For this reason, as Wall Street and other financial centers assess the market value of companies, TDRP may be used pervasively in the future.
Exhibit 7.1 Change in Human Capital Index from 1992 to 2008
Source: 2009 KnowledgeAdvisors Presentation on Building the Business Case in Economic Uncertainty. Used with permission.
Mathematics: Chaos Theory
In 1987 James Gleick wrote a watershed book on mathematical theory called Chaos: Making a New Science.1 In one volume, he integrated seemingly disparate mathematical ideas of fractal geometry, strange attractors, and the butterfly effect. Michael Crichton, the author of the novel Jurassic Park, made these complex mathematical ideas accessible to the general public. Gleick drove home the thesis that there are measurable patterns hidden within seemingly chaotic data sets.
Patterns in chaos. That’s almost as ironic as the notion that change is constant. If you saw the 2001 movie A Beautiful Mind, you saw Russell Crowe portraying John Forbes Nash, a brilliant mathematician, and you may recall the scene where he is standing in front of a blackboard covered with data. In time he sees a pattern in the data that no one else can see. Unless we can channel John Forbes Nash, we must rely on analytics to find the data patterns.
An example that mixes HR and waterwheels might help.
HR executives face daunting challenges when managing the human capital of an organization. While trying to maintain a productive workforce and addressing a myriad of sociodemographic challenges, leaders have to:
- Capture and share knowledge from an aging or retiring workforce
- Manage the needs of a multigenerational workforce
- Communicate with a multilingual workforce
- Optimize productivity among a dispersed, international, and virtual workforce
- Coordinate operations with offshore/outsourcing partners
Add to these challenges the numerous external factors that influence change—such as the fluctuating economy, the war for talent, and ever-evolving attitudes among Gen X, Gen Y, and Millennials—and plotting the proper course forward becomes even more difficult. It is no wonder the ebb and flow of employees often seems chaotic and uncontrollable.
This is where chaos theory becomes practical.
Take a moment to search the Internet for waterwheels. We suggest using the terms “chaotic Lorenz waterwheel.” You will likely find a link to a YouTube video of a simple waterwheel. This is not the standard waterwheel used at a gristmill or a sawmill hundreds of years ago. This mechanism uses buckets that pass below a water source, gaining weight and speed as they fill up. However, the buckets also have holes in their bottoms, so the inflowing water is also released slowly. This combination of inflow and outflow creates a chaotic rhythm on the waterwheel that seems to have no cycle. Watch the wheel for some time. (It’s hard not to get hypnotized.) It rolls forward with great speed, then slows and even reverses direction. Exhibit 7.2 shows a static representation of the inflow and outflow that affect the waterwheel.
Exhibit 7.2 Representation of the Inflow and Outflow of the Waterwheel
Source: James Gleick, Chaos: Making a New Science (New York: Penguin, 1987), p. 27. Used with permission.
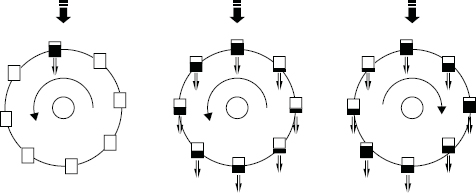
What does this have to do with HR? Everything. Consider the waterwheel as a metaphor for the revolving door that brings the workforce into a company and escorts them out. There is a stream of incoming new hires and an outflow of retirees, transfers (across business units), and terminations (voluntary and involuntary). The stream is often a deluge of new hires. It can also be a mass involuntary exodus due to downsizing. The important distinction is that the revolving door does not spin at a constant rate. In fact, the variation is seemingly inexplicable.
Modeling is the only way to define the situation accurately.
Gleick states that the goal of mathematics is to reveal “the fine structure hidden within a disorderly stream of data.”2 While the term “chaos” implies that there is infinite complexity that cannot be modeled, the scientific study of seemingly chaotic processes has the end goal of finding and defining the hidden patterns. Once the pattern or structure is defined, it can be explained. This is true for any system including the recruiting cycle within an organization. Then, when the contributing factors are explained, they can be controlled. By controlling the inputs, the outputs can be influenced. The wild and frenzied hiring and firing seasons that lead to over- and understaffing can be attenuated. By controlling the extreme swings in the workforce, organizations control costs and increase efficiency, effectiveness, and profitability.
A case in point is the 1990s trial of a major electronics company that got its staffing and sales curves out of phase: Hiring while sales were falling and vice versa. Over a period of four years, it spent about $1 billion overhiring and laying off. Eventually, it fell behind the curve for its primary product line (where it was number 2 in the world) and had to sell it off at fire-sale prices. The company subsequently fell behind the innovation race in a second key product and never recovered.
How do we go about modeling a waterwheel and, in turn, recruiting? Thankfully, mathematicians have been modeling this system and many others for decades. Edward Lorenz, who is famous for studying weather patterns and proffering the “butterfly effect”—the notion that dynamic systems like weather can change dramatically even when the inputs to the system are very small—is also famous for creating a mathematical model for convection patterns of fluid being heated in a container. The initial patterns when graphed in two-dimensional space showed no pattern at all. However, when Lorenz graphed the equations in three-dimensional space (X, Y, and Z axes), a pattern emerged.
The pattern became a model known as a Lorenz Attractor in his honor. Coincidentally, the man who gave us the butterfly effect also gave us a three-dimensional model that looks like a set of butterfly wings. The model clearly shows a pattern. Another search of the Internet using the terms “Lorenz attractor in motion” will show how the pattern evolves over time. The graphic in motion represents the movement of the waterwheel. It spins slowly, then faster in a small tight loop, and then when it reverses, it crosses over to begin a small tight loop on a different dimension. Until the multiple dimensions are shown together in this video, it is hard to fully understand the complexity of the underlying pattern. Consider how this pattern might affect your attempts to hire, develop, and retain talent.
We hope you have begun to wonder what the hiring pattern looks like within your organization. Is it a butterfly-like Lorenz attractor? It may be. Or it may not be. Regardless, it is worthwhile investigating. Gather the data and create a mathematical model. The underlying pattern might be simple and linear. Or it might have a logarithmic or a dynamic chaotic structure. Regardless of the actual pattern, it certainly wouldn’t be boring to investigate, model, and define the inflow and outflow pattern of employees. To say you don’t have time to pay attention to these patterns leaves your enterprise behind the market.
Mathematical models help us define and understand our world. Sometimes advanced math, like chaos theory, is required to uncover the underlying structure of our data. Other times the pattern can be uncovered easily through observation or simple analytics. Most important, an investigation into the data patterns, particularly the inflow and outflow of employees, can provide insights and actions that can improve organizational performance, product quality, and efficient staffing processes.
Information Technology: Big Data
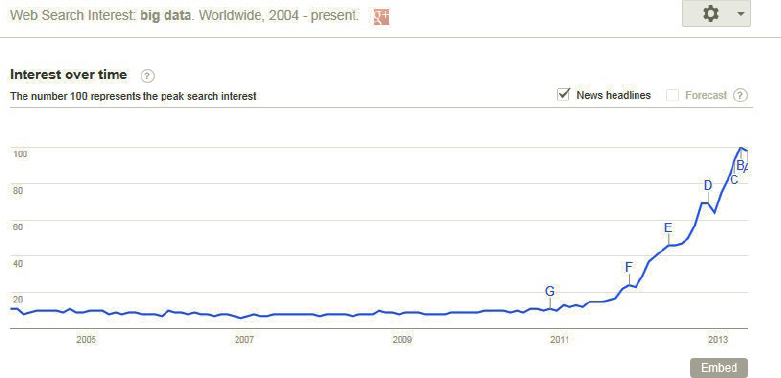
In 2012 and 2013, Big Data became the hot topic in business literature. The October 2012 editions of American Management Association’s journal M World and Harvard Business Review are dedicated to the topic. (Jac was commissioned to write “Predictive Analytics and Big Data” for M World.3) The book Big Data: A Revolution that Will Transform How We Live, Work and Think,4 is widely available and explains the issue well with meaningful and readable examples. According to Amazon.com (August 2013), it was the number 2–selling business book about information management and the number 1622–selling book overall. Exhibit 7.3 shows how the term has grown in popularity among Google searches, especially in the last two years.
Exhibit 7.3 Google Searches for the Term “Big Data”
While the topic is seemingly simple in name, the issue is more complex. The industry standard definition of Big Data consists of three data characteristics:
- Volume. The amount of data being created on a daily basis is overwhelming.
- Velocity. The speed and rate of change at which data is collected and processed is difficult to fathom.
- Variety. The range of data types and sources is expanding, making standard analytics difficult to enact.
Beyond the characteristics of the data, the crux of this topic is the need to extract information to make decisions. Massive data sets provide the opportunity for grand insights. In their book Big Data, Mayer-Schonberger and Cukier cite a project by Google. A team at the search company giant mined the company’s own data for search terms related to flu symptoms. It correlated those results with geographic location to predict outbreaks of swine flu. The results were remarkably accurate and two weeks faster than the method used by the Centers for Disease Control.
In the HR area, two things are driving the accumulation of big data sets: the automation of HR practices and the consolidation of HR systems. Information technology (IT) systems have made business processes extremely efficient:
- Learning management systems store courses, serve up e-learning, track compliance, manage registrations, issue certifications, and even administer tests.
- Talent systems manage candidate applications, employee demographics, salary information, performance reviews, promotions, and many other things.
The by-product of these efficient systems is a massive source of data.
The HR software industry has seen multiple changes:
- 2004: PriceWaterhouseCoopers acquires Saratoga Institute
- 2010: SuccessFactors acquires InfoHRM and Plateau, a learning management system
- 201: SAP acquires Success Factors
- 2012: IBM acquires Kenexa
In the near future, we can expect there will be a verifiable Grand Unified Theory of Human Capital. It will explain the driving factors that lead to hiring, promoting, and retaining the best talent available. More important, the theory will be tested, confirmed and modified by billions of HR records. Big Data will allow analysts to ignore samples and focus on the big picture—the really big picture.
Due to the individual systems and consolidation of data sets through acquisitions, HR data proliferates. Today many HR organizations have an opportunity that existed only in the realms of science fiction for most large companies—an integrated view of HR data from cradle to grave for employees.
Mayer-Schonberger and Cukier argue compellingly that Big Data will allow analysts to uncover what is happening within an organization on a grand scale. Instead of focusing on a segment within an organization or a sample across all of the organization, Big Data affords N = all. When possible, all available data should be analyzed. Using standard descriptive statistics, analysts will be able to describe the current state and tell leaders what is happening. Mayer-Schonberger and Cukier also advocate using correlation techniques to examine relationships among measures. They recommend joining data sets that were once disparate so analysts can examine new relationships and test new hypotheses. Does increased salary lead to higher engagement? Or is it better to invest in development funds or special projects to increase engagement? Does the source of hire and the time to fill a position correlate with performance quality a year later? By examining these relationships, analysts can uncover what is happening in the organization.
In the near future, companies will become more sophisticated with their analytic techniques. Understanding what is happening in an organization will not be sufficient. Leaders will want to understand why things are happening. Correlation will still be useful, but it will be a gateway to more sophisticated techniques, such as multiple linear regression, structural equation modeling, logistic regression, linkage analysis, and discriminant analysis. Three things will support this change:
- Thirst for information among leaders. The C suite will quickly get bored with descriptive statistics, dashboards, and correlations that simply define the current state. They will want predictive analytics, and they will track future performance against predictions.
- Tools will be readily available. Advanced statistical tools like SAS, R, SPSS, Minitab, and even some features of MS Excel will enable analysts to dig past the what to the why. These tools are currently available, but you can expect that they will be packaged with systems like SuccessFactors, SalesForce.com, or Saba so analysts can conduct statistical tests without downloading the data to an offline system.
- Resources will be abundant: In October 2012, Davenport and Patil openly stated that the sexiest job of the twenty-first century will be data scientists (business analysts, statisticians, quants, data jockeys).5 You may be asking, “Really?” Well, there is a business need, and because of their article, it has been publicly marketed. Additionally, universities are responding by offering analytics degrees. Henschen published a list of the top 20 master’s degree programs for Big Data analytics in InformationWeek.6 Newly minted data scientists should be available to fill positions soon.
Automated Processes: Decision Support
Athletes get better by practicing. They perform, observe their behavior, and adjust. If they can’t observe their own behavior, they hire a coach. Performance is measured and goals are set. In this way, athletes create a feedback loop to drive performance improvement.
During a TED Talk in 2013, Raffaello D’Andrea demonstrated how he and a team of scientists have made quadcopters (small helicopters with four rotors) perform like athletes. A quadcopter can orient in space, balance a pole, carry a glass of water, hit a ball back to Raffaello, work in tandem to catch a ball in a net, and even do a backflip. Like the waterwheel, this TED video is fascinating to watch. The science behind it is mathematically complex, but the process is simple: Use mathematics to model the flying behavior, set control parameters around the performance, monitor the performance, and provide a continuous feedback loop in real time. (Real time in this case is 20 times per second.)
The continuous improvement process is not new, and organizations currently have various types of monitoring, feedback and action loops in place. The use of a Kaplan and Norton balanced scorecard is a perfect example of such a feedback loop.7 It begins by selecting key performance indicators along four critical business dimensions: financial, internal business processes, learning and growth, and customer. Data is gathered, analyzed, and reported in a scorecard. Leaders review the scorecards quarterly and take actions to improve metrics. The TDRP framework is also a viable structure for gathering and reporting data in a continuous improvement loop.
BRINGING IT ALL TOGETHER
In the near future, the following processes will happen within organizations:
- IT departments will help HR integrate talent systems so organizations can link data from various talent processes.
- HR will create standard scorecards that gather the right data (efficiency, effectiveness, outcomes) to demonstrate the influence of HR on the business.
- Data scientists within HR will use advanced analytic approaches to assess what and why to provide insights to business leaders.
- HR departments will set up continuous, automated feedback loops that put information in the hands of decision makers to increase the efficiency and effectiveness of HR processes.
PREDICTIVE ANALYTICS FOR HR IN ACTION
The conversation between employees and HR will change dramatically. Involuntary turnover will disappear for all practical purposes because talented employees will be retained. The future of predictive analytics in HR might look something like the situation described next.
Imagine for a moment that you are a newly hired recruiter and you are attending a one-on-one termination meeting with your coach. She has brought you in to learn by shadowing her. The employee who is being terminated, Joe, enters the room. He knows he is being let go but is reluctant to leave. He asks several questions about benefits and then leaves the meeting and the organization. Although you are new to the organization, you know him. He has a reputation as is a solid performer. He is friendly in a professional way and is considered an asset to his team. When he leaves, your coach asks, “Do you have any questions?”
“Just one,” you answer. “Why did you fire him? He is a good performer.”
“Yes,” she says, “He is a good performer. But he is not a great performer. He used to be great, and that’s why he has been here for seven years.” As she talks, she types on her computer. She is opening a file for you to review. “His stellar performance lasted through year five when he was promoted and received a large salary increase. During the last two years, he has plateaued as an average performer.”
“So, average performance in a new role is a reason to fire someone?”
“No, but this file shows us that we have many options. I received an alert last month from the HR system that there is a 75% probability that Joe is likely to leave for a new position that opened at a competitor. That percentage jumped to 95% when he requested a day off last Monday—likely for a job interview. If he had taken a day off on Wednesday, I would not have been concerned. Mondays and Fridays are usually interview days.”
“You said there are options. Many options.”
“Yes.” She points to the screen. “I have an account with an online sourcing system. I entered the job profile for Joe last week, and there are 100 candidates that match the requisition. Ninety percent of them are in the metro area. Twenty of them make 25% less than Joe, and have 25% more experience. Fifteen are men. Five are women, and two of them are minorities. The colleagues on Joe’s team indicated they would like to have a female leader. This is also a chance to expand the diversity of the team.” She points to a name on screen. “This is my top candidate. New hires like to prove themselves, so she is likely to work harder than Joe, and we expect that she will be 21% more productive. If we offer her the job at a salary 19% lower than Joe’s, there is an 85% chance she will take it.”
“But she lives outside the metro area. That will be long commute.”
“The probability jumps to 87% if we give her one flex day per week. It jumps to 99% if we let her work from home and only require her to come to the office for critical meetings.”
Then you ask, “When do we interview her?”
“In 15 minutes.”
“I better get ready then,” you say as you get up to leave the office.
“You’ll find her resume in your e-mail. Just sent it to you.”
Before you exit, you stop at the door and ask, “Can I see the report you had about me prior to my job interview?”
She laughs. “Yes, I’ll share it with you during your performance review. There’s a 90% chance you’ll stay with us long enough to have one.”