
CHAPTER 8
Office Integration
One of the really great things about VBA in Microsoft Office is that it allows programmatic access to each application from the others. This powerful functionality lets us automate many business processes, including data integration and document creation and management. It also allows us to create workflows within the Office suite of applications.
In this chapter, we will see how we can turn an Excel workbook into a summary report in Microsoft Word. We'll also take that same workbook and create a presentation in Microsoft PowerPoint. Both documents will include text and chart data from our Excel project.
The code we've been writing so far has accessed properties of Microsoft Excel 2007 using the Excel Document Object Model (DOM). We will now explore some of the common DOM objects for Word and PowerPoint as we delve into Office automation.
Creating a Report in Word
In Chapter 5, we explored charting in Excel 2007. We are going to turn one of our chart reports into a summary report using the Word 2007 DOM from the Excel 2007 VBE.
In this example, you'll learn how to do the following:
- Open an instance of Microsoft Word programmatically
- Create a new document within the instance of Word
- Add text
- Apply styles
- Insert chart objects from Excel
Let's start by opening an existing Excel project that contains numeric and chart data. We'll use the charts in our summary report in Word.
- From the source files for this book, open the file Chapter 8
FilesChart08.xslm.
The file contains sales data and pie charts for a few product categories that we need to create a report on. The report will cover the first few months of sales year 2007, as shown in Figure 8-1.
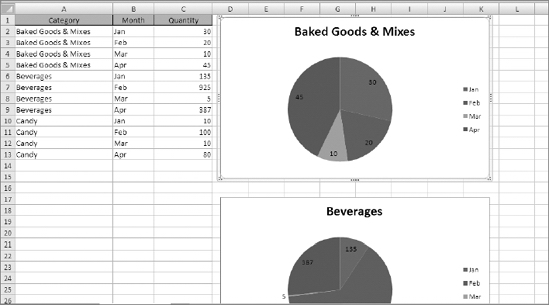
Figure 8-1. Sales data and pie charts
- Open the VBE by selecting the Developer ribbon
 Code tab Visual Basic command, or by pressing Alt+F11.
 - Add a new standard module in the Project Explorer.
Before we can begin accessing and working with the Word DOM, we need to add a reference to Word in the References dialog box.
- In the VBE, select Tools References to display the References dialog box (shown in Figure 8-2).
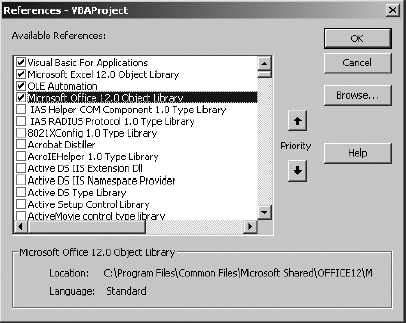
Figure 8-2. References dialog box
- In the References dialog box, scroll down until you see the Microsoft Word 12.0 Object Library (shown in Figure 8-3).
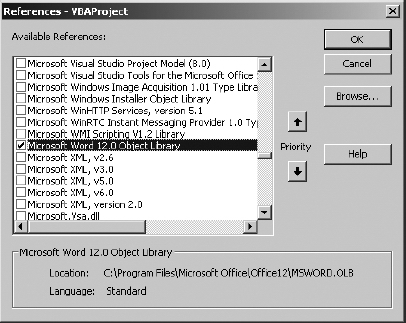
Figure 8-3. Microsoft Word 12.0 Object Library selected
- Select the Microsoft Word 12.0 Object Library.
- Click OK.
- Add the following module-level variables:
Private m_oWordApp As Word.Application
Private m_oWordDoc As Word.Document
These variables will hold the instance of our Word application and the new Word document for the report.
- Create a new subroutine named
MakeWordDoc. - Add the following variable declarations:
Dim i As Integer

Dim sTitle As String

Dim sBody As String
These will contain a counter value used when we loop through our charts, and two string values to hold the title and introductory text for the report. Next, we'll assign the title of our report, "2007 Sales Report," to the sTitle variable. Since we'll also be creating a PowerPoint presentation from our VBA code, let's create some routines to provide that information to our application. This way, we can reuse it in both processes.
The Helper Functions
We are going to add three separate text entries for our report:
Title text: The title of the report
Title body text: A description or introduction to the report
Subject body text: Brief descriptions for each product chart
For this, we will create three helper functions.
- In the VBE, add a new standard code module.
- On the new code module, add the function shown in Listing 8-1 to return the report title:
Listing 8-1. GetTitle Function
Function GetTitle() As String

  GetTitle = "2007 Sales Report"

End Function
- Below
GetTitle, add a function to return the title body text, as shown in Listing 8-2.Listing 8-2. GetTitleBody Function
Function GetTitleBody() As String

Dim sBody As String

  sBody = "Sales for the first four months of 2007 were generally stable.  "

  sBody = sBody & "Although Baked Goods & Mixes were somewhat flat "

  sBody = sBody & "Beverages and Candy showed improvement."


  GetTitleBody = sBody

End Function
- On the same code module, add the function shown in Listing 8-3 to return the subject body text.
Listing 8-3. GetSubjectBody Function
Function GetSubjectBody(Index As Integer) As String

Dim sBody As String

    Select Case Index

    Case 1

      sBody = "Sales in this category were average "

                & "for the first third of the year."

    Case 2

      sBody = "Sales in this category were slightly above average "

                & "for the first third of the year.  February was "

                & "very good for the season."


    Case 3

      sBody = "Sales in this category were above average "

                & "for the first third of the year.  February and April "

                & "showed spikes due to holidays."

    End Select


  GetSubjectBody = sBody

End Function
- Save the project.
In a production application, you are probably not likely to store these string values in your VBA code. For the purposes of our examples, I've included the text here, but a more realistic scenario would be if this information came from a database, an XML or text file, or even a worksheet in an Excel project.
The last subroutine we added, GetSubjectBody, takes a parameter named Index. This is used to match and display the correct text for the corresponding chart.
Let's move back to Standard Module1 and resume programming our Word report.
Creating an Instance of Word
Before we begin, let's outline the steps involved in creating a report with text and charts in Word from Excel VBA code:
- Open the Word application.
- Create a new Word document.
- Add formatted headings and text.
- Add charts with formatted headings and text.
- Display Word and the new report.
Let's begin. Our first tasks are to open an instance of the Word application and load a new document into that instance.
- In the
MakeWordDocsubroutine, add the following statements:
Set m_oWordApp = CreateObject("Word.Application")

Set m_oWordDoc = m_oWordApp.Documents.Add
We are using the CreateObject function to create an instance of the Word application. CreateObject creates a new instance of Word even if one is already open. To use CreateObject to create an instance of a Microsoft Office product, you call the method and pass in an argument containing the class name of that application. The class name is a combination of the application name plus the object type. In this case (and in most cases), our object type is Application. All Microsoft Office products expose an Application object type. Word and Excel provide a few other object types that can be created with CreateObject as well, as shown in Table 8-1.
Table 8-1. Microsoft Office Object Types
| Office Application | Object Type | Class |
| Access | Application |
Access.Application |
| Excel | Application |
Excel.Application |
| Excel | Worksheet |
Excel.Worksheet |
| Excel | Chart |
Excel.Chart |
| Outlook | Application |
Outlook.Application |
| PowerPoint | Application |
PowerPoint.Application |
| Word | Application |
Word.Application |
| Word | Document |
Word.Document |
When using any of the additional object types provided by Word or Excel, a new instance of Word or Excel is created. To use CreateObject to open an instance of Outlook, the syntax would be the following:
CreateObject(Outlook.Application)- Next, fill the variables with title and body text by adding the following lines of code:
  sTitle = GetTitle

  sBody = GetTitleBody
- Then, use the Word
Applicationobject to insert the title and body text into the Word document, by adding the following code to theMakeWordDocsubroutine:
  With m_oWordApp

    .Selection.Style = .ActiveDocument.Styles("Heading 1")

    .Selection.TypeText sTitle

    .Selection.TypeParagraph

    .Selection.TypeText sBody

  End With
This code defines the document style for the first line of text and inserts the title text. Next, we add a new paragraph break and insert the report's descriptive body text.
Before we begin inserting our charts, let's add some cleanup code and take a quick look at our progress by running and displaying Word from the VBE.
- Add the following code after the
With...End Withblock:
  m_oWordApp.Visible = True

  MsgBox "word s/b  open now"

  m_oWordApp.Quit

  Set m_oWordApp = Nothing
Here we are displaying the Word application and our new document. The message box is here to stop the code from running so we can navigate over to the Word window (if it's not already the active window). Once we click the message box to close it, our cleanup code runs and shuts down the instance of Word and kills the Word Application object.
- Save your work.
The code so far should look like Listing 8-4.
Listing 8-4. MakeWordDoc Subroutine
Sub MakeWordDoc()

Dim i As Integer

Dim sTitle As String

Dim sBody As String


  Set m_oWordApp = CreateObject("Word.Application")

  Set m_oWordDoc = m_oWordApp.Documents.Add


  sTitle = GetTitle

  sBody = GetTitleBody


  With m_oWordApp

    .Selection.Style = .ActiveDocument.Styles("Heading 1")

    .Selection.TypeText sTitle

    .Selection.TypeParagraph

    .Selection.TypeText sBody

  End With


  m_oWordApp.Visible = True

  MsgBox "word s/b open now"

  m_oWordApp.Quit

  Set m_oWordApp = Nothing

End Sub
Let's run the code we've generated so far and see what we get.
- Put your cursor anywhere in the
MakeWordDocsubroutine. - Click the Run button on the VBE toolbar or press F5.
Note Depending on the speed of your computer, the code may run for a bit before Word appears. Remember, you are loading an actual instance of Word, so this will take about as long as Word normally takes to load on your machine.
Figure 8-4 shows the Word instance displaying the report heading in Heading 1 style and descriptive text in the default (Normal) style formatting.
Note We did not tell our code to format the body text in Normal style, did we? The default behavior of Word's heading styles is to format text at the following paragraph marker to Normal style (saving us a line of code in the process!).
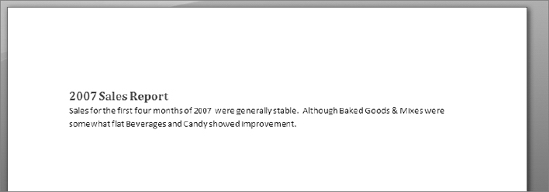
Figure 8-4. The report heading and text
Note The formatting of the Heading 1 and Normal styles may differ in your Word installation.
- Navigate back to the main Excel window and click OK on the message box to let the code finish running, as shown in Figure 8-5.
Figure 8-5. The message box stops the code so that we can check results.
- Click No when prompted to save the Word document (unless you really want it).
Adding Charts to the Report
We've seen now that our code works. Word opened and the heading section of the report displayed successfully. Now let's return to the VBE and add our charts and their descriptive text.
We have three charts to insert and three sets of descriptive text. In this section, we will add a loop that will do the following:
- Insert a blank line between each section
- Insert the descriptive text
- Insert the chart
- In the
MakeWordDocsubroutine, place the cursor at the beginning of theEnd Withstatement. - Press Enter.
- Move the insertion point into the blank line you just created and add the following lines of code:
   For i = 1 To 3

    .Selection.TypeParagraph

    InsertText i

    InsertChart i

   Next i
I've created a couple of helper functions to insert the text and charts according to the index passed into the procedure. The InsertText subroutine finds the chart with the index value passed in and grabs its title. It then calls the GetSubjectBody function to get the text corresponding to the chart. Finally, it formats the text area and inserts the appropriate section heading and text.
- On Standard Module1, add the code shown in Listing 8-5.
Listing 8-5. InsertText Procedure
Sub InsertText(Index As Integer)

Dim sTitle As String

Dim sBody As String


  Worksheets(1).ChartObjects(Index).Activate

  sTitle = ActiveChart.ChartTitle.Text

  sBody = GetSubjectBody(Index)


  With m_oWordApp

    .Selection.Style = .ActiveDocument.Styles("Heading 2")

    .Selection.TypeText sTitle

    .Selection.TypeParagraph

    .Selection.TypeText sBody

    .Selection.TypeParagraph

  End With

End Sub
The InsertChart subroutine finds the chart based upon the index value passed in, and then applies its Copy method to place a copy of the chart on the Windows clipboard. Then we move to the Word document and apply the Paste command at the insertion point.
- On Standard Module1, add the code shown in Listing 8-6.
Listing 8-6. InsertChart Procedure
Sub InsertChart(Index As Integer)

  Worksheets(1).ChartObjects(Index).Copy

  m_oWordApp.Selection.Paste

End Sub
This completes the MakeWordDoc procedure. The finished code should look like Listing 8-7.
Listing 8-7. Complete MakeWordDoc Subroutine
Sub MakeWordDoc()

Dim i As Integer

Dim sTitle As String

Dim sBody As String


  Set m_oWordApp = CreateObject("Word.Application")

  Set m_oWordDoc = m_oWordApp.Documents.Add


  sTitle = GetTitle

  sBody = GetTitleBody


With m_oWordApp

  .Selection.Style = .ActiveDocument.Styles("Heading 1")

  .Selection.TypeText sTitle

  .Selection.TypeParagraph

  .Selection.TypeText sBody

 For i = 1 To 3

  .Selection.TypeParagraph

  InsertText i

  InsertChart i

 Next i

End With


  m_oWordApp.Visible = True

  MsgBox "word s/b  open now"

  m_oWordApp.Quit

  Set m_oWordApp = Nothing

End Sub
Now let's run the code and see the finished product.
- Place the insertion point anywhere inside the
MakeWordDocsubroutine. - Click the Run button on the VBE toolbar or press F5.
The completed report will appear, and should look similar to Figure 8-6.
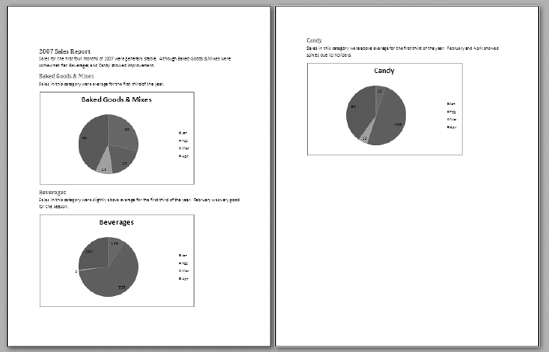
Figure 8-6. The completed summary report displayed in Print Preview mode
The Word DOM is very rich and contains many other useful objects for you to code against. Once you've added a reference to Word in the VBE, you can explore its many features in the Object Browser (which you can access by pressing F2). Figure 8-7 shows a view of the Word objects as displayed in the Object Browser.
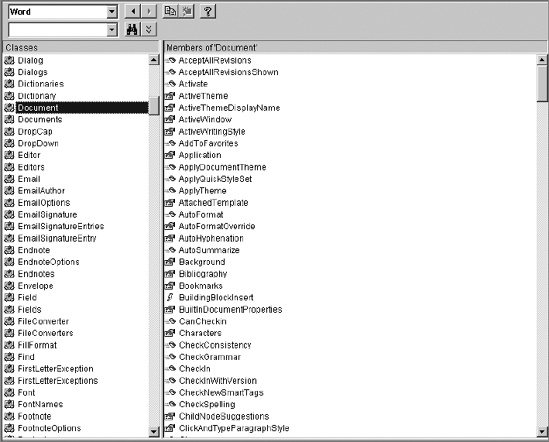
Figure 8-7. Word objects displayed in the Object Browser
- Return to the Excel window.
- Click OK on the message box and let the code run its cleanup.
Now that we've got our report completed in Microsoft Word, let's look at PowerPoint and create a presentation based on this data.
Creating a PowerPoint Presentation
Now that you've had a little experience in navigating Word's DOM, you should be comfortable enough to dive into the PowerPoint DOM. The process will be very similar, although the objects we will use will be very different.
In this example, we will build a series of slides, including a title page followed by one slide per chart in our Excel workbook project. The steps involved in this code will be as follows:
- Open the PowerPoint application.
- Create a new presentation document.
- Create a
Slideobject. - Add a title slide.
- Add chart slides.
- Display the PowerPoint window with the new presentation loaded.
Coding the Presentation
Before we could access any of the Word DOM objects in the previous example, we had to add a reference to the Word Object Model to our code project. Before we can access any of the PowerPoint DOM objects, we must also add a reference to the PowerPoint Object Model.
- Open the VBE by selecting the Developer ribbon Code tab Visual Basic command, or by pressing Alt+F11.
- In the VBE, select Tools References to display the References dialog box (shown in Figure 8-8).
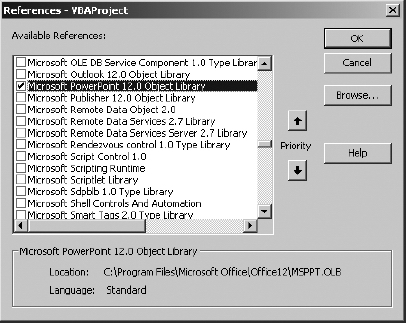
Figure 8-8. Adding a reference to the PowerPoint 12.0 Object Model
- Select the Microsoft PowerPoint 12.0 Object Library.
- Click OK to save the reference.
Now we can start coding against the PowerPoint DOM. For our PowerPoint example, we'll use a new empty code module.
- In the VBE, add a new standard module in the Project Explorer. If you've only coded per the previous example, this should be Module3 (but don't worry if it's not).
- Add the following module-level variables:
  Private m_oPptApp As PowerPoint.Application

  Private m_oPptShow As PowerPoint.Presentation

  Private m_oPptSlide As PowerPoint.Slide
The object types of these variables are plainly named. We have a variable to hold a reference to the PowerPoint application, one for the Presentation object, and one to hold a Slide object.
- Add a new subroutine to the code module and name it
MakePowerPointPresentation. - Add the following lines of code:
  Set m_oPptApp = CreateObject("PowerPoint.Application")

  Set m_oPptShow = m_oPptApp.Presentations.Add
In this code, we are instantiating an instance of the PowerPoint application using the CreateObject function discussed in the previous example. Then we are adding a new presentation to that instance.
Now that we have a presentation to work with, our next tasks are to create a title slide and then add chart slides. In our Word example, we created helper functions to do this, and we will do something similar here.
PowerPoint Helper Functions
Our next chore is to create a title slide. The title slide will consist of a title line plus descriptive text, similar to the Word report we created in the last example.
- Still working on the standard code module with your PowerPoint code, add a new subroutine and name it
CreateTitleSlide. - Add the following line of code:
Set m_oPptSlide = m_oPptShow.Slides.Add(1, ppLayoutTitle)
The PowerPoint Presentation object contains a Slides collection that naturally contains all of the slides in a presentation file. The Slides collection's Add method adds a slide to the collection and returns a Slide object back. Here we are assigning that new slide to our m_oPptSlide variable.
The Add method takes two parameters. The first is the slide index. This tells PowerPoint where to put the slide. In our code, it's set to 1 since we're creating the first or title slide. The second parameter is the type of auto-layout to use. Figure 8-9 uses the Object Browser to show the many options available.
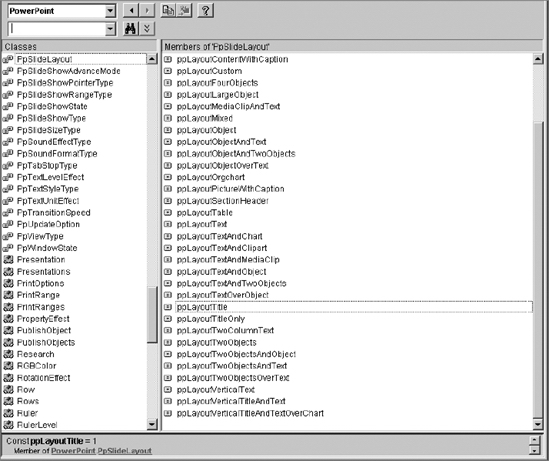
Figure 8-9. Slide layout enums listed in the Object Browser
The enum we've used represents a layout with a title placeholder and a text placeholder.
- Add the following code to the
CreateTitleSlidesubroutine:
With m_oPptSlide.Shapes.Placeholders(1)

  With .TextFrame.TextRange

    .Text = GetTitle

    .Font.Bold = msoTrue

    .ChangeCase ppCaseUpper

  End With

End With


With m_oPptSlide.Shapes.Placeholders(2)

  With .TextFrame.TextRange

    .Text = GetTitleBody

    .Font.Bold = msoFalse

    .ChangeCase ppCaseUpper

  End With

End With
Within these two With...End With blocks, we are adding our title text and descriptive text to the Placeholder objects on the title slide. In the first With...End With block, we are setting the title and adding bold formatting to the text. In the second With...End With block, we are adding the title body (or descriptive) text with no bold formatting. The completed CreateTitleSlide subroutine should look like the code in Listing 8-8.
Listing 8-8. Complete CreateTitleSlide Subroutine
Sub CreateTitleSlide()

  Set m_oPptSlide = m_oPptShow.Slides.Add(1, ppLayoutTitle)


  With m_oPptSlide.Shapes.Placeholders(1)

    With .TextFrame.TextRange

      .Text = GetTitle

      .Font.Bold = msoTrue

      .ChangeCase ppCaseUpper

    End With

  End With


  With m_oPptSlide.Shapes.Placeholders(2)

    With .TextFrame.TextRange

      .Text = GetTitleBody

      .Font.Bold = msoFalse

      .ChangeCase ppCaseUpper

    End With

  End With

End Sub
Next, we'll create a procedure to add the slide charts.
- Add a new subroutine to the code module we've been working in. Name it
CreateChartSlides. - Add the following variable declarations to
CreateChartSlides:
Dim i As Integer

Dim sTitle As String

Dim sngChartStart As Single
Dim spacer As Integer
The first variable, i, is the counter variable for the loop we'll use when enumerating through our charts. sTitle will store the title text for each chart slide. The sngChartStart variable will be used to help us determine where to place the chart on the slide and how to size it. The last variable, spacer, will be used to put a bit of space between the title placeholder and the chart.
- Add a
For...Nextloop with two blank lines between the start and end of the loop, as follows:
For i = 1 To 3


Next i
The entire subroutine will take place within this For...Next block.
- Add the following lines of code:
   Worksheets(1).ChartObjects(i).Activate

   sTitle = ActiveChart.ChartTitle.Text
The first line activates the chart with an index of i. The second line retrieves the title of the chart we just made active.
Next, we'll add a slide to place the chart on.
- Add the following line of code:
Set m_oPptSlide = m_oPptShow.Slides.Add(i + 1, ppLayoutTitleOnly)
This line adds a new slide and gives it a layout that contains only a title placeholder.
- Add the following code to the
CreateChartSlidesprocedure:
   With m_oPptSlide.Shapes.Placeholders(1)

     sngChartStart = .top + .height


     With .TextFrame.TextRange

       .Text = sTitle

     End With

   End With
In this With...End With block, we are assigning a value to the sngChartStart variable, which is the total of the title placeholder's Top and Height property values. This will be used when we place the chart on the slide. Next, we add the chart title text to the title placeholder.
Next, we'll use the Excel Chart object's Copy method to place the chart in memory, and then we can paste it into the slide and place it in its proper location.
- Add the following code to the
CreateChartSlidesprocedure:
   Worksheets(1).ChartObjects(i).Copy


   spacer = 20

   With m_oPptSlide.Shapes.Paste

     .top = sngChartStart + spacer

     .height = m_oPptSlide.Master.height - sngChartStart + spacer

     .left = m_oPptSlide.Master.width / 2 - .width / 2

   End With
The completed CreateChartSlides subroutine should look like Listing 8-9.
Listing 8-9. Complete CreateChartSlides Subroutine
Sub CreateChartSlides()

Dim i As Integer

Dim sTitle As String

Dim sngChartStart As Single

Dim spacer As Integer


  For i = 1 To 3

    Worksheets(1).ChartObjects(i).Activate

    sTitle = ActiveChart.ChartTitle.Text

    Set m_oPptSlide = m_oPptShow.Slides.Add(i + 1, ppLayoutTitleOnly)


    With m_oPptSlide.Shapes.Placeholders(1)

      sngChartStart = .top + .height


      With .TextFrame.TextRange

        .Text = sTitle

      End With

    End With


    Worksheets(1).ChartObjects(i).Copy


    spacer = 20

    With m_oPptSlide.Shapes.Paste

      .top = sngChartStart + spacer

      .height = m_oPptSlide.Master.height - sngChartStart + spacer

      .left = m_oPptSlide.Master.width / 2 - .width / 2

    End With


  Next i

End Sub
Completing the MakePowerPointPresentation Procedure
Moving our attention back to the MakePowerPointPresentation subroutine, we will now insert our helper functions into the procedure and view our results. We will also add some cleanup code.
- In the
MakePowerPointPresentationsubroutine, move the insertion point to a blank line after the two lines of code previously entered (shown in Listing 8-10 for reference).Listing 8-10. MakePowerPointPresentation Subroutine So Far
Sub MakePowerPointPresentation()

  Set m_oPptApp = CreateObject("PowerPoint.Application")

  Set m_oPptShow = m_oPptApp.Presentations.Add


End Sub
- Add the following two lines of code calling the helper functions:
  CreateTitleSlide

  CreateChartSlides
- Add the following code to display the results of your work and to perform the necessary cleanup operations:
  m_oPptApp.Visible = msoTrue

  MsgBox "PowerPoint is open"

  m_oPptApp.Quit

  Set m_oPptSlide = Nothing

  Set m_oPptShow = Nothing

  Set m_oPptApp = Nothing
We are making our m_PptApp object visible and freezing the code with a message box, as we did in our Word example. The last few lines of this code close the PowerPoint application and destroy all of the PowerPoint objects.
The completed MakePowerPointPresentation subroutine should look like Listing 8-11.
Listing 8-11. Complete MakePowerPointPresentation Subroutine
Sub MakePowerPointPresentation()

  Set m_oPptApp = CreateObject("PowerPoint.Application")

  Set m_oPptShow = m_oPptApp.Presentations.Add


  CreateTitleSlide

  CreateChartSlides


  m_oPptApp.Visible = msoTrue

  MsgBox "PowerPoint is open"

  m_oPptApp.Quit

  Set m_oPptSlide = Nothing

  Set m_oPptShow = Nothing

  Set m_oPptApp = Nothing

End Sub
Now that we've completed the coding, let's run it and see our results.
- Place the insertion point anywhere inside the
MakePowerPointPresentationsubroutine. - Click the Run button on the VBE toolbar or press F5.
- If the Excel window appears with the message box displayed, make PowerPoint the active window.
The dynamically created PowerPoint presentation is displayed. It should look like Figures 8-10 through 8-13.

Figure 8-10. Title slide
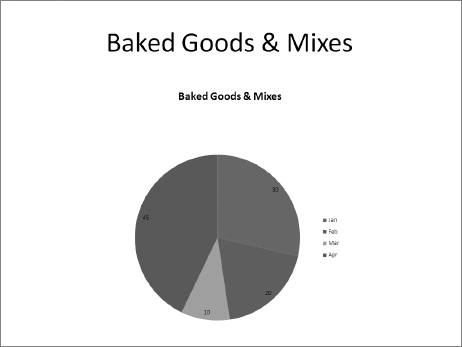
Figure 8-11. Baked Goods & Mixes slide
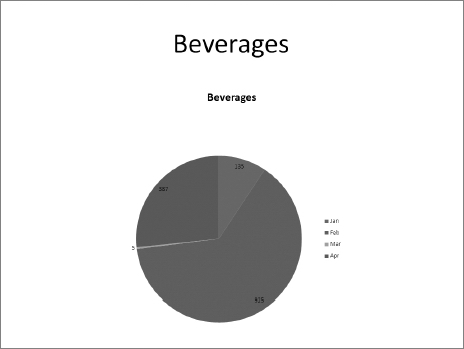
Figure 8-12. Beverages slide
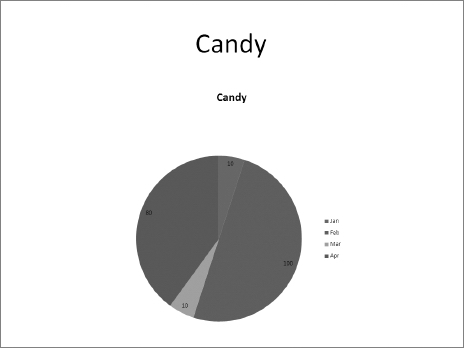
Figure 8-13. Candy slide
- Return to the Excel window.
- Click OK on the message box to finish running the code.
Very nice output, and not much more work than our Word document. If we want to include the text description on our chart slides, we can do that as well. For that, we need to do a few things differently, however.
In the previous example, we called on the Add method of the Slides collection using the following code:
Set m_oPptSlide = m_oPptShow.Slides.Add(i + 1, ppLayoutTitleOnly)
The layout type we used was ppLayoutTitleOnly, which gave us an empty slide with a Placeholder object to hold our title text. We used the remainder of the slide, which was empty, to place and size our chart. In our next example, we'll change the layout type to one that includes three placeholders: one for the title, one for the descriptive text, and one for the chart itself.
Adding Text to the Chart Slides
In this example, we'll use a different slide template for our text and chart. Figure 8-14 shows the empty template slide in PowerPoint.
Figure 8-14. PowerPoint slide template for text and chart
Let's begin coding the CreateChartSlidesText procedure. In it we will add the title text in the title placeholder. We'll put our descriptive text in the text placeholder on the left side of the slide. Finally, we'll place our chart in the chart placeholder on the right side of the slide.
- Open the VBE by selecting the Developer ribbon Code tab Visual Basic command, or press by Alt+F11.
- On the standard module containing the PowerPoint code you've been working on, create a new subroutine and name it
CreateChartSlidesText. - Add the following variable declarations:
Dim i As Integer

Dim sTitle As String

Dim oShape As PowerPoint.Shape

Dim top As Integer

Dim left As Integer

Dim height As Integer

Dim width As Integer
The first two variables, i and sTitle, serve the same function that they did in our original example. The first is a counter for our loop through our charts and text indexes, and the second will hold the title for each slide. The remaining variables will be used to hold the information for the third of the three Placeholder objects on our slide template. We'll need them in order to place the chart correctly on the slide.
- Add the following empty
For...Nextblock with one or two blank lines within the code block:
  For i = 1 To 3


  Next i
- Within the
For...Nextblock, add the following code:
Worksheets(1).ChartObjects(i).Activate

sTitle = ActiveChart.ChartTitle.Text

Set m_oPptSlide = m_oPptShow.Slides.Add(i + 1, ppLayoutTextAndChart)
This code is almost identical to our previous example—but notice the new layout type enum, ppLayoutTextAndChart. This gives us the slide template shown in Figure 8-14.
- Next (still within the
For...Nextloop), add the followingWith...End Withblock to theCreateChartSlidesTextsubroutine:
    With m_oPptSlide.Shapes.Placeholders(1)

      With .TextFrame.TextRange

        .Text = sTitle

      End With

    End With
Again, this code is very similar to our previous example, minus the variable to hold the placeholder location (sngChartStart). In our current example, we already have a placeholder for our chart, but we have to use a different technique to get its location.
- Immediately below the
With...End Withblock, add the following code:
   With m_oPptSlide.Shapes.Placeholders(2)

     With .TextFrame.TextRange

       .Text = GetSubjectBody(i)

     End With

   End With
This code sets a reference to the second Placeholder object on our slide and inserts the descriptive text from the GetSubjectBody function.
- Add the following line of code after the
With...End Withblock we just added:
Worksheets(1).ChartObjects(i).Copy
This line of code copies the current Chart object onto the Windows clipboard for later pasting into our PowerPoint slide template.
So we've got our text elements in place and our chart sitting in memory waiting to be dropped into our slide template. However, we can't just paste our chart into the third placeholder area on our template as we could with the text-based Placeholder objects. To place the chart, we have to get the coordinates of the third placeholder (top, left, height, and width). Then we remove the Placeholder object and paste in the chart, placing it accordingly.
- Add the following lines of code after the
Copycommand you just added:
    Set oShape = m_oPptSlide.Shapes(3)

    With oShape

      top = .Top

      left = .Left

      width = .Width

      height = .Height

      .Delete

    End With
Here, we are setting oShape to hold the third shape, which is the chart placeholder. Then we are storing its dimensions and location in our top, left, width, and height variables. Once we have that information, we are deleting the Shape object using its Delete method.
- Immediately after this code, add the following code:
    With m_oPptSlide.Shapes.Paste

      .Top = top

      .Left = left

      .Width = width

    End With
This code, which places and sizes the chart, is similar in function to our previous example. We are placing it in the exact location of the placeholder we just removed.
Note You might notice that although we're retrieving and holding a reference to the height of the placeholder shape, we're not using it when we place the chart. It's included here for reference. If you need to resize the height in your projects, this is how and where you'd do it.
That's it for coding our For...Next loop.
- Place the insertion point at the end of the loop and press Enter.
- Add the following line of cleanup code:
Set oShape = Nothing
Once we're done with it, we destroy the oShape object. That's the last line of code in this procedure. The finished CreateChartSlidesText subroutine should look like Listing 8-12.
Listing 8-12. Complete CreateChartSlidesText Subroutine
Sub CreateChartSlidesText()

Dim i As Integer

Dim sTitle As String

Dim oShape As PowerPoint.Shape

Dim top As Integer

Dim left As Integer

Dim height As Integer

Dim width As Integer


  For i = 1 To 3

    Worksheets(1).ChartObjects(i).Activate

    sTitle = ActiveChart.ChartTitle.Text

    Set m_oPptSlide = m_oPptShow.Slides.Add(i + 1, ppLayoutTextAndChart)


    With m_oPptSlide.Shapes.Placeholders(1)

      With .TextFrame.TextRange

        .Text = sTitle

      End With

    End With


    With m_oPptSlide.Shapes.Placeholders(2)

      With .TextFrame.TextRange

        .Text = GetSubjectBody(i)

      End With

    End With


    Worksheets(1).ChartObjects(i).Copy


    Set oShape = m_oPptSlide.Shapes(3)

    With oShape

      top = .Top

      left = .Left

      width = .Width

      height = .Height

      .Delete

    End With

    With m_oPptSlide.Shapes.Paste

      .Top = top

      .Left = left

      .Width = width

    End With

  Next i

  Set oShape = Nothing

End Sub
All that's left to do now is modify our calling procedure, MakePowerPointPresentation, and then run it.
- Navigate to the
MakePowerPointPresentationsubroutine. - Replace this line of code:
CreateChartSlides
with this line:
CreateChartSlidesText
- Place the insertion point anywhere inside the
MakePowerPointPresentationprocedure. - Click the Run button on the VBE toolbar or press F5.
- Once the message box appears, make PowerPoint the active window if it's not already.
Figures 8-15 through 8-17 show the chart slides with the descriptive text.
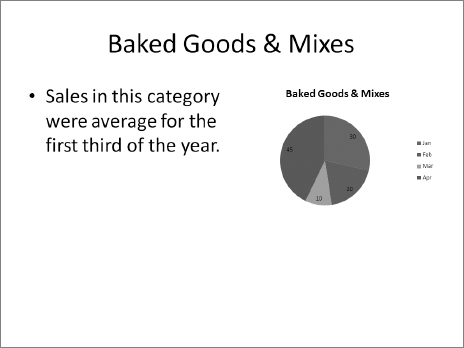
Figure 8-15. Baked Goods & Mixes chart slide with text
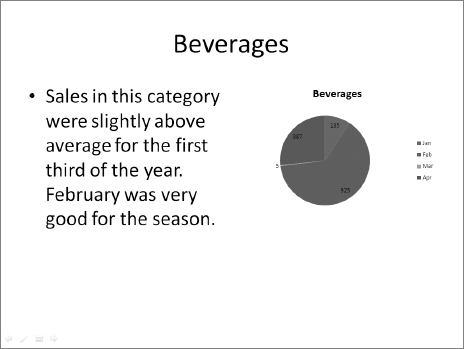
Figure 8-16. Beverages chart slide with text
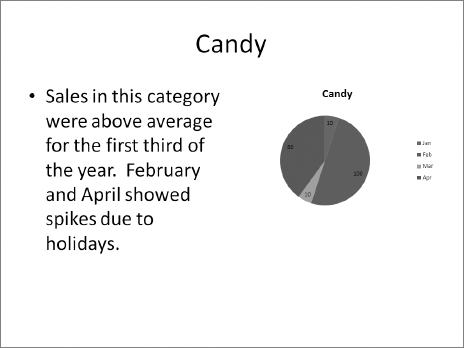
Figure 8-17. Candy chart slide with text
- Return to the Excel window.
- Click OK on the message box to finish running the code.
Summary
In this chapter, we took a look at automating other Microsoft Office products using Excel 2007 VBA. Office automation is a powerful concept that allows us to interact with Office applications for purposes of sharing information, creating documents, and creating workflow processes.
We are not limited to automating Microsoft Office products, however. Many applications support VBA, including some non-Microsoft products. For instance, versions 9 and later of WordPerfect support VBA, and Novell has added VBA support to the open source office suite OpenOffice.org (www.openoffice.org), which runs on the Windows and Linux platforms.
Throughout this book, we've explored various ways we can code in VBA in Excel 2007, and we've seen some pretty neat solutions. However, we are not limited to using code created from within the Excel VBE. We can create ActiveX components using Visual Basic (5 or 6) that we can access from our Excel projects. We can also create assemblies using the .NET Framework and Visual Studio Tools for Office, provided by Microsoft.
In Chapter 9, we will take a look at both of these tools and see how we can add functionality to our Excel 2007 projects using them.