
What the On-premises data gateway is
When a gateway is needed
How to set up the gateway
Managing the gateway
Monitoring the gateway
Troubleshooting the gateway
Role of the gateway
Power Apps
Power Automate
Azure Logic Apps
Azure Analysis Services
Many principals that apply to Power BI also apply to these other services. In this chapter, before embarking on a process of setting up the gateway, it first needs to be established if the gateway is even required.
When is a gateway needed?
The data source resides on a private network
The data source is not supported directly by the service
The data source resides on its own private network
The Power BI Service is cloud-based, meaning that it was built to run only in the cloud. The service also assumes that other services are available over the Internet. While this is true of many Platform-as-a-Service (PAAS) and Software-as-a-Service (SAAS) applications, it is not always the case with on-premises and Infrastructure-as-a-Service (IAAS) applications.
On-premise databases such as SQL Server, MySQL, and Oracle
Files and folders stored in a local file system or network share
ODBC
SQL Server installed on an Azure Virtual Machine
The data source is not supported in the service
The gateway is also required when Power BI uses a data source that is not supported directly by the Power BI Service. An example of this is the R and Python data sources. Each of these languages supports a variety of versions and libraries that are not compatible with each other, and are thus not supported in a shared infrastructure environment like the Power BI Service and require the gateway to be set up and configured on servers for this use.
Python scripts
R scripts
Web data source using the Web.Page() function
R and Python scripts are not supported on the standard gateway. Therefore they need to be set up using the personal gateway.
A full list of data sources and their need for a gateway can be found at https://docs.microsoft.com/en-us/power-bi/connect-data/power-bi-data-sources.
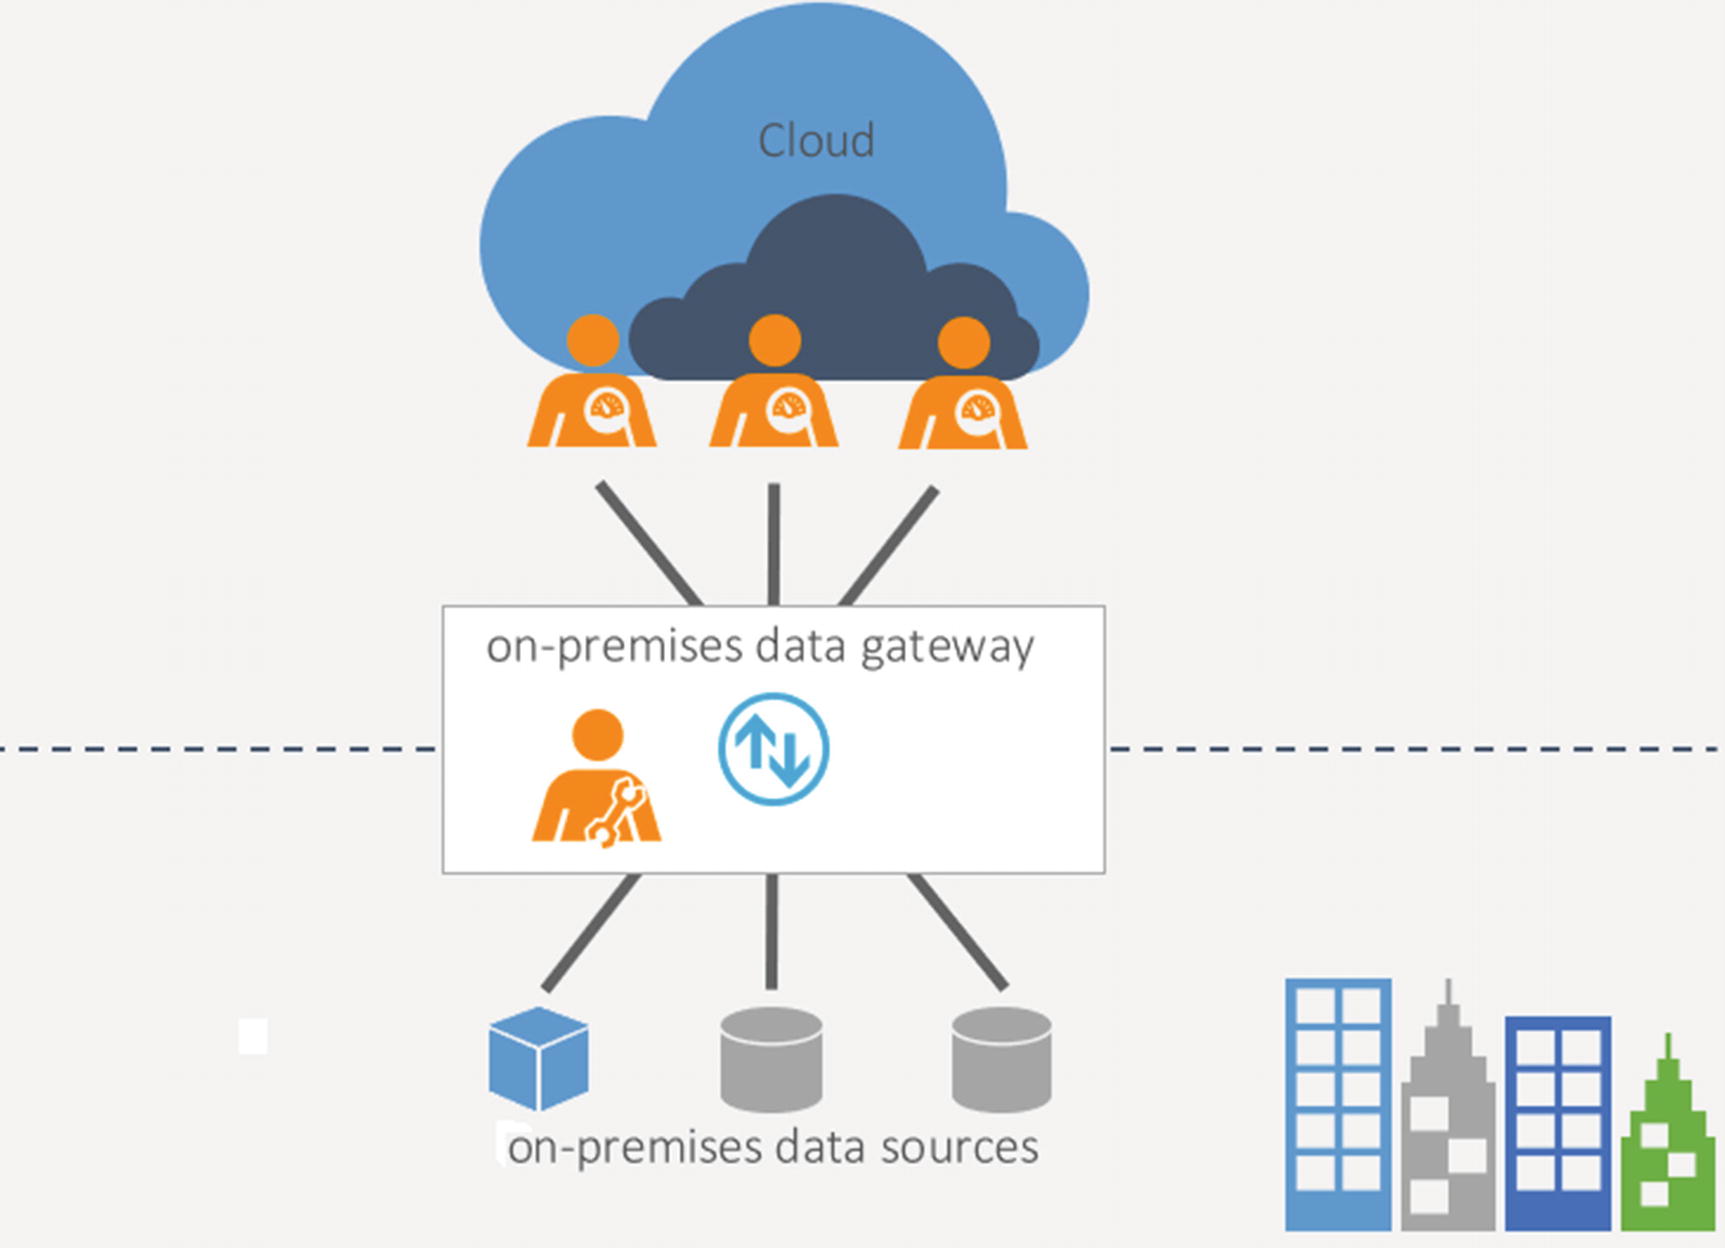
Gateway architecture
When we speak of the gateway, we usually think of the application that is installed in the organizational network. The gateway is actually a collection of applications and services that work together to facilitate the movement data. Each data movement follows a simple pattern that we discuss after we look at the components that make up the system.
Components of the gateway

Power BI gateway architecture
Gateway Cloud Service : is responsible for handling all requests for data from the Power BI Service; such requests occur during on-demand or schedule refreshes, reports using DirectQuery and live connections, and when using Power Query online such as when designing a dataflow. The gateway cloud service is responsible for scheduling data requests as well as securing the credentials used to perform the refresh.
Azure Service Bus : Provides secure and reliable messaging between the Gateway cloud service and the On-premises data gateway. This simply means that the On-premises data gateway and the Gateway cloud service never communicate directly with one another, but rather pull and push messages off the Service Bus. These messages can be requests for data as well as the results of these data requests.
On-premises data gateway : Receives requests for data over the Azure Service Bus. These requests are processed and then returned to the Power BI Service.
With a secure and reliable channel created through which data requests get submitted, we look in more detail how those requests are processed.
Typical steps for a data request
- 1.
Gateway Cloud Service receives a request for data from the Power BI Service.
- 2.
Gateway Cloud Service packages the data request together with credentials required for the query.
- 3.
The package gets placed on the Azure Service Bus.
- 4.
An available Gateway member pulls data requests securely from the Azure Service Bus.
- 5.
On-premises data gateway decrypts query and credentials.
- 6.
On-premises data gateway executes the query; this can be a DirectQuery or a Live connection query in which case it is sent directly to the data source or an import query, in which case it will invoke the mashup engine to perform the data import.
- 7.
On-premises data gateway returns the results of the request to the Gateway Cloud Service via Azure Service Bus.
This process is the same for both the standard or personal gateways.
Power BI Gateway workloads
Power BI supports three storage modes; each storage mode stores and queries data differently and, therefore, has different data access requirements. The first storage mode is called import mode and is a cached model, meaning that it imports and stores data. When a report uses import mode, Power BI imports all the data it needs into its own internal storage called Vertipaq engine using a process known as the mashup engine which executes the Power Query commands. When users interact with reports, the reports generate queries against the xVelocity engine. The other two modes are called direct and live storage modes. We refer to these two modes collectively as the non-cached modes. In the non-cached modes, Power BI generates queries for each visual that needs to render at the time of the report execution, meaning that there is no need for periodic refreshing of the datastore.
The gateway enables the data movement requirements for all workload types in which the data is not available in the public cloud. Each workload type consumes CPU, Memory, and network differently. Therefore a gateway that is optimal for one workload type may not be ideal for another.
A full list of data sources, their support for the gateway, and support for live connections and DirectQuery is found at https://docs.microsoft.com/en-us/power-bi/connect-data/power-bi-data-sources.
Cached workloads
Cashed datasets are the most common workload types in Power BI and include all reports built using an imported data source as well as all dataflows. In a cached dataset, all data, defined by the source queries (written in Power Query) are imported and stored in the model first. This transformation, performed by the mashup engine, is the same process used by Power BI desktop. The dataset needs to be loaded first before it can be queried and needs to be periodically refreshed for the report data to remain current. Because cached datasets store data in their internal data store, they tend to be much larger than non-cached datasets that store only metadata. When a cached dataset is refreshed, the required processing commands are sent from the Power BI Service to the gateway. Each request is then processed in three distinct steps.
Connect
Before the gateway can transform data, it first needs to connect to and download the data sources. Before connecting the gateway retrieves the authentication credentials required to connect to the data source; these credentials are securely stored in Azure Key Vault, which can be used to securely store keys and other secrets.
You can read more about Azure Key Vault at https://azure.microsoft.com/en-us/services/key-vault/.
Integration with Azure Key Vault is seamlessly built into the Power BI Service and does not need to be managed by the organization or administrator. With the authentication details, the gateway can then authenticate against the data sources using one of many authentication protocols, including OAuth, basic or Windows authentication. Once the data has been securely copied to the gateway, it can then be transformed.
Transform
Once the data has been loaded into the gateway, the Power Query command is executed by the mashup engine. Such commands include the creation of new columns, rows, and even tables. These operations can be very resource heavy, including the use of a lot of memory. Ensuring that data is filtered as close to the source as possible reduces the amount of data that is processed by the mashup engine. Only planning and monitoring can correctly determine the correct amount of resources required for this step. During the transform phase, data may be spooled to disk; in the event of large datasets being used, it is recommended that high throughput storage be used, such as solid-state storage.
Transfer
Once all transformations have been completed by the gateway, the result sets need to be returned to the Power BI Service either for further processing or to be loaded into either Power BI data models or dataflows. This transfer is made securely over an encrypted channel. Before transmission, the result set is compressed to reduce the amount of data that needs to be moved over the Internet. Both the compression and encryption of this data require CPU and a good network to ensure data is moved quickly to the service.
Non-cached workloads
Live connections: Connections made against an Analysis Services model; this can be a tabular or multidimensional model. Internally, Power BI also uses an analysis service tabular model, so there is no need for the service to translate the underlying DAX queries into another query language.
Direct Queries: Made against data sources that have a compatible query language and are supported in Power BI; such data sources include relational databases, Hadoop, Spark, and others. The primary reason report designers use DirectQuery is because of large data sizes or the need for near real-time results.
Both storage modes use the gateway as an agent to relay queries from the Power BI Service to their on-premises data sources. Similar to the cached dataset, the gateway fist needs to access the credentials required by the data source before opening a connection. There is no transformation step involved, so the mashup engine is not invoked. The result set for the query is compressed and encrypted. Non-cached workloads, therefore, do not have the same requirement for large amounts of memory, but a good CPU and network connectivity are vital as these directly affect report performance.
On-premises data gateway modes
The gateway is available in two modes; each of these modes has a different target audience. The gateway installed in standard mode is the recommended gateway mode; this mode was initially known as the enterprise data gateway as it made more of the features that enterprises are looking for. The second mode is called personal mode and was designed for users who need to easily set up gateway but are not very concerned about the availability of the gateway.
While it is possible to install both a standard and personal gateway on a single computer, this is not generally recommended as both gateways will consume the same resources which may result in poor performance.
Personal gateway
The personal mode gateway exists primarily as an easy to configure and run version of the gateway. There are instances where it is required over the standard gateway. In personal mode, the gateway is installed as a user application. As a user application, local administer rights are not required, and the application runs under the identity of the user who executed it. By running as the user, the gateway mostly has access to everything that the user has access to, making setup and configuration easy. This is useful, as many organizations do not grant local administrator rights to users on their computers; configuring additional service accounts and granting those accounts access to the data source are also something that users are not able to do without the help of IT. This lower barrier to entry makes the personal gateway ideal for developers and other power users.
The personal gateway can only be used by the owner of that gateway. The use of that gateway is also dependent on that gateway being available. If it has been installed on a laptop or similar type device, then it is unavailable while the machine is in sleep mode or has been disconnected from the network, including any required VPN connections.
Easier to set up
Supports sources such as R and Python that are not supported in the standard gateway
Easy to use permission as the application runs under users account
No support for High Availability
Can only be used by a single user
Does not support other Power Platform applications such as Power Apps and Power Automate
Does not support Dataflows and Paginated reports
For instructions on how to install the personal mode On-premises data gateway, go to https://docs.microsoft.com/en-us/power-bi/connect-data/service-gateway-personal-mode.
When reports are promoted to a production-like environment, ensuring access to the gateway becomes very important, if not critical. In these instances, the personal gateway is not sufficient, and a reliable version of the gateway is required; this is where the standard gateway comes into play.
Standard gateway
The standard gateway was built to provide a reliable gateway for use throughout the entire organization. The Standard gateway is the recommended gateway mode for use for anything that is deemed “in Production.”
Don’t set up a single gateway to be shared by development, testing, and production. Instead, set up three separate gateways. This will avoid any impact that test and development may have on production and allows you to test new versions of the gateway before upgrading your production environment.
Unlike the personal gateway, the standard gateway is installed as a service, preferably on dedicated machines running windows server. The standard gateway supports clustering and load balancing, helping organizations ensure reliable and consistent performance, making it the preferred choice for production workloads.
As a service, the standard gateway will run under its own local account; by default, this is NT SERVICEPBIEgwService. This service account can be changed to another local or domain service account.
Supports gateway members running in a cluster for high availability.
Report load can be distributed across nodes in the cluster.
Support for DirectQuery and Live Connections.
Supports dataflows.
Supports Paginated reports.
Can be used by multiple users.
Often requires members of the IT department to install.
Service account required for windows authentication SSO through Kerberos to be used.
Does not support R and Python; therefore there is no high availability option for these data sources.
For instructions on how to install the standard On-premises data gateway, go to https://docs.microsoft.com/en-us/data-integration/gateway/service-gateway-install.
Regardless of which gateway mode is installed, the underlying architecture of the gateway remains the same.
High availability and scaling workloads
When Power BI is being used to support business-critical reporting, it is essential that the service be reliable and available. High availability in the Power BI Service is managed by Microsoft, but ensuring the availability of the gateway falls on the organization and the gateway administrators.

Gateway cluster
The creation of a gateway cluster is straightforward and does not rely on technologies such as Windows Failover Clustering to work. All gateways setup in standard mode are actually created as clusters of one member. We will discuss how to set up the gateway and clusters later in this chapter.
CPUUtilizationPercentageThreshold: This is the maximum amount of CPU that the gateway can consume while still accepting data requests. A value of 0 indicated that throttling does not take place.
MemoryUtilizationPercentageThreshold: This is the maximum amount of memory that the gateway can consume while still accepting data requests. A value of 0 means that there will be no throttling.
ResourceUtilizationAggregateionPeriodInMinutes: This number sets the time that the memory and CPU are aggregated by. This is important, especially in the case of CPU, where short bursts of 100% CPU usage are common on an otherwise idle processor . The default is set to 5 minutes; this effectively means that if one of the threshold values is breached, then the gateway will not accept new requests for at least 5 minutes.
See the section on configuration on how to adjust these settings.
When these limits are breached, the gateway will not accept any requests until this value falls below the threshold. If none of the gateway nodes in the cluster are able to process the data request, then the request fails.
Removes a single point of failure.
Requests can be distributed among all gateway nodes in the cluster, ensuring balanced workloads.
By updating only a single node at a time, the administrator can ensure that the clusters remain online.
With a little theory about the gateway architecture complete, next , we can look at how to set up the gateway.
Setting up the On-premises data gateway
Unlike most of the infrastructure used in Power BI, gateway administrators or users are fully responsible for setting up and maintaining the gateway. It is essential that administrators set up the gateway correctly to ensure that reliable and timely data requests are performed.
Users will often install the personal gateway on their own personal devices. While this is unlikely that these setups conform to best practices, this may be all right for these occasional ad-hoc users. Plus ensuring that standard gateways are correctly configured and maintained is one of the primary responsibilities of the gateway administrators. We begin by looking at some of the requirements for the gateway.
Requirements
At the time of writing, the Power BI gateway requires a compatible windows 64-bit operation system, which can be at least Windows 8 or Windows Server R2 with .Net 4.6 installed. Newer versions of the gateway require .Net 4.7.2. It is recommended to check on the minimum versions of both the .net framework and OS before installing the gateway. This does mean that unsupported OSs such as Linux will not work, and it is not uncommon to find a lone Windows machine in a predominantly Linux environment set up to act as the gateway.
Windows x64 (Windows 8 or Windows Server 2012 R2).
.Net 4.6.
Cannot be installed on Windows Core.
It can be run in a virtual environment.
The machine cannot be a domain controller.
Sizing
8-core CPU.
8 GB of memory.
Solid-state drive.
Where possible, install the gateway on a dedicated computer.
Although it is possible to install a gateway in both personal and standard mode on a single computer, this is not recommended.
These are only recommendations by Microsoft, and computers that do not meet these requirements may still work, but should be tested first. These recommendations should be used as a starting point, and the computer can be upgraded if necessary. It is also important to consider the workload type. For example, in environments that use only DirectQuery or Live Connections, the gateway computers may not need as much memory or a solid-state drive, as these workload types do not consume as many resources. When import mode is used, however, ensuring that there is enough memory available helps avoid writing the content of the data transformations to disk while the mashup engine is transforming it. It should also be considered that multiple datasets may be refreshing at the same time, meaning that two, three, or more times the amount of memory may be required compared to using Power BI Desktop to load data.
Installing the gateway in a virtual machine gives you the flexibility to resize the computer when necessary.
Placement
In addition to the computer that the gateway is installed on, how the computer is connected to the network plays a big role in the overall performance. In both cached and non-cached scenarios, the latency between gateway, the data source, and the Power BI Service affects report refresh and report response times. This is especially relevant on gateways setup in personal mode, that are usually installed on desktops, or even laptops that could be using a slow LAN or even a wireless network.
The recommendation for the placement of the gateway is to set them up as close to the data source as possible, and on a network with the best outgoing Internet connection possible. Administrators may be tempted to install the gateway on the physical host of the data source; this is generally not recommended, especially in the case of services such as SQL Server that may have a high per-core cost that would be consumed by the gateway.
Downloading and installing the gateway

Download Gateway installer
It is possible to download and install the gateway using PowerShell. This is a good approach in large environments where several gateways need to be installed. See the session on automation later in this chapter for more on how to use the gateway cmdlets to install power BI.

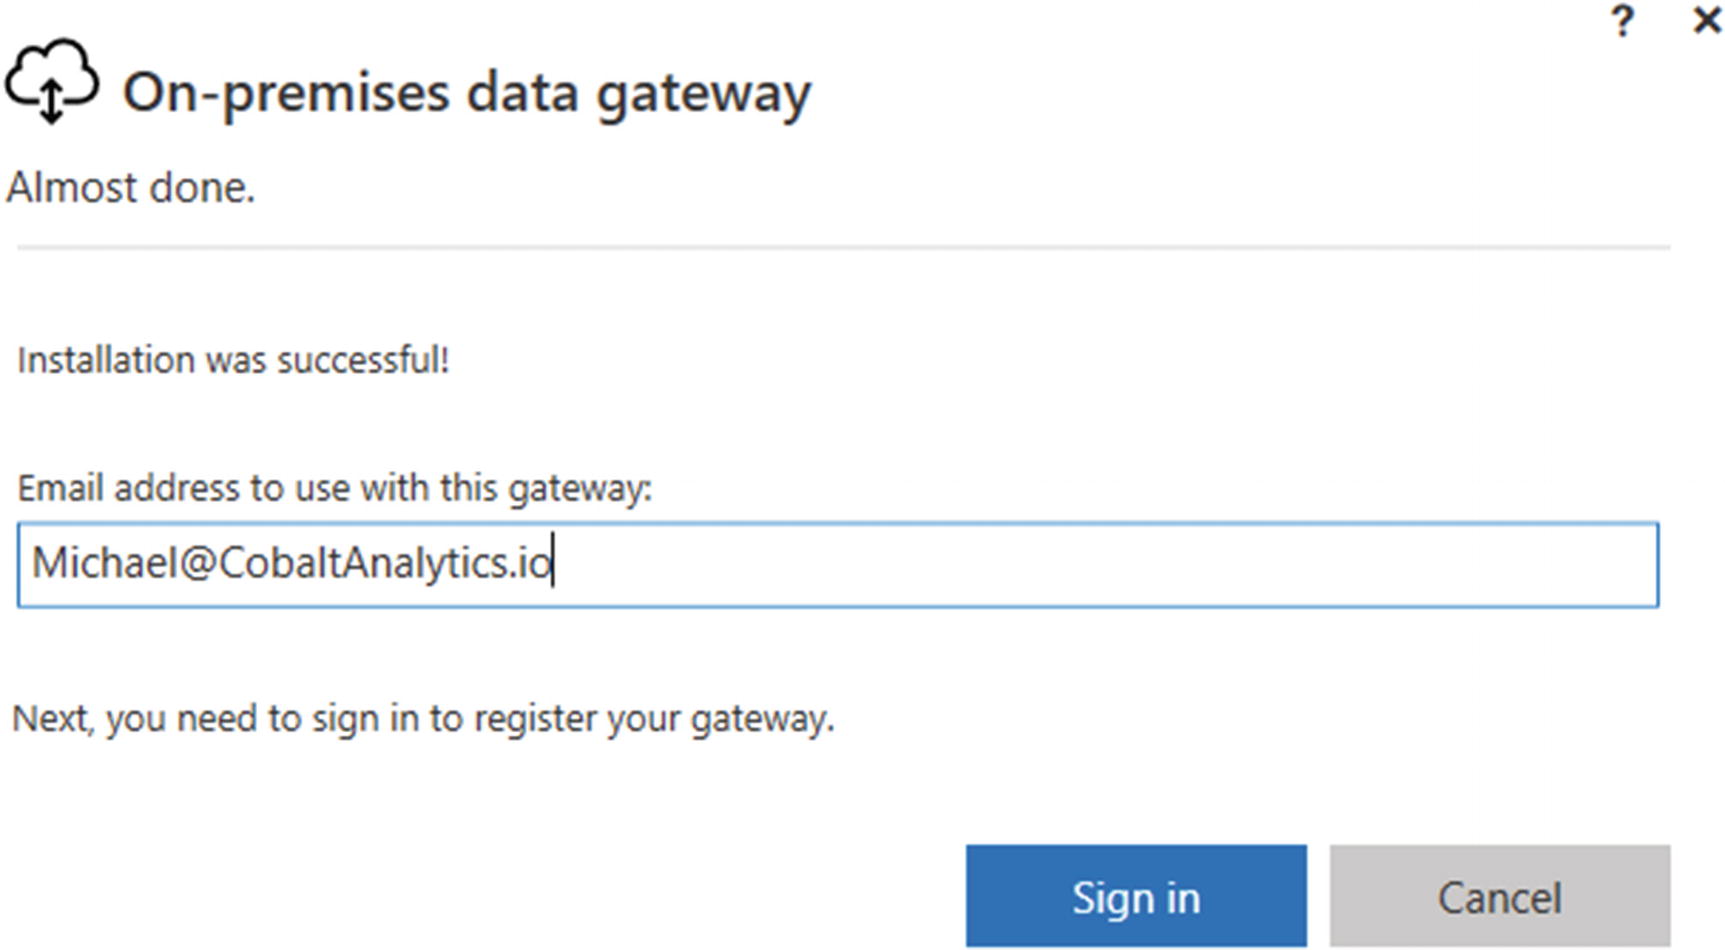
Accept terms and install folder
Once the gateway is installed, the setup wizard guides you automatically into the setup process. If for some reason, you are not ready to proceed with setting up the gateway, you are able to cancel. This does not uninstall the gateway but leaves it in an unconfigured state. This is the same state that that the gateway is left in when installed via PowerShell.
Configuring the gateway

Open the On-premises data gateway configuration screen
Login with Gateway administrators account
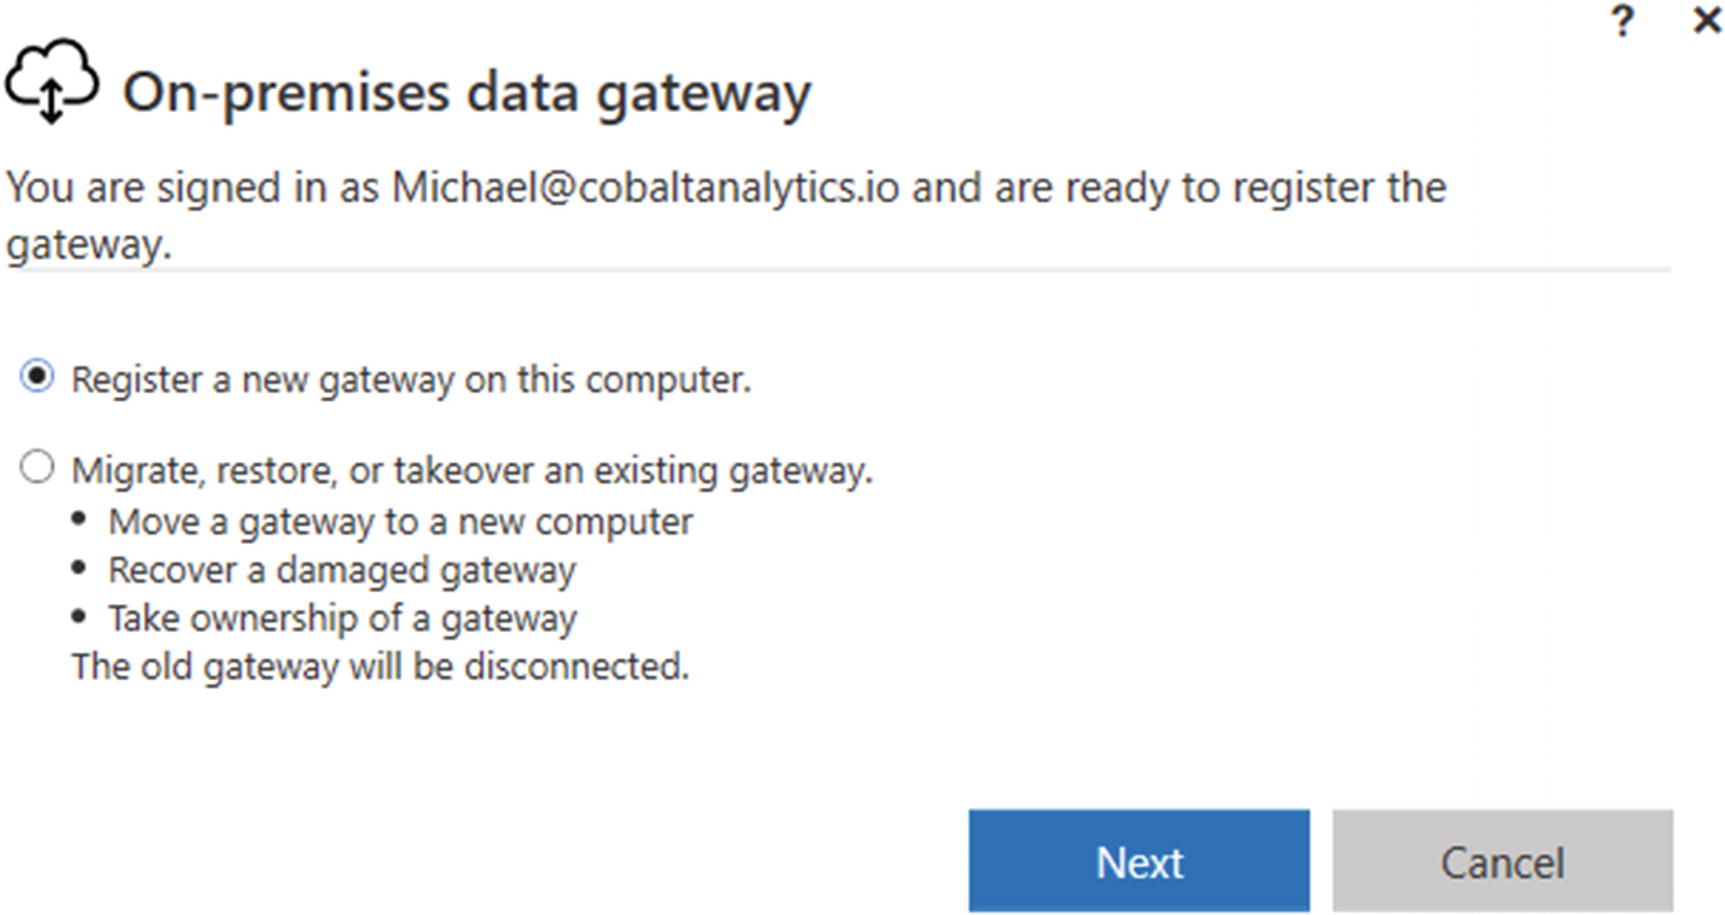
Main setup options
Register a new gateway on this computer: You choose this option if you want to create a new gateway cluster or if you want to add a new member to the cluster.
- Migrate, restore , or takeover an existing gateway: You choose this option if you want to
Move a gateway to a new computer: If you need to move the gateway from one computer to another, then you can use this to do so. This is particularly useful when the gateway is offline and cannot be recovered. An alternate approach to this is to add a new member to the cluster, make the new member the primary member, and then remove the old member. To do this, the primary member must be online.
Recover a damaged gateway: If the gateway has been damaged, then this option can be used to get the gateway online again.
Take ownership of a gateway: If the gateway was installed using an account that should not be a gateway administrator, then this can be used to change the account associated with this gateway.
Register a new gateway on this computer
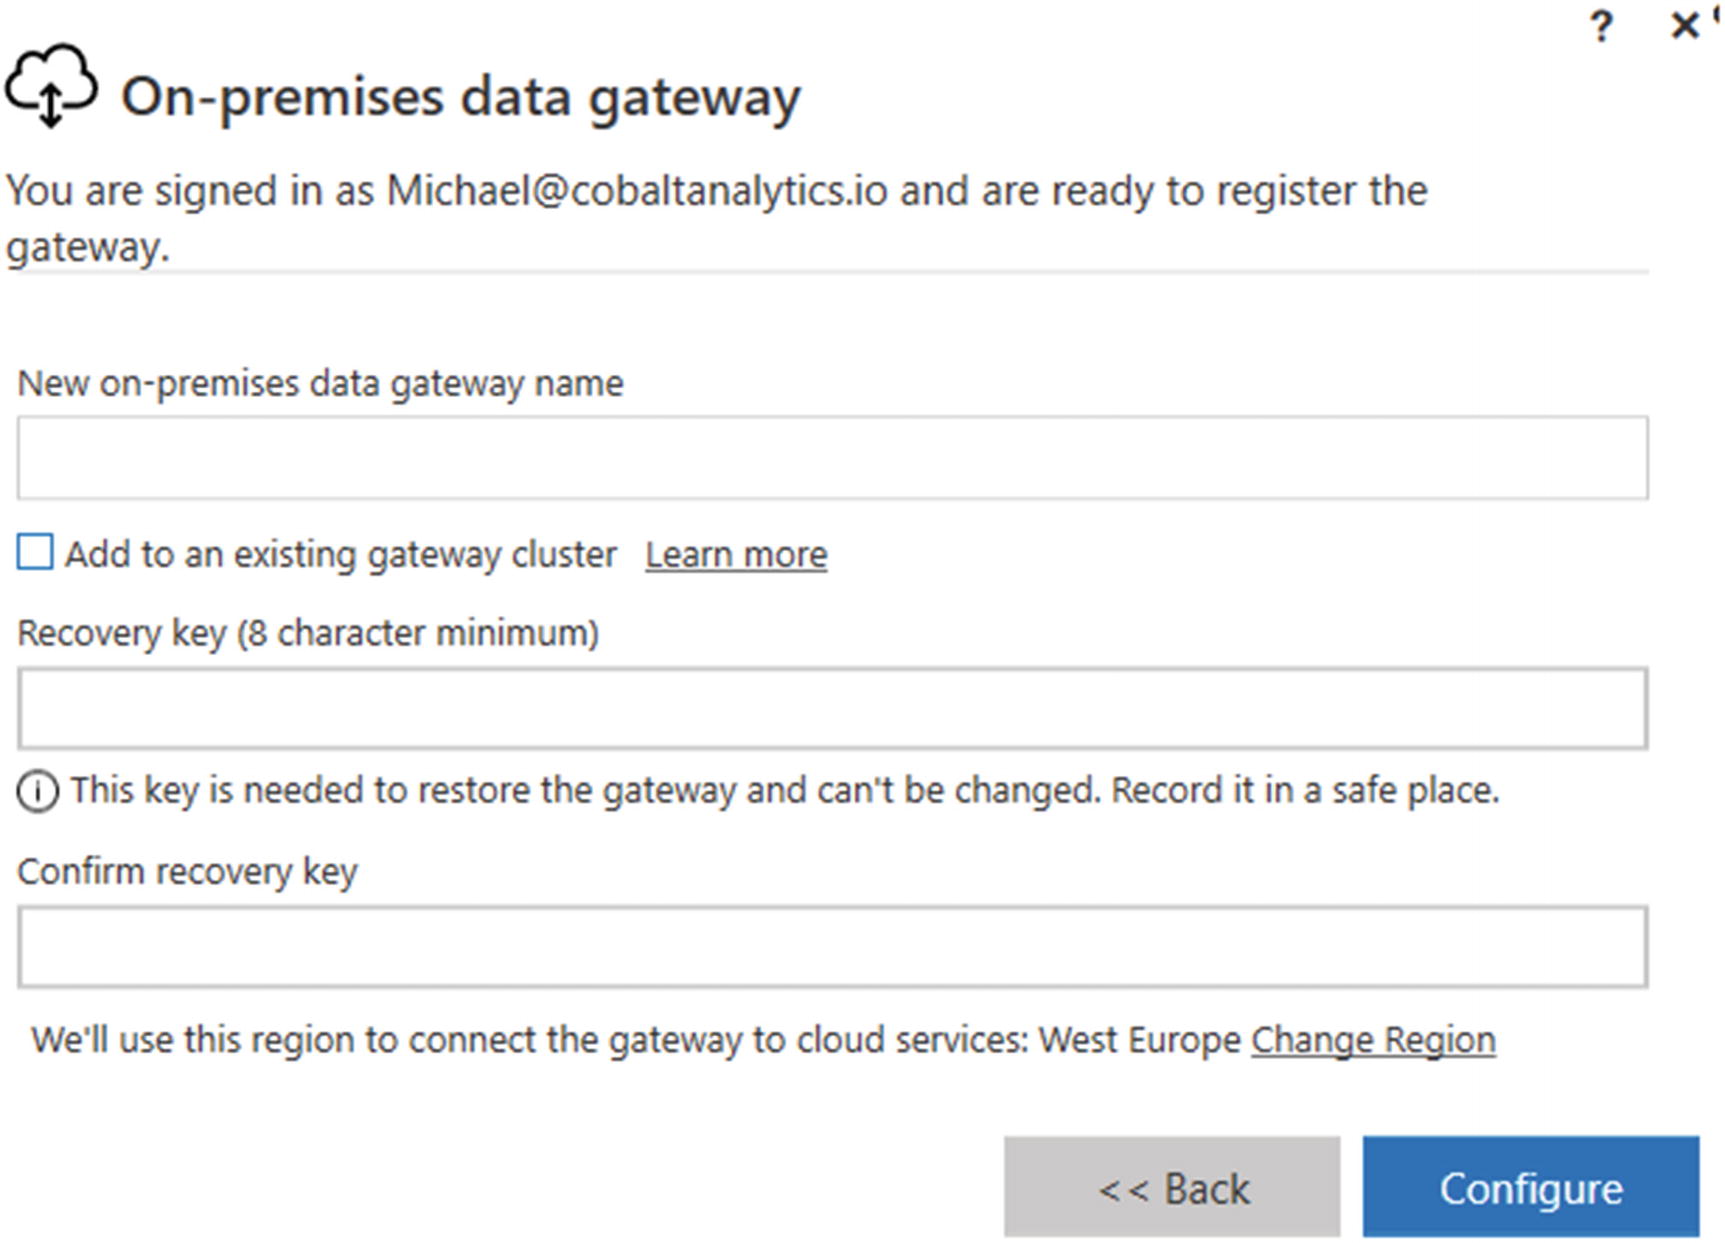
Configuring a new Gateway cluster
The recovery key is required for additional nodes to be added to the cluster, repair the cluster member, and/or to upgrade the gateway. Ensuring that this key is recorded and kept secure is important.
if your organization does not have a secure means of storing such credentials, then you should consider using Azure Key Vault. https://azure.microsoft.com/en-us/services/key-vault/
Adding a new member to an existing cluster
Adding another gateway to an existing cluster is also a relatively straightforward task. Again you are asked to provide a name for the gateway. You will then enable the “Add to an existing gateway” option that returns a list of existing gateway clusters that the user is an administrator for.
- 1.
Capture the new name of the cluster, again applying the organization naming convention.
- 2.
Enable “Add to an existing gateway.”
- 3.
Select the gateway cluster to add the new node to.
- 4.
Provide the recovery key used for the gateway cluster.
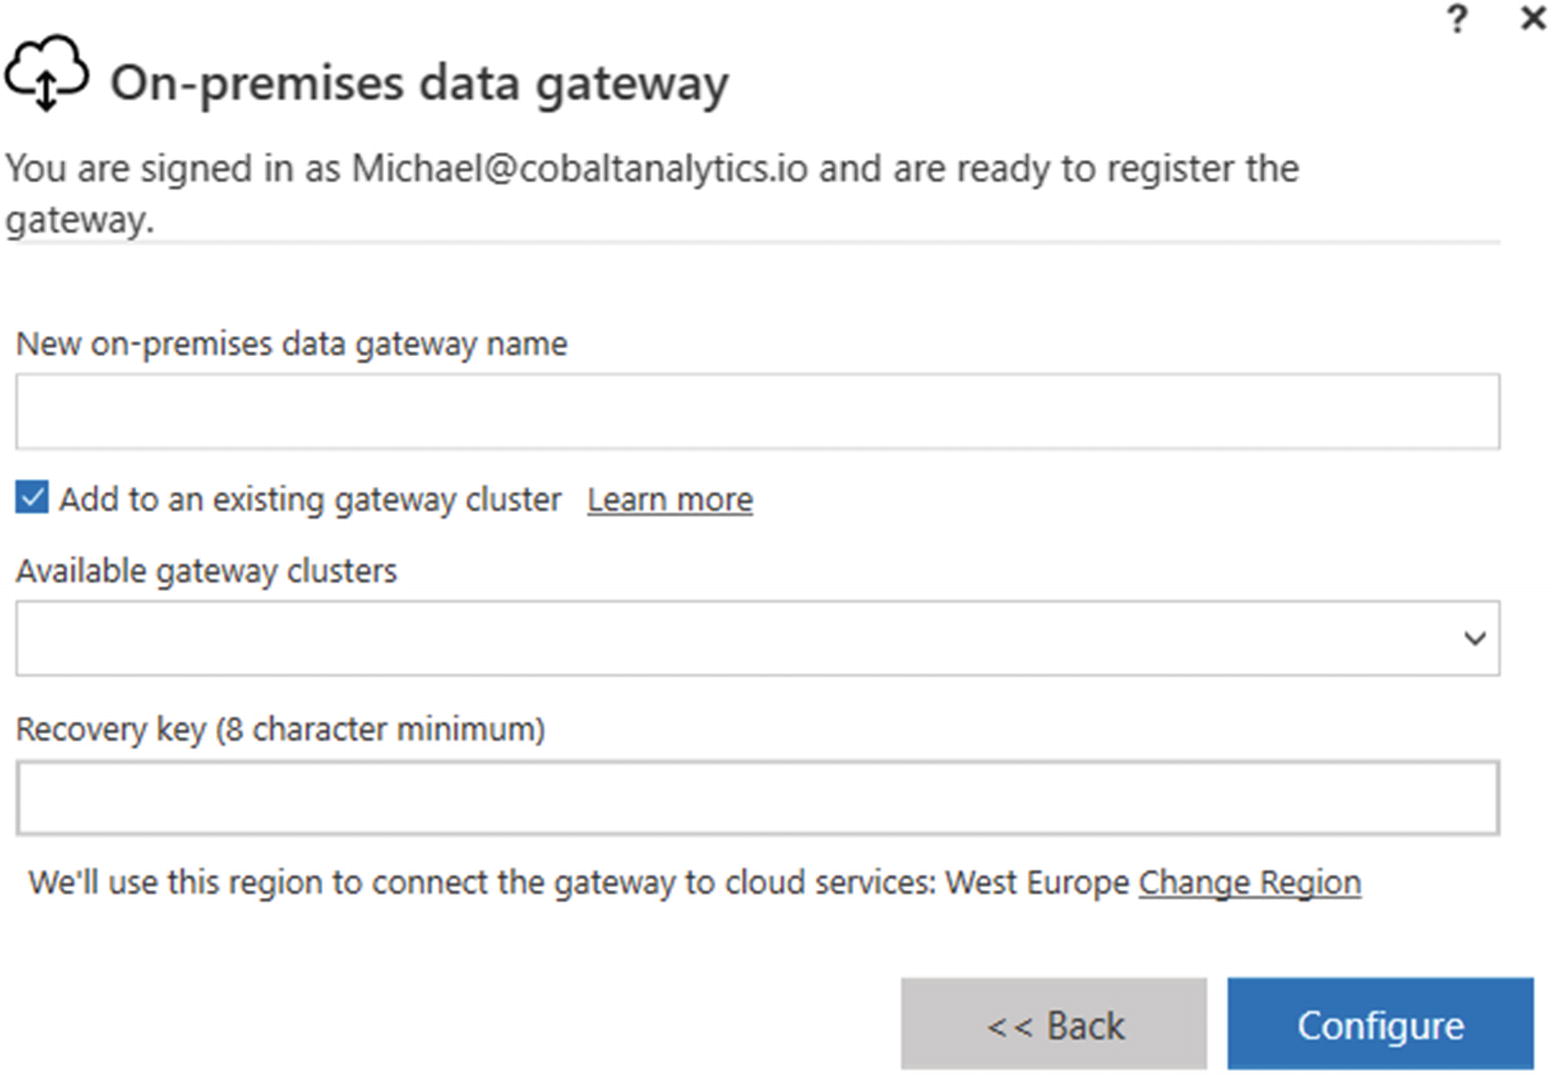
Adding a gateway to a cluster
Network connectivity
The Power BI gateway requires connectivity to the Internet. By using the gateway, Power BI removes the need to allow incoming connections; these are connections that originate somewhere on the Internet and would need to pass through the corporate firewall. For good reasons, most organizations prohibit such connections. Instead, the gateway makes an outgoing connection to the Power BI Service via the Azure Gateway Service and uses Azure Service Bus as a messaging system.
Depending on how the setup of your network is configured, you may need to request that the firewall administrator open up certain ports and URLs to allow outgoing connections. This is common in secure environments such as banks and other regulated environments. All traffic passes through port 433, and a list of URLs can be found at
https://docs.microsoft.com/en-us/power-bi/admin/power-bi-whitelist-urls

Testing network access for the gateway
There is an option to run a network diagnostic assessment that will let you know of any problems.
If your organization uses a proxy to access the Internet, you can read how to configure that here https://docs.microsoft.com/en-us/data-integration/gateway/service-gateway-proxy.
Updating the gateway
New versions of the gateway are often released, and the administrator must ensure that these are kept up-to-date. New releases of the gateway not only provide performance and security enhancements but also enable new functionality by updating the gateway to use the latest mashup engine that may be required by datasets built using the latest version of the Power BI desktop application.
It should be noted that the gateway becomes unavailable for at least the duration of the upgrade and possibly longer if issues are experienced, so upgrading the gateway should only be done during approved windows for business-critical workloads. If the gateway is installed as part of a gateway cluster, then this upgrade procedure is simpler as each node in the cluster can be upgraded independently of one another, reducing the risk of an outage. It is recommended that you first upgrade one of the non-active nodes in the cluster first.
As the personal gateway does not support clustering, all updates result in some downtime.
Data sources

Add or remove a data source from the gateway
The option to add a data source or remove the gateway can be hard to find as ellipses (…) only show when hovered over at the end of the gateway pane.

Configuring a new data source
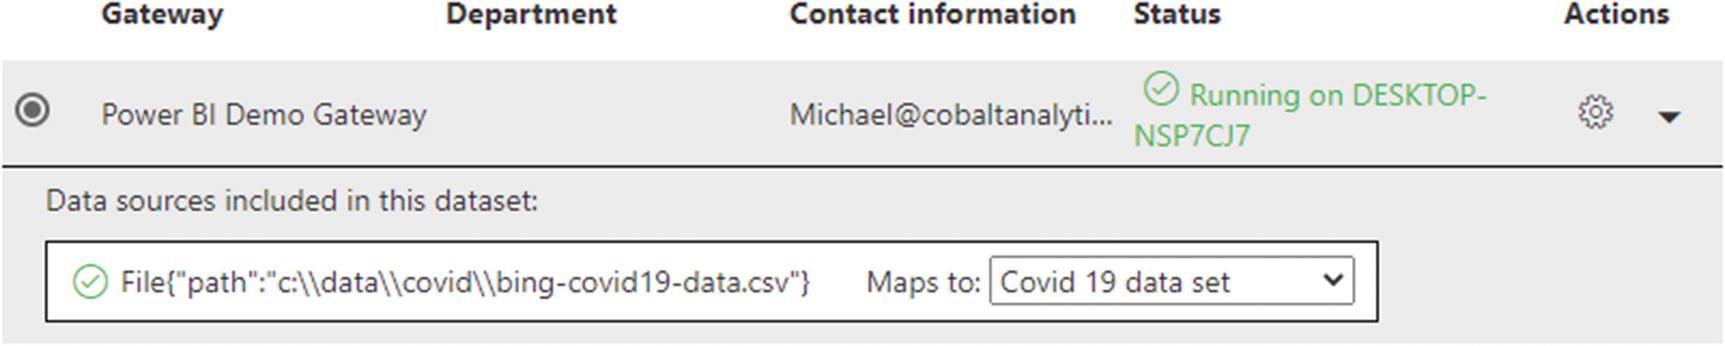
Mapping data sources in the gateway

Adding a user to a data source
These users can configure reports that they manage to use the data source without requiring authentication details, providing an additional separation of responsibilities, and allowing the gateway administrator to change authentication details without requiring the report owners to take any actions.
Custom connectors

Configure folder for custom connectors
During report development, the report designer will download or sometimes create their own custom connector. The custom connector uses a .Mez file extension and is placed in a particular folder, usually in the user’s personal folders. Something like c:usersUserNameDocumentsPower BI DesktopCustom Connectors. Unlike custom visuals, the custom connector is not embedded into the.PBIX file itself. For the custom connector to work during data refresh, it needs to be available to each of the gateways. This means creating a folder on each host and ensuring that a copy of the correct .Mez file is available.
Custom connectors can be used to execute malicious code or can result in data being compromised. Custom connectors should only be used from a trusted source.
Monitoring and troubleshooting
General health: Monitoring the general health of the gateway involves monitoring not only the use of CPU, memory, disk, and network but also the number of queries being processed by the gateway. Such monitoring activities are often performed in near real-time for early detection of potential issues.
Query performance and troubleshooting: Monitoring the general time taken for specific queries, groups of queries, or data sources to return as well as the frequency of failed queries and timeouts. Such monitoring is often not performed in real-time and may only be evaluated periodically or in the event of errors.
General health
CPU
Memory
Disk
Network
No application can function at its optimal level if any of these resources is in short supply. In addition to the four primary resources, a good general health monitor will watch out for other signs that the system is under strain or if there are other problems. In the case of the gateway, this could include query timeouts or failures. For a quick understanding of the four primary resources, many users and administrators use Task Manager.
Task Manager
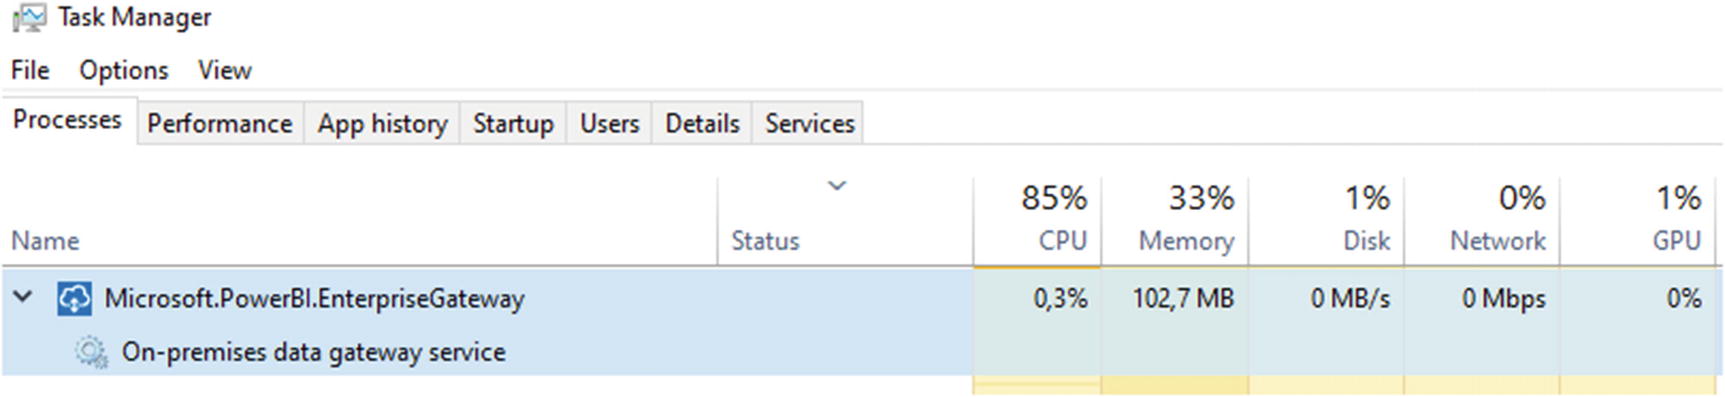
Viewing gateway performance using task manager
While Task Manager is simple to use, it is not a suitable candidate for reliable monitoring as it required the administrator to be logged into the terminal and monitoring the system. This is impractical for continued usage; instead, Performance monitor provides a better functionality.
Performance Monitor

Setting up a performance monitor collector set
One of the core reasons for collecting these counter values is to build a baseline for the cluster. A baseline is simply an understanding of what the computer’s resource usage looks like when it is stable. This becomes important during times of crisis when the administrator needs to identify the source of a problem. If you understand what the expected or baseline values are, then it becomes easier to determine if there is a problem. An example of this is finding out that the gateway is consuming 80% of the CPU; this simple measure by itself does not tell you if something is wrong, but if this measure is usually at 40%, then that is an indication of a problem and it should be investigated. It is also good to be able to identify failing queries before users start to complain.
Both the system counters and the gateway counters can be collected into a single data collector set allowing you to build reports and alerts; next we will look at some of the important system and gateway-specific counters.
Important system counters
Processor(_Total)\% Processor Time: This counter tells you how busy the server’s CPU is. Like all counters, there are no golden numbers that will indicate a problem, and the CPU spiking to 100% for short durations is perfectly acceptable. When the average CPU usage rises above 80%, then there is likely a cause for concern.
SystemProcessor Queue Length: This counter tells you how many threads are waiting for the processor; any number greater than 0 is an indication that the CPU cannot keep up with the current workload.
MemoryAvailable Mbytes: This counter measures the amount of free memory on the server. Memory is a valuable resource, and it is essential to ensure that there is enough free memory available to handle requests. When there is not enough memory available, the server pages some of that memory to disk, which is much slower than a memory. Ideally, this number remains greater than 0.
Paging File(_Total)\% Usage: When the operating system runs out of memory is begins to swap data out to disk. Moving data out to disk is several orders of magnitudes slower than those same operations happening in memory, so you want to avoid this happening at all if possible. If this is happening, add more memory or add more members to the cluster to distribute the load.
PhysicalDisk(_Total)Avg. Disk sec/Read and PhysicalDisk(_Total)Avg. Disk sec/Write: This counter reports the number of read and write operations that are happening on the disk.
Network interfaceBytes total/sec: This counter indicates the rate at which the network adaptors are processing data. This number should remain below 50-60% of the sustainable bandwidth of the network.
On-premises data gateway counters

Getting a full list of gateway counters
# of all queries executed/sec: This counter will give you a count of the number of queries executed per second. If your organization uses only imported datasets, then this number will likely be small. For reports that use DirectQuery and live connections against on-premises data sources, this number can be a good indication of heavy use.
# of queries failed/sec: Any number greater than 0 should be investigated as it may be cause for concern and indicate problems with the source system. Timeouts against the production OLTP system can be an indication report beginning to affect the operations of the system.
# of items in the Service Bus pool: The gateway uses Azure Service Bus to send data requests to the gateway reliably; this counter lets you know if the gateway cluster can satisfy all incoming requests. There is no golden value here, and each environment will differ, which is why baselining this value is important. If this number begins to climb, it is an indication that more queries are being sent to the cluster than the cluster can resolve. To fix this problem, the cluster can be scaled up or out by adding more resources to the gateway computers or adding more members to the cluster. Additionally, the developer can be asked to look for more efficient ways to query the data. (Dataflows could be an appropriate solution.)
Adding additional nodes to the cluster may be meaningless if the “Distribute requests across active gateways in the cluster” is not enabled, as queries will not scale beyond a single node.
Troubleshooting
Power BI alerts: Data sources should be configured to notify administrators when errors occur.
Monitoring: Administrators may detect errors or degraded performance from their general health monitoring.
Users: Report users may also contact the administrators directly or via a contact center to notify them about problems in the system.
Does the problem occur consistently?
Is there a problem with a particular data source, source system, or gateway?
Are all the gateways running the latest version of the On-premises data gateway software?
How does the current gateway throughput compare to known benchmarks?
Here we look at some of the tools available to help the administrator troubleshoot some of these problems.
Refresh history

Dataset refresh error details
Event logs

View application events in the event log
Gateway logs
- 1.
Launching the On-premises data gateway app.
- 2.
Login (you must be logged in to view the logs).
- 3.
Navigate to the Diagnostics.
- 4.
Select export logs.
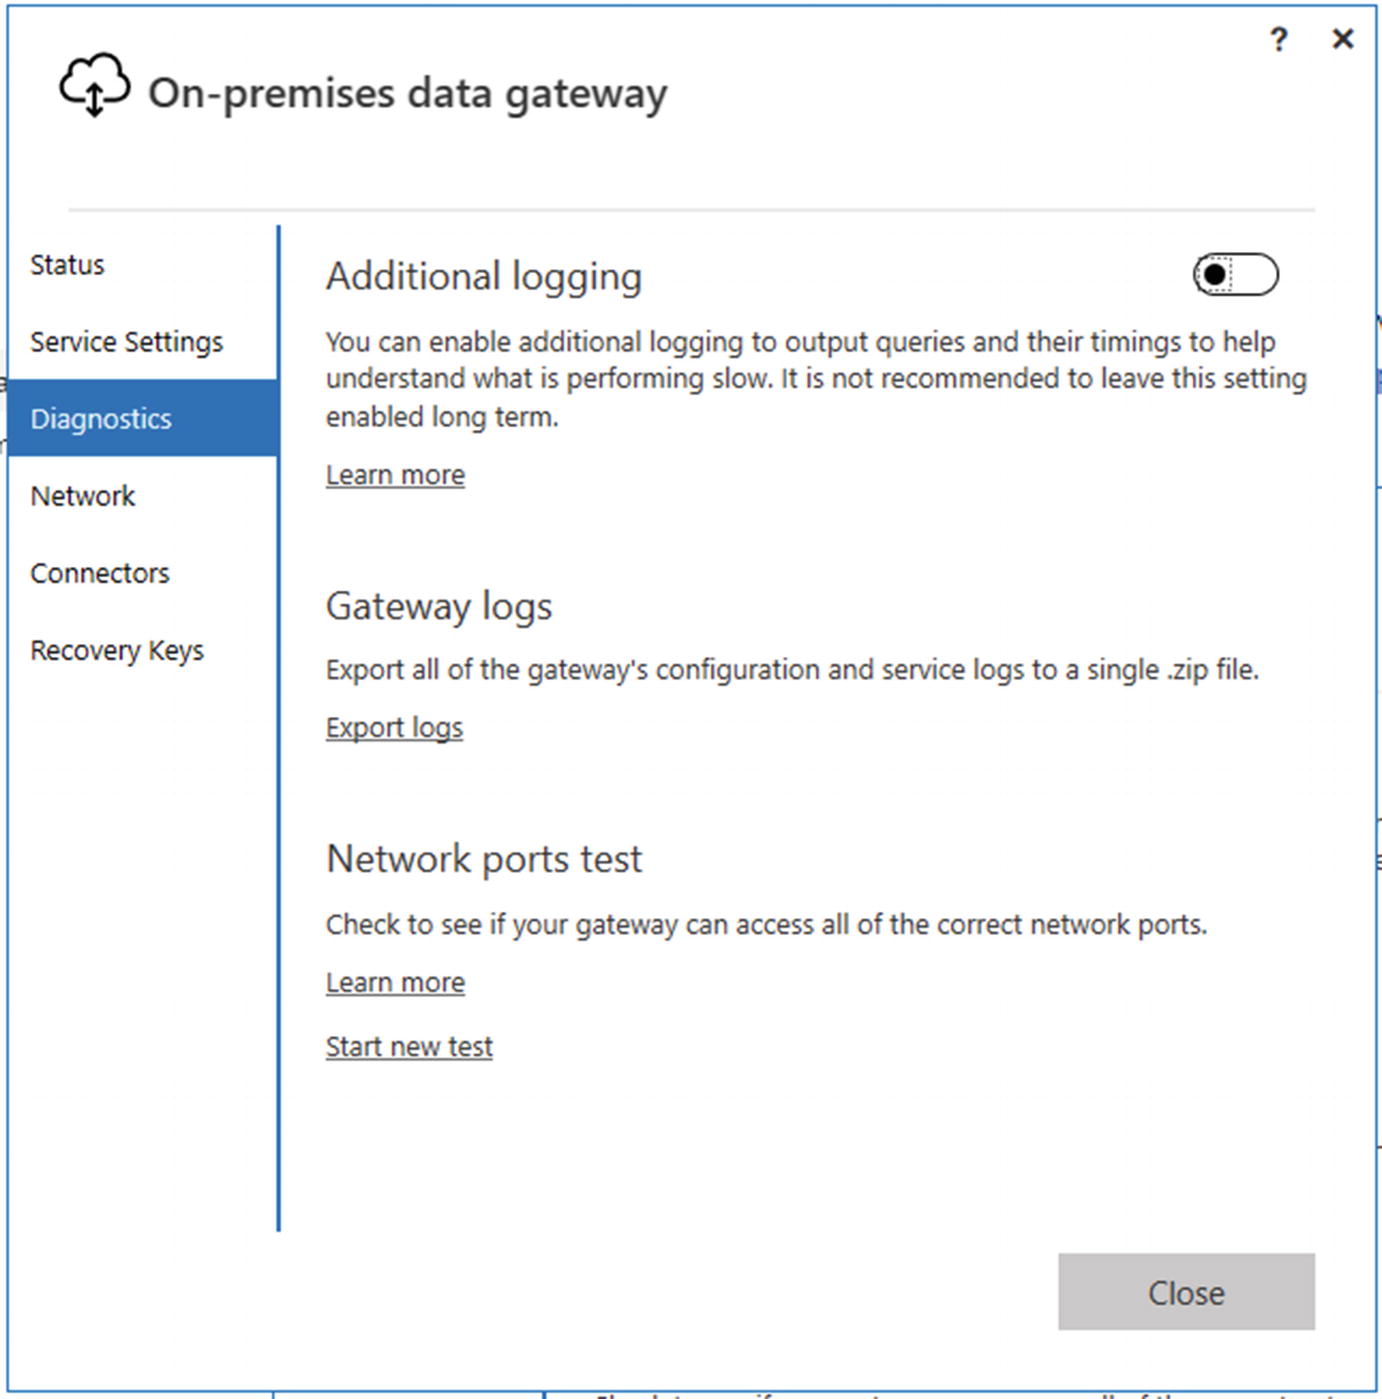
Exporting gateway logs
UsersPBIEgwServiceAppDataLocalMicrosoftOn-premises data gatewayReport
WindowsServiceProfilesPBIEgwServiceAppDataLocalMicrosoftOn-premises data gatewayReport
By default, these logs only capture error information. However, it is also possible to capture detailed query execution details and performance counters. The detailed execution report has a wealth of information on which queries are failing or how long they take to complete. The Performance counters are the same as the Performance Monitor counters. To enable the additional logging, you need to manually update the configurations file

Update Config file
- 1.
Navigate to Service settings.
- 2.
Select Restart now.
To make analyzing these logs easier, Microsoft has created a Power BI report template that you can use to connect to these logs. At the time of witting, this report was still in preview, but as a template, you are able to modify it to meet your needs.
Additional logging

Enable additional logging
Like the performance logging options, the gateway needs to be restarted, so you need to consider this before enabling it during a critical time. This level of logging is also likely to cause additional load on the gateway and computer that it runs on, so leaving the gateway in this mode is not recommended.
Automation
The DataGateway Cmdlets also require PowerShell core 6.2.2 or greater, which is a different implementation of PowerShell than the one used by the Power BI Cmdlets.
Getting a list of gateways
Returning the cluster status
Removing nodes from the cluster
Adding new data sources to the cluster
Deleting the entire cluster
The cmdlets can be broken down into four categories.
Cmdlets to manage policies
Get-DataGatewayInstaller: Lists users authorized to install and register gateways within the tenant
Get-DataGatewayTenantPolicy: Returns the gateway installation and registration policy for the tenant
Set-DataGatewayTenantPolicy: Updates the installation policy used in the tenant
Cmdlets to manage gateway clusters and members
Get-DataGatewayCluster: Lists all gateway clusters for the current user or a specific one based on the passed parameters
Get-DataGatewayClusterStatus: Returns the cluster status along with additional properties
Remove-DataGatewayClusterMember: Removes a gateway member from the corresponding gateway cluster
Set-DataGatewayCluster: Sets properties for an existing gateway cluster.
Cmdlets to manage users
Add-DataGatewayClusterUser: Add a user to a gateway cluster.
Remove-DataGatewayClusterUser: Remove a user from a gateway cluster.
Managing data sources
Add-DataGatewayClusterDatasourceUser: Adds a user with required permissions for a Power BI data source
Get-DataGatewayClusterDatasource: Lists all or selected Power BI data sources on a gateway cluster
Get-DataGatewayClusterDatasourceStatus: Tests the connectivity of a data source from the gateway cluster.
Get-DataGatewayClusterDatasourceUser: Lists users for the data source on a gateway cluster
Remove-DataGatewayClusterDatasource: Removes a Power BI data source from a gateway cluster
Remove-DataGatewayClusterDatasourceUser: Removes a user from a Power BI data source
Set-DataGatewayClusterDatasource: Sets properties of an existing Power BI data source
Summary
The gateway serves as an important bridge between the power BI server that runs in the cloud and the data sources that reside on private networks. Ensuring that the gateways remain available and perform well is crucial.
Call to action
Ensure gateway is installed in a cluster with at least two nodes.
Ensure servers with gateways installed have adequate resources.
Monitor resource usage and query performance.
Install the gateway cluster as close to data sources as possible.
Ensure distribute requests across active gateways in the cluster is enabled; this needs to be done in the gateway admin portal in the service.