Monitoring Power BI activities
Monitoring Power BI inventory
Monitoring Power BI capacities
Monitoring is a big part of governance. Without it you will have a hard time telling if users are following your governance strategy, including if you are compliant to the rules and regulations your organization needs to adhere to. The Power BI administrator might also want to monitor progress of the implementation of Power BI or create an inventory of Power BI artifacts for users to browse. This chapter will describe what to monitor from a governance perspective and what to monitor to build an inventory of Power BI artifacts. If your organization has Power BI Premium, you will need to monitor your capacities to make sure there are enough resources and that they are being used correctly. Monitoring capacities is also covered in this chapter. This chapter will not cover monitoring the gateway as that was covered in Chapter 14.
Monitoring activities
One of the main reasons to monitor any application is to see if it is being used correctly and its usage is in compliance with the rules and regulations the organization needs to adhere to. Power BI offers an audit log that administrators can use to see if Power BI is being used correctly and compliantly.
In the Power BI documentation, the logs are sometimes called audit logs and sometimes activity logs. In this chapter, we will refer to it as an audit log to prevent misunderstanding. Just be aware that when you read the words activity log in the Power BI documentation, it’s the same thing as audit log in this chapter.
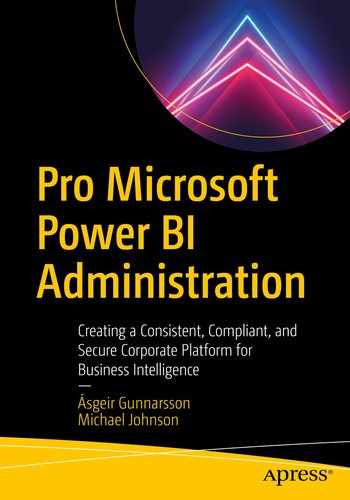
Turn on Power BI audit log
To get access to the audit log in the Office 365 Security and Compliance Center, you need to have the View-Only Audit Logs or Audit Logs role in Exchange Online or be a Microsoft 365 Global administrator. As these roles are very wide reaching and often unobtainable for Power BI administrators, Microsoft has also made the part of the audit log available through the Power BI Rest API. Extracting the data from each source is described in the following sections, as well as the pros and cons of each.
Microsoft 365
As mentioned above, the Power BI administrator needs to have the View-Only Audit Logs or Audit Logs role in Exchange Online or be a Microsoft 365 Global administrator to access the Power BI audit log in the Microsoft 365 Security and Compliance Center. The reason why Power BI administrators are not often granted those roles is that they not only give access to the Power BI audit logs but to all the Microsoft 365 logs that are stored in the Unified Audit log in Microsoft 365 Security and Compliance Center. There is potentially sensitive data in those other logs that the Power BI administrator is not allowed to see. If you are a member of one of those roles and can access the Microsoft 365 Security and Compliance Center, you can fetch data from the audit log in two ways. One is to log into the Microsoft 365 Security and Compliance Center, run the log query, and either view the results on the screen or download the results as a CSV file. Another way is to use the Office 365 Management Activity API, which is the preferred way if you want to automate the collection of the log information. To make it easier to extract the audit log using the API, Microsoft has created a cmdlet for PowerShell called Search-UnifiedAuditLog.
Note that the log is only stored in the Microsoft 365 Security and Compliance Center for 90 days, after which time it will be deleted. If you want to keep it for a longer time, you will need to collect it and store it in a different place such as data warehouse.
Your organization can increase the retention time of the audit log to 6 or 12 months if your organization has Microsoft 365 E5 or Microsoft 365 E5 Compliance add-on license. See https://docs.microsoft.com/en-us/microsoft-365/compliance/audit-log-retention-policies.
Power BI REST API
If you cannot get assigned the View-Only Audit Logs role, Audit Logs role in Exchange Online, or Microsoft 365 Global Administrator role, you can still get to the audit logs using the Power BI REST API. As a part of the Amin part of the Power BI REST API, there is an endpoint called Get Activity Events. To use the endpoint, you need to be a Microsoft 365 Global administrator or a Power BI administrator. The endpoint has some limitations as it can only be called 200 times an hour and you have to give a start and an end time or a continuation token. The endpoint is fetching data from the Microsoft 365 Security and Compliance Center, but it will only provide you with access to the last 30 days of activities no matter what retention policy your organization is using for the Microsoft 365 audit logs.
If you call the Get Activity Events directly, you have to have a single quotation mark (’) around the supplied datetime. This is not shown in the documentation.
When calling the Get Activity Events REST API endpoint, the start time and end time must be within the same UTC day. This is also the case when you call it using the Get-PowerBIActivityEvent PowerShell cmdlet.
Strategy for monitoring activities
Where to export the activities data from
How to export the audit log data
How to store the exported data
Enrichment of the exported data
Reporting on the exported data
This section will try to answer these questions to help you build a successful strategy for monitoring Power BI activities.
Where to export the activities data from
As discussed above you have two options for accessing the Power BI audit log. You can either access it through the Office 365 Management Activity API (excluding the option to manually download the data from the Microsoft 365 Security and Compliance Center) or through the Power BI REST API. The only difference between the two places is how many days of data you can get. The Office 365 Management Activity API exposes the full unified audit log, which is stored by default for 90 days but can be stored up to 12 months. The Power BI REST API exposes only the last 30 days of the unified audit log. If you are starting from scratch, then using the Office 365 Management Activity API will give you more historical data and thereby a bigger chance to answer governance questions that come up. After you have harvested the historical data, we recommend you run a daily query to get the previous days’ activities as well. By doing this you don’t have to worry about which place you get the data from, or how to handle duplicate data (which you might have if you export partial days). To support the scenario mentioned, we recommend that you initially get data straight from the unified audit log either via the Office 365 Management Activity API or manual download from the Microsoft Security and Compliance Center. We realize that getting access to the audit log in the Security and Compliance Center can be difficult, which is why a manual download of the Power BI audit log by someone who has enough access might be the best option. If you cannot get access to the audit logs in the Security and Compliance Center, or have someone with enough access to download the last 90 days of data for you, you should use the Power BI REST API to get the last 30 days. After the initial load, you can use the Power BI REST API to get the previous days’ activities each day.
Make sure you monitor the export of the audit log, since if it fails for some reason, you need to fetch the data again. Missing days in your audit log can have harmful consequences if you need the data for compliance purposes.
How to export the audit log data
As mentioned earlier, using the Power BI REST API endpoint Get Activity Events is the easiest when you have made the initial load of historical data. If we assume that you are using the Get Activity Events endpoint to export the data, the question is do you want to build your own application to query the REST APIs or do you want to use PowerShell? Building your own application can be done in many ways and with different programming languages. For this reason, we are not covering that scenario, although that can be your best option if you have the expertise and budget. If you decide on the PowerShell route, you can use the Microsoft-provided cmdlets to interact with the REST API, or use the Invoke-PowerBIRestMethod cmdlet. If you decide to use the Get-PowerBIActivityEvent PowerShell cmdlet, you should make sure it returns all the events that interest you. You should also periodically check if there are new events that are monitored in the audit log and if the cmdlet returns them.
We recommend that you query the Get Activity Events endpoint using the Invoke-PowerBIRestMethod cmdlet daily. The process is straightforward, and by querying the endpoint directly you don’t have to worry about if it’s returning all the events. By querying it daily, you can extract the previous days’ data, so you avoid extracting partial days with possible data duplication risk. You can use many different tools to execute and automate the daily of run the PowerShell cmdlet. Most integration tools offer the ability to run PowerShell scripts either directly or as a command line. If the integration tools your organization is using do not have the ability to run PowerShell scripts, you could consider Microsoft Azure Functions or Microsoft Azure Data Factory depending on your expertise and budget.
More information about the audit log and how to collect the data can be found here: https://docs.microsoft.com/en-us/power-bi/service-admin-auditing.
How to store the data
We recommend that you store the audit data in your preferred data storage for analysis. This might be a database or a data lake or something entirely different. The important part is that you store the data where you can easily access it for analysis. We recommend that the data is stored in your data warehouse or equivalent to make it available for analysis. If the data is hard to reach or hard to parse, you will most likely only have it available when a governance breach happens, or an audit is being performed. Having the data available means you can use the data for other purposes, such as for preventive actions and maintenance or to document implementation progress.
Depending on how you decided to export the audit data, there might be a need to transform the raw data during export into the data warehouse/lake. When you export the data using PowerShell, the data will be either in tabular or JSON format depending on if you use the purpose-built cmdlets or the Invoke-PowerBIRestMethod cmdlet. You can decide to parse the data inside the PowerShell script or export the data in a raw format. Which way you go depends on the skillset at your disposal and if you want to keep raw originals. If you export raw JSON or CSV files, you need to make sure to have an archiving strategy in place as you don’t want to parse all the files each time, especially if you are using cloud resources as it will not only take longer but also cost more money.
Most integration tools can parse JSON or CSV files, but the authors have experienced that Azure Data Factory had issues with the @ sign in the JSON format outputted by the Power BI REST API.
Enrichment of the exported data
At the time of this writing, the audit log data is reasonably complete except in one area. The users are just GUID IDs. To be able to analyze the data down to the user level, you need to enrich it with user information from Azure Active Directory. In Azure Active Directory, the GUID ID can be matched to a name and possible host of other information such as department, function, etc. Not all organizations use all the possible fields in Azure Active Directory, so what is available varies from organization to organization. All organizations will have the user’s name, and many will have other fields filled out. Having user information in your dataset allows for much richer reporting and is required if you need to trace a governance breach to a person.
Reporting on the exported data
Most popular reports/dashboards/workspaces
No. active users/reports/dashboards over time
Days of inactivity by users
Users signed up for trial licenses
Creators vs. viewers
Updated admin settings
Analyzed by an external application
Download report form the Power BI Service
Imports (publishes from Power BI Desktop)
If you have reporting down to named users, you might want to make sure you are not violating privacy rules and regulations. Some reports are well suited to be available to all the organization, while others should be restricted to persons who are authorized to view them. Determining if a report falls into one or another category is up to the individual organization as their requirements differ so greatly.
Conclusion
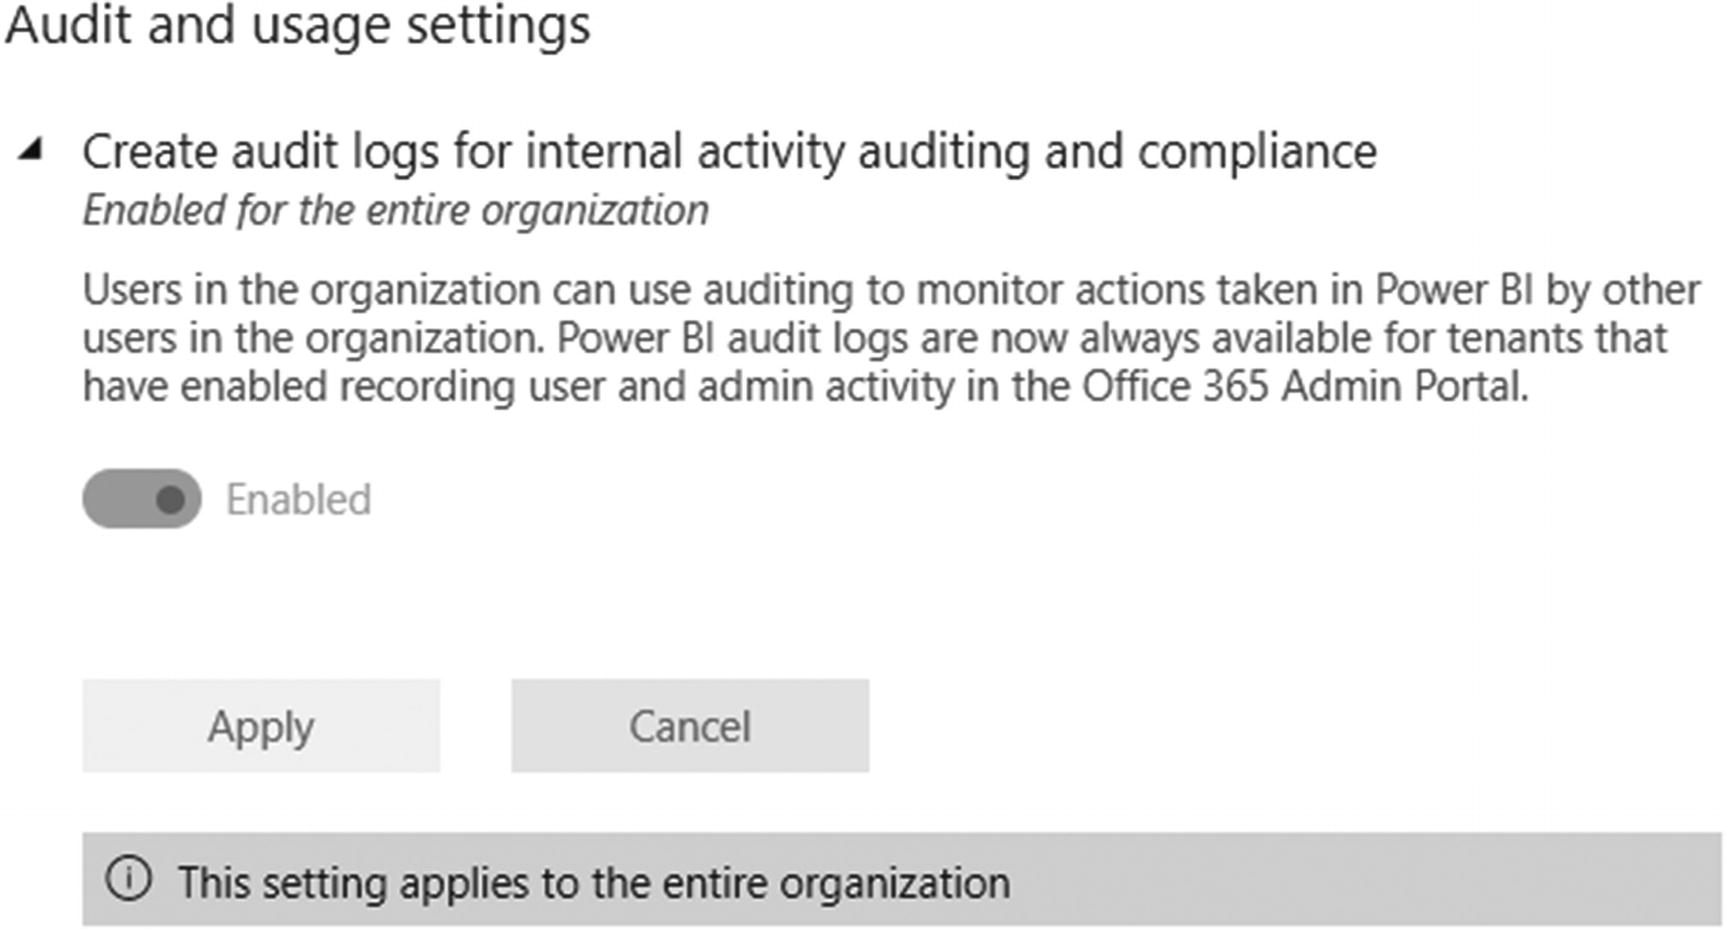
Audit log capture architecture
Monitoring artifact inventory
One of the key things in many governance strategies is to know what artifacts you have. Knowing what reports, datasets, etc. that exist in your tenant will help you understand the scope of your governance effort. It could also be important to know how the inventory has developed over time to aid in your implementation effort or to secure more funding for future Power BI projects. Whatever your motivation, you can build up a Power BI artifact inventory by using the Power BI REST API to query your tenant for artifacts. These artifacts are dashboards, reports, datasets, workspaces, dataflows, and capacities as well as information about the owners of these artifacts and access to workspaces. Besides creating the artifact inventory, the Power BI REST API allows you to do many tasks such as create and alter objects, as well as manage your environment. More information about the Power BI REST API can be found in Chapter 16 which covers Administration tools. This chapter will only focus on the information collection part of the API.
When you query the API, you can output the information in two main ways. You can show it on the screen, which is useful for spot checks or error handling. You can also write the information to a file or a database for storage or further processing. We highly recommend that you query the API regularly and store the information in a file or database and then put it in a managed data storage such as a data warehouse so that you can report on the data.

Report inventory development
Challenges
What data to gather
How to gather the data
How to process the data
How to report on the data
What data to gather
We suggest that you gather data about all the artifacts you can. You might decide to leave out artifacts that you are not using, but that might be a mistake. An example of this is dataflows. You might leave them out as you are not using dataflows. The problem is that unless you have turned off the ability to create dataflows, you cannot know if anyone is creating them if you don’t collect the information. So, our advice is to collect it, and if there is no information, it will be empty. You might then decide to create an alert to notify you if anyone creates a dataflow so you can make sure they are following best practices.
Workspaces
Reports
Dashboards
Datasets
Dataset refreshes
Datasources
Users
Dataflows
Gateways
Capacities
Note that information about users are restricted to usernames. If you want more information about users, you can use the Azure Active Directory REST API or the directory service you use.
How to gather the data
There are several ways you can gather the data. Some of the methods you can use are to build a custom application, write a script in your favorite integration tool, such as SSIS or Azure Data Factory, or you can use PowerShell. If you decide to use PowerShell, Microsoft has wrapped a lot of the REST API endpoints in cmdlets. The cmdlets make it a lot easier to query the API. Microsoft has also created a cmdlet called Invoke-RestMethod that allows you to call REST API endpoints directly from PowerShell without them being wrapped in a cmdlet. The Invoke-RestMethod cmdlet allows you to use the whole of the REST API from PowerShell.
No matter what method you use, you will need to output the data into a place where you can further process it. This location can be a file, database, or other storage option. If you use the cmdlets, you will get the data in a tabular format, but if you use the REST API directly or via the Invoke-RestMethod in PowerShell, the output will be a JSON file. That file will need to be processed to get the content into a format suitable for reporting.
How to process the data
As with most other things related to the Power BI REST API, there are several methods for processing the data. The simplest one is to use Power BI to process the data and report on it. Power BI knows how to handle databases, csv, and JSON files, which are the most common outputs. The drawback in using Power BI is that the data cannot be exported or accessed outside of the Power BI ecosystem, and therefore is not available for any other tool. Another drawback is that if you output to files, you will need to keep all the files, as Power BI does not store data. We recommend that you process the data into a tabular format in a data warehouse or a data mart. Storing data this way will make the data management easier, and separate the tool from the data.
As a lot of the data will be in a JSON format, you need to find a way to parse the JSON into a tabular format. There are several ways to do this. If we exclude Power BI due to the limitation described above, the choice comes down to what your data integration strategy is. Are you on-premises, or in the cloud? Are you using BI professional tools or self-service tools? The answer to these questions will influence your decision.
If you are using cloud tools, then Azure Data Factory, Azure Functions, or Microsoft Power Automate might be your best choice. If you are using on-premise, you might use SQL Server Integration Services. No matter what tool you use, it needs to be able to parse the files, write the output to a database, and archive the files already processed.
When parsing the JSON file in Azure Data Factory, you need to remove or escape the @ from the @odata.context tag in the files as Azure Data Factory will not parse them otherwise.
As said before, no matter what your tool of choice is, we recommend that you store your data in a data warehouse or a data mart so that you can report on it in whatever tool you choose to use.
Depending on the tool you choose for gathering and parsing the data, your choice of automation might differ. Most of the tools mentioned before have an orchestration included, but if your tool of choice doesn’t, you need to find one that will. Whatever tool you choose, your orchestration method should automate as much of it as you can. Just make sure you don’t create duplicate information. In that respect it’s always a good idea to try to query one day at a time, and always a whole day at a time. Of course, there might be a situation where more frequent queries are needed, and if they are, you need to handle the possible duplication.
How to report on the data
Maybe the right question here is what to report on. The issue with that is that it’s unique to each organization, depending a bit on what you are trying to achieve. Do you want to allow people to browse your inventory? Do you want to tell people about the development of your Power BI implementation? Or is your main goal to govern your Power BI tenant(s)? Depending on your goals, the “what and how” you report on it might change. Our main advice here is to report on it. Don’t just collect the data; make it available to your users.
You are implementing Power BI, and you need ammunition to convince management to keep funding it. Show them a report showing the development over time of your artifacts as well as usage.
Your users don’t know what reports or datasets exist and don’t have access to the right workspaces or apps to figure it out. Allow them to browse your inventory of reports and datasets and show them how to request access to them.
Conclusion
The main reason to collect the information about your artifacts is often to create a repository of artifacts in a tenant. This information can then be used to document what exists from a governance perspective, or to collect the information over time to see the development and thus document the implementation of Power BI. This information collecting can be useful to secure resources and to make success visible. Since users only see Power BI artifacts such as reports after they have been given access to them, you can also use the artifact inventory to allow users to find what exists, and thereby giving them chances of discovering something useful for their work. To make that work efficiently, you need to show them a description, the owner, as well as how to then ask for access to an artifact.

Audit log and artifact inventory capture architecture
Monitoring capacities
If your organization has Power BI Premium or Power BI Embedded capacities, that provides access to dedicated hardware. This dedicated hardware is a finite resource, and the administrator needs to make sure that the hardware is being used correctly and that you have resources available. If there are not enough resources available, datasets get evicted from memory and need to be loaded back in when used. Reloading models takes time, and depending on the type of dataset, it could be mean unacceptable wait times for end users. Monitoring capacities will allow you to keep an eye out for potential issues and debug issues that have already happened.
How to monitor capacities
Power BI does not offer a REST API access to the capacities; instead there is a Power BI Template App available in AppSource. You install the app by navigating to Appsource in the Power BI Service, choosing Template apps, and finding the Power BI Premium Capacity Metrics App. When you install the app, it will add a dashboard, a report, and a dataset into a new workspace you can name. Since it’s installed into a new workspace, you have access to the dashboard, report, and dataset. You can customize the dashboard and the report, and you can connect to the dataset from Power BI Desktop or in the Power BI Service to create your own reports and dashboards.
Make sure you add a refresh schedule to the dataset to keep it up-to-date.
What to monitor
The Power BI Premium Capacity Metrics App has a premium capacity health center that gives you a quick overview of the health of your capacity. It has three KPIs, Active memory, query waits, and refresh waits, which can give you an indication about if there is something you need to take a closer look at.
The active memory KPI shows how often the active memory has gone above 70% threshold in the last 7 days. It’s normal that the active memory goes above 70% threshold as you want to utilize the resources you have. But if it’s happening very frequently, it might indicate that you need to manage memory better. The KPI, therefore, helps you plan for when to increase your capacity or reduce the number or size of datasets.
The query waits KPI shows how many queries waited more than 100 milliseconds in the last 7 days. If many queries are waiting more than 100 milliseconds, it could indicate that there are not enough CPU resources available. A lack of sufficient CPU resources can be caused by long running queries taking a lot of resources, or too many queries for the resources available. The KPI, therefore, helps you plan for when to increase your capacity or reduce the number or size of datasets.

Power BI Premium Capacity Metrics App Health Center
Datasets
Paginated reports
Dataflows
AI
Resource consumption
IDs and info
Each segment gives you more detailed insights into a particular area of interest when monitoring capacities.
The datasets section contains detailed information about the health of the datasets that are stored in your capacities. It includes information on refreshes, query durations, query waits, and general information about the dataset resource consumption.
The Paginated reports section contains aggregated information about the usage of paginated reports as well as some aggregated performance metrics.
The dataflow section contains information about dataflow refreshes and some aggregated performance metrics for the dataflows in your capacities.
The AI section gives you information about memory consumptions, execution, and wait times, as well as overall usage for the AI workloads in your capacities.
The resource consumption section shows the consumption of CPU and memory for the last 7 days.
The IDs and Info section shows metadata information for capacities, workspaces, datasets, paginated reports, and dataflows. It also shows who the administrators for the capacity are.
Conclusion
To monitor Power BI Premium capacities, you need to use the Power BI Premium Capacity Metrics App. The app is a template app you can find in AppSource in the Power BI Service app section. When you have installed it, you will get a dashboard, report, and dataset with information about your capacities. You can customize the dashboard and report and create new reports and dashboards from the dataset.
It’s very important to monitor your capacities, as they are finite resources. If you are running out of resources, your users will have to wait for reports to load, and your developers might see failure in publishing reports and refreshing datasets.
Monitoring gateways
The gateway is the only component of the Power BI ecosystem which is not a SaaS or PaaS. You need to install it on your hardware and monitor it using your tools. Chapter 14 describes the gateway in detail, including how to monitor it. You can refer to Chapter 14 for more information.
Summary
There are several types of monitoring you can do for your Power BI environment. From a governance perspective, monitoring activities is the most important one. From an administration perspective, monitoring your capacities (if you have Power BI Premium), the On-premises data gateway (if you are using it), and the development of your inventory of Power BI artifacts is vital.
Make sure you turn on the Power BI audit log if it’s not been done through Microsoft 365 and start collecting the data early. The audit log is only stored for a certain amount of days, depending on your retention policy in Microsoft 365 Security and Compliance Center.
Call to action
Turn on audit logging for Power BI.
Start collecting the data outside of Power BI as it’s only stored within the Microsoft 365 Security and Compliance Center for 90 days by default.
Collect your Power BI artifact inventory daily using the Power BI REST API to be able to document the development, and allow users to browse the inventory.
Install the Power BI Premium Capacity Metrics App to monitor Power BI Premium capacities.
Remember to add a refresh schedule to the dataset from the Power BI Premium Capacity Metrics App.
Make sure you read Chapter 14 for how to monitor the On-Premise Data Gateway.